

Abstract
Inflammatory bowel disease (IBD) may result from exaggerated stimulation of the mucosal immune system by luminal bacterial flora. Bacterial products are recognized by pattern recognition receptors such as Toll-like receptors (TLRs), which are key regulators of the innate immune system. Therefore, the expression of TLR2, TLR3 and TLR4 in colonic biopsy samples taken from children with active IBD were studied and compared to controls. Colonic biopsy samples were collected from macroscopically inflamed and non-inflamed regions of the mucosa of 12 children with freshly diagnosed IBD (fdIBD) and 23 children with relapsed IBD (rIBD). Specimens were also obtained from eight controls. TLR2, TLR3 and TLR4 mRNA expression and protein levels were determined by real-time reverse transcription polymerase chain reaction (RT–PCR) and Western blot. We found higher TLR2 and TLR4 mRNA and protein levels in the inflamed colonic mucosa of children with fdIBD and rIBD compared to controls. In the non-inflamed colonic mucosa of children with fdIBD and rIBD, TLR2 and TLR4 mRNA and protein levels were similar to controls. TLR2 and TLR4 mRNA and protein levels also did not differ between children with fdIBD or rIBD in either inflamed or non-inflamed colonic mucosa. TLR3 mRNA expression and protein levels were similar in all groups studied. Our results of increased levels of TLR2 and TLR4 in the inflamed colonic mucosa of children with IBD confirm the hypothesis that innate immunity has an important role in the pathogenesis of this disease.
Keywords: children, colon biopsy samples, expression pattern, inflammatory bowel disease, Toll-like receptors
Introduction
IBD classically includes two forms, ulcerative colitis (UC) and Crohn's disease (CD), presenting different patterns of chronic inflammation in the gastrointestinal tract [1]. Many experimental and clinical observations suggest the involvement of intestinal microflora in the pathogenesis of IBD [2]. In recent years there has been rapid progress in our understanding of the ‘cross-talk’ between bacteria and intestinal epithelial cells, helping to understand the intestinal homeostasis and underlying inflammatory changes observed in IBD [3].
In a healthy individual, the intact intestinal epithelial barrier helps to prevent commensal organisms or food antigens from entering the lamina propria [4,5]. The few commensal organisms or antigens which cross the barrier will be phagocytosed by macrophages without provoking proinflammatory cytokine production, and in the absence of reactivation the T cells would die by apoptosis [6,7].
In active IBD, immunological tolerance towards endogenous microflora does not exist [8,9]. This lack of tolerance might be due to an imbalance between protective and aggressive commensal luminal bacterial species (dysbiosis) [10], a decreased barrier function and/or an impaired mucosal clearence [4,11] and lack of regulatory T cells [12] and immunosuppressive cytokines [13]. In this case, the commensal flora either enter in increased numbers or persist in the lamina propria, which may lead to CD4+ T cell activation [14], increased intestinal permeability and finally chronic inflammation [7]. In general, CD is characterized by interleukin (IL)-12, IL-18, interferon (IFN)-γ and tumour necrosis factor (TNF)-α, while UC is characterized by IL-4 and IL-5 production [15–17].
Evidence is emerging that the underlying mechanisms of intestinal epithelial tolerance versus intolerance towards lumenal bacterial ligands are mediated distinctly through Toll-like receptors (TLRs) and other pattern recognition receptors of the innate immune system [18]. Mammalian TLRs comprise a family of (so far) 11 individual type I transmembrane receptors, which recognize conserved pathogen-associated molecular patterns (PAMPs) [19,20]. TLR2 interacts with peptidoglycan, a component of all bacterial cell walls, as well as additional constituents of Gram-positive bacteria, mycobacteria and fungi [21]. TLR3 recognizes double-stranded RNA and initiates immune responses to specific viral pathogens and the standard immunostimulant polyinosine-polycytidylic acid [22]. The most important TLR4 ligand is lipopolysaccharide (LPS, endotoxin), which is a major component of the Gram-negative bacterial outer membrane [23]. Interaction of PAMPs with TLRs triggers a complex signalling pathway that leads to the activation of several transcription factors, such as nuclear factor κB, which then induce the activation of the inflammatory genes such as TNF, IL-1, IL-6 and IL-8 [20,24,25].
Recent human adult studies showed that IBD is associated with distinctive changes in mucosal TLR expression [26], and there is an inflammation-dependent induction of TLR2 and TLR4 expression in intestinal macrophages [27]. To the best of our knowledge, there has been no paediatric study to examine the intestinal expression of TLRs in children with IBD. Therefore, our aim was to analyse TLR2, TLR3 and TLR4 mRNA expression and protein levels in the colonic mucosa of paediatric IBD patients.
Patients and methods
Patients
Twelve children (eight boys, four girls; median age 13 years, range 6–18 years) with freshly diagnosed IBD (fdIBD) and 23 children (14 boys, nine girls; median age 15 years, range 8–18 years) with active IBD after relapse on treatment (rIBD) underwent colonic biopsy sampling from macroscopically inflamed and non-inflamed mucosa. In each case the diagnosis was confirmed by standard endoscopic and histological examination of each sample. In the fdIBD group, eight children had a diagnosis of CD and four children had a diagnosis of UC, before any medication. Characteristics of fdIBD patients are depicted in Table 1. Activity score was calculated by means of PCDAI (Paediatric Crohn's Disease Activity Index) and PUCAI (Paediatric Ulcerative Colitis Activity Index; see References in Table 1). Relapse was defined in patients with rIBD as a PCDAI/PUCAI > 15.
Table 1.
Clinical characteristics of the freshly diagnosed inflammatory bowel disease (fdIBD) study population.
| Patient | Form of IDB | Age (years) | Gender | Main complaints at presentation | Activity score* |
|---|---|---|---|---|---|
| 1 | CD | 15 | M | Blood in faeces, back pain | 30 |
| 2 | CD | 12 | F | Blood in faeces, abdominal pain | 25 |
| 3 | CD | 16 | M | Fatigue, weight lost, anaemia | 35 |
| 4 | CD | 5 | M | Blood in faeces, abdominal pain | 25 |
| 5 | CD | 14 | M | Blood in faeces, abdominal pain | 25 |
| 6 | CD | 12 | F | Blood in faeces, abdominal pain | 30 |
| 7 | CD | 16 | M | Blood in faeces, arthritis | 20 |
| 8 | UC | 17 | M | Anaemia, blood in faeces | 45 |
| 9 | CD | 14 | M | Blood in faeces | 20 |
| 10 | UC | 18 | M | Bloody diarrhoea | 35 |
| 11 | UC | 9 | F | Blood in faeces, abdominal pain | 35 |
| 12 | UC | 5 | F | Bloody diarrhoea | 35 |
The rIBD group consisted of 16 children with CD and seven children with UC. In the rIBD group, seven children with CD and three children with UC were receiving prednisolone and 5-aminosalicilate (5-ASA), five children with CD and four children with UC were receiving prednisolone, azathioprine and 5-ASA, two children with CD were receiving azathioprine and 5-ASA and two children with CD receiving 5-ASA. The control group consisted of eight children (five boys, three girls, median age 14 years, range 6–16 years) with macroscopically and histologically normal intestine, who had been referred with rectal bleeding or obstipation. No significant age- or sex-related differences were observed among children with fdIBD, children with rIBD and controls [P = not significant (n.s.)].
Biopsy samples were frozen immediately and stored at −80°C until further processing. Written informed consent was obtained from the parents of each participant prior to the procedure, and the study was approved by Semmelweis University Regional and Institutional Committee of Science and Research Ethics (TUKEB: 73/2003).
Methods
RNA isolation and real time RT–PCR
Total RNA was isolated from the colonic biopsy samples by RNeasy Total RNA Isolations Kit (Qiagen GmbH, Hilden, Germany), according to the manufacturer's instructions. The quality and quantity of the RNA were confirmed photometrically. One μg of total RNA was reverse-transcribed using SuperScript II RNase H– (Gibco/BRL, Eggenstein, Germany) to generate first-strand cDNA.
TLR2, TLR3 and TLR4 mRNA expression were determined by SYBR Green real-time PCR on a Light Cycler system (Roche Diagnostics, Mannheim, Germany). The TLR PCRs were performed in glass capillaries, in a final volume of 20 μl containing 3 mM (TLR2, TLR3) or 4 mM (TLR4) MgCl2, 0·2 μM of each primer, 2 μl of the LightCycler FastStart DNA Master SYBR Green I (Roche Diagnostics, Mannheim, Germany) and 1 μl of cDNA. The conditions of PCRs were as follows: one cycle at 95°C for 8 min, followed by 55–65 cycles at 95°C for 3 s, 59°C (TLR2), 63°C (TLR3) and 61°C (TLR4) for 5 s and 72°C for 28 s with a single fluorescence detection point at the end of the extension.
The mRNA expression of glyceraldehyde-3-phosphate dehydrogenase (GAPDH) was determined by real-time PCR quantification using fluorescence resonance energy transfer (FRET) hybridization probes on a Light Cycler system (Roche Diagnostics, Mannheim, Germany). The GAPDH PCR was performed in a final volume of 20 μl containing 2 mM MgCl2, 0·17 nM of each hybridization probe, 0·5 nM of each primer, 2 μl of the Light-Cycler FastStart DNA Master HybProbe (Roche Diagnostics) and 1 μl of cDNA. The PCR reaction was carried out using the following conditions for GAPDH: one cycle at 95°C for 8 min, followed by 50 cycles at 95°C for 4 s, 55°C for 8 s and 72°C for 22 s with a single fluorescence detection point at the end of the annealing segment. The sequences of the specific primer pairs and probes (Tibmolbiol, Berlin, Germany) for TLR2, TLR3, TLR4 and GAPDH are presented in Table 2.
Table 2.
Nucleotide sequence of specific primer pairs and probes applied for the real time detection of Toll-like receptor 2 (TLR2), TLR3, TLR4 and glyceraldehyde-3-phosphate dehydrogenase (GAPDH).
| Gene | Primer pairs and probes | Product length |
|---|---|---|
| TLR2 | Forward: 5′-AGT TGA TGA CTC TAC CAG ATG-3′ | 598 bp |
| Reverse: 5′-GTC AAT GAT CCA CTT GCC AG-3′ | ||
| TLR3 | Forward: 5′-ACA CAC TTC CAG CAT CTG TC-3′ | 623 bp |
| Reverse: 5′-TGC TGT TAA CAA TTG CTT CTA G-3′ | ||
| TLR4 | Forward: 5′-CTT ATA AGT GTC TGA ACT CCC-3′ | 680 bp |
| Reverse: 5′-TAC CAG CAC GAC TGC TCA G-3′ | ||
| GAPDH | Forward: 5′-CAC CAC CAT GGA GAA GGC TG-3′ | 240 bp |
| Reverse: 5′-GTG ATG GCA TGG ACT GTG-3′ | ||
| Probe 1: 5′-LCRed460-CCC TGG CCA AGG TCA TCC ATG A-PH-3′ | ||
| Probe 2: 5′-TCC TGC ACC ACC AAC TGC TTA GC-FL-3′ |
bp: Base pairs.
After each Light Cycler run, PCR products were separated by electrophoresis on 2·5% agarose gels and visualized by staining with ethidium bromide. In order to control the length of the generated PCR products, a 100 base pairs (bp) DNA ladder (Invitrogen, Carlsbad, CA, USA) was used.
Quantification was performed with a second derivative method by monitoring the cycle number at which the fluorescent signal could be distinguished from the background (crossing point). Serially diluted cDNA samples were used as external standards. Results were analysed using Light-Cycler software version 3·5.3.
Protein isolation and Western blotting
Colonic biopsy specimens were solubilized in a sample buffer containing 10 μg/ml leupeptin, 10 μg/ml aprotinin, 1% Triton X-100, 0·1 M Tris-HCl (pH = 8·0), 1 mM ethylene glycol-bis (2-aminoethylether),N,N,N′,N′-tetraacetic acid (EGTA), 5 mM NaF, 1 mM phenylmethylsulphonylfluoride (PMSF) and 10 mM Na-orthovanadate (Na3VO4) (each substance was purchased from Sigma Chemical Co., MO, USA). The lysed samples were centrifuged (10 000 g, 5 min, 4°C) to pellet nuclei and large cellular fragments. Protein concentration of the supernatants was determined by Bradford assay (Bio-Rad Laboratories, Hercules, CA, USA).
Twenty 160-μg protein samples were separated for the determination of TLR2, TLR3 and TLR4, respectively, by 10% sodium dodecyl sulphate-polyacrylamide gel electrophoresis (SDS-PAGE) at 120 V and 40 mA for 90 min (Penguin™ Dual-Gel Water Cooled Systems; Owl, NH, USA). Prestained protein mixture (BenchMark™; Gibco/BRL) was used as a marker of molecular mass. Cellular extract from peripheral blood leucocytes was used as a positive control for human TLR2 and TLR4 [28], and COLO320DM cell lysate (sc-2226, Santa Cruz Biothechnology, Inc., Santa Cruz, CA, USA) was used as a positive control for human TLR3. Separated proteins were then transferred to nitrocellulose membrane (Hybond™ ECL™, AP Biotech, Little Chalfont, UK) in transfer buffer containing: 25 mM Tris, 170 mM glycine and 20% methanol at 70 V, 220 mA for 120 min (MiniTank™ electroblotter; Owl, NH, USA).
Non-specific binding sites were blocked for 2 h (23°C) in a blot solution containing 5% non-fat dry milk and PBS. Blots were then incubated for 60 min (23°C) with goat polyclonal antibodies [TLR2 (N-17), TLR3 (Q-18), TLR4 (C-18) goat polyclonal IgG; Santa Cruz Biothechnology, Inc.] diluted to 1 : 200 (TLR2) or 1 : 100 (TLR3 and TLR4). Equal protein loading to the gel was confirmed by staining with a goat polyclonal antibody raised against actin [actin (C-11) goat polyclonal IgG; Santa Cruz Biotechnology, Inc.] diluted to 1 : 200.
Blots were then washed and incubated with peroxidase conjugated secondary anti-goat IgG antibody diluted to 1 : 2500 (TLR2, TLR3, TLR4) or 1 : 1500 (actin) for 30 min (23°C) (mouse anti-goat IgG-HRP; Santa Cruz Biotechnology, Inc.). Immunoreactive bands were visualized using the enhanced chemiluminescence (ECL) Western blotting detection protocol (AP Biotech, Little Chalfont, UK). Computerized densitometry of the specific bands were analysed with Gel-Pro Analyser version 3·1 software (Media Cybernetics, Silver Spring, MD, USA). The values were normalized to an internal standard and expressed as the relative optical density.
Statistical analysis
Data were analysed using Statistica version 6·0 software (StatSoft, Inc., Tulsa, OK, USA). After testing the normality with Shapiro–Wilk's test, the non-parametric Mann–Whitney U-test was used to determine the levels of difference among all groups for TLR2, TLR3 and TLR4 mRNA expression and protein levels in the colonic biopsy samples. P-values less than or equal to 0·05 were considered statistically significant. Data are expressed as mean ± standard deviation (s.d.).
Results
TLR2, TLR3 and TLR4 mRNA expression
Figure 1 shows the mRNA expression of TLR2, TLR3 and TLR4 using real-time PCR as detected in the colonic mucosa of representative samples from children with fdIBD (fdCD and fdUC), children with rIBD (rCD and rUC) and controls. We found no difference in the mRNA expression of either TLR2, TLR3 or TLR4 comparing the colonic mucosa of children with fdCD to fdUC or rCD to rUC (P = n.s.).
Fig. 1.
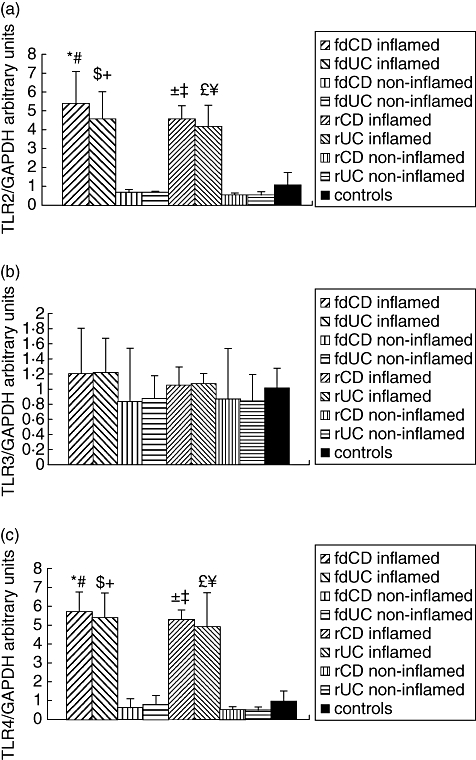
Toll-like receptor (TLR) 2, TLR3 and TLR4 mRNA expression in the colonic mucosa of representative samples from children with freshly diagnosed inflammatory bowel disease (fdIBD), children with relapsed IBD (rIBD) and controls. mRNA expression of TLR2 (a), TLR3 (b) and TLR4 (c) were determined by real-time reverse transcription–polymerase chain reaction. Results were analysed by using Light-Cycler software version 3·5·3. The type of standard curve analysis used was second-derivative maximum with r = −0·98, error = 0·343 at TLR2, r = −1·00, error = 0·0994 at TLR3, r = −0·99, error = 0·264 at TLR4 and r = −1·00, error = 0·101 at GAPDH. Data are expressed as mean ± standard deviation. Analysis of significance was performed by Mann–Whitney U-test. ( ) Freshly diagnosed Crohn.s disease (fdCD) inflamed versus fdCD non-inflamed (P < 0·001), () fdCD inflamed versus controls (P < 0·01), (
 ) freshly diagnosed ulcerative colitis (fdUC) inflamed versus fdUC non-inflamed (P < 0·05), () fdUC inflamed versus controls (P < 0·05), (
 ) rCD inflamed versus rCD non-inflamed (P < 0·0001), (
 ) rCD inflamed versus controls (P < 0·01), (
 ) rUC inflamed versus rUC non-inflamed (P < 0·001), (
 ) rUC inflamed versus controls (P < 0·01).
The TLR2 mRNA expression was increased significantly in the inflamed colonic mucosa of children with fdIBD and rIBD compared to controls (P < 0·001 and P < 0·0001, respectively). In the non-inflamed mucosa of children with fdIBD and rIBD, the TLR2 mRNA expression was similar to controls (P = n.s.). The mRNA expression of TLR2 both in inflamed and non-inflamed mucosa were similar in children with fdIBD and rIBD (P = n.s.).
The TLR3 mRNA expression did not change significantly in the investigated groups (P = n.s.).
The TLR4 mRNA expression was increased significantly in the inflamed colonic mucosa of children with fdIBD and rIBD compared to controls (P < 0·001 and P < 0·0001, respectively). In the non-inflamed mucosa of children with fdIBD and rIBD, the mRNA expression of TLR4 was similar to controls (P = n.s.). The TLR4 mRNA expression in both inflamed and non-inflamed mucosa were similar in children with fdIBD and rIBD (P = n.s.).
TLR2, TLR3 and TLR4 protein levels
Western blot analysis of colonic biopsy specimens of representative samples from children with fdIBD, children with rIBD and controls with anti-TLR2, anti-TLR3 and anti-TLR4 goat anti-human polyclonal antibodies revealed distinct bands at 90 kDa (TLR2), 117 kDa (TLR3) and 89 kDa (TLR4) (Fig. 2). We observed no difference in the protein levels of either TLR2, TLR3 or TLR4 comparing the colonic mucosa of children with fdCD to fdUC or rCD to rUC (P = n.s.).
Fig. 2.
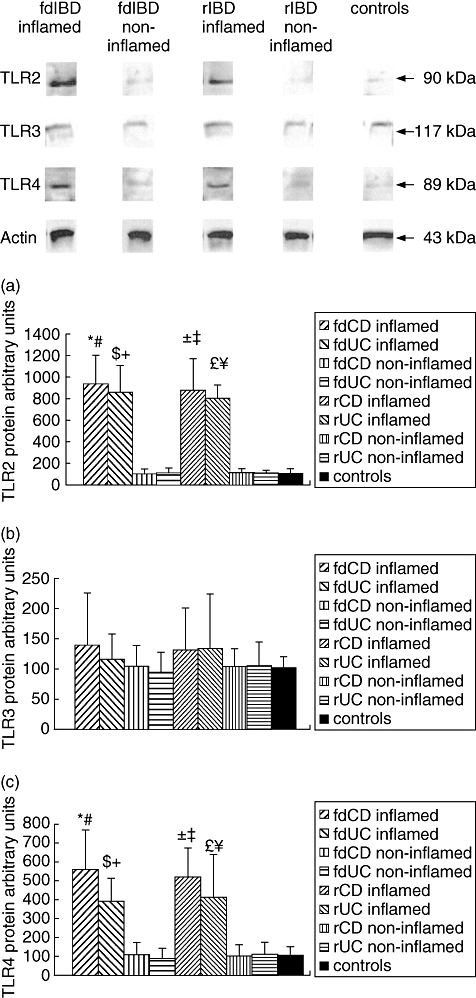
Toll-like receptor (TLR), TLR3 and TLR4 protein levels in the colonic mucosa of representative samples from children with freshly diagnosed inflammatory bowel disease (fdIBD), children with relapsed IBD (rIBD) and controls. Top, Western blot analysis of the colonic biopsy lysates with anti-TLR2, anti-TLR3 and anti-TLR4 goat polyclonal antibodies reveal one distinct band at molecular weight of 90 kDa (TLR2), 117 kDa (TLR3) and 89 kDa (TLR4). Bottom, data for protein levels of TLR2 (a), TLR3 (b) and TLR4 (c) were obtained by computerized analysis of the Western blots. Data are expressed as mean ± standard deviation. Analysis of significance was performed by Mann–Whitney U-test. () Freshly diagnosed Crohn.s disease (fdCD) inflamed versus fdCD non-inflamed (P < 0·01), () fdCD inflamed versus controls (P < 0·001), ( ) freshly diagnosed ulcerative colitis (fdUC) inflamed versus fdUC non-inflamed (P < 0·05), () fdUC inflamed versus controls (P < 0·01), () rCD inflamed versus rCD non-inflamed (P < 0·0001), () rCD inflamed versus. controls (P < 0·001), () UC inflamed versus rUC non-inflamed (P < 0·001), () rUC inflamed versus controls (P < 0·001).
TLR2 protein levels in the inflamed colonic mucosa of children with fdIBD and rIBD were about nine times higher than in controls, respectively (P < 0·001 and P < 0·0001). In the non-inflamed mucosa of children with fdIBD and rIBD, TLR2 protein levels were similar to controls (P = n.s.). TLR2 protein levels in both inflamed and non-inflamed mucosa were similar in children with fdIBD and rIBD (P = n.s.).
TLR3 protein levels did not change significantly in the studied groups (P = n.s.).
We found about fivefold elevation of the TLR4 protein levels in the inflamed colonic mucosa of children with fdIBD and rIBD compared to controls, respectively (P < 0·001 and P < 0·0001). In the non-inflamed mucosa of children with fdIBD and rIBD, TLR4 protein levels were similar to controls (P = n.s.). TLR4 protein levels in both inflamed and non-inflamed mucosa were similar in children with fdIBD and rIBD (P = n.s.).
Discussion
Chronic recurrent intestinal inflammation in IBD may result from undue stimulation of the mucosal immune system by the resident microflora in genetically predisposed individuals [3].
Cario et al. recently described the important role for commensal induced TLR2 signalling in enhancement of intestinal epithelial barrier function [29]. It is known that the TLR3 gene is localized on chromosome 4 at the border of a large linkage region of an IBD susceptibility gene, suggesting a potential pathogenic association of IBD with the TLR3 gene [26]. Moreover, TLR4 mutant (C3H/HeJBir) and TLR4-deficient mice show increased susceptibility to dextran sodium sulphate (DSS) colitis in comparison with wild-type mice, suggesting that commensal mediated protection of the intestinal epithelial barrier (together with other mucosal cells) might be impaired significantly in TLR4 dysfunction after toxic DSS damage [30,31].
In our study we aimed to depict the alteration of TLR2, TLR3 and TLR4 expression in colonic biopsy samples taken from children with active IBD either freshly diagnosed (fdIBD) or after relapse (rIBD) on treatment.
We found higher TLR2 and TLR4 mRNA expression and protein levels in the inflamed colonic mucosa of children with fdIBD and rIBD compared to controls. In the non-inflamed colonic mucosa of children with fdIBD and rIBD, TLR2 and TLR4 mRNA expression and protein levels were similar to controls. TLR2 and TLR4 mRNA expression and protein levels also did not differ between children with fdIBD or rIBD in either inflamed or non-inflamed colonic mucosa. TLR3 mRNA expression and protein levels remained unchanged in all groups studied. We observed no difference in the mRNA expression and protein levels of TLR2, TLR3 and TLR4 in the colonic mucosa of children with CD or UC.
Expression of TLRs in the intestinal mucosa has, as yet, been little investigated. Cario and Podolsky [26] assessed TLR2-TLR5 protein levels in colonic biopsy specimens taken from patients with active IBD (both CD and UC) and controls by immunohistochemistry and Western blot. They found that TLR2 and TLR4 protein levels were barely detectable in the colonic mucosa of controls. TLR4 protein levels were higher both in the inflamed and non-inflamed colonic mucosa of patients with active IBD than in controls, while TLR2 protein levels remained unchanged. TLR3 protein levels were lower both in the inflamed and non-inflamed colonic mucosa of patients with active CD than in controls, but were similar to controls in the colonic mucosa of patients with active UC.
In line with the results of Cario and Podolsky [26], we could also barely detect TLR2 and TLR4 protein levels in the colonic mucosa of controls. Our findings, that TLR4 protein levels were elevated in the inflamed colonic mucosa of children with fdIBD and rIBD compared to controls, are also congruent with the observations of Cario and Podolsky [26]. Nevertheless, in the non-inflamed colonic mucosa of children with fdIBD and rIBD we found similar TLR4 protein levels to controls. Moreover, we observed higher TLR2 protein levels in the inflamed colonic mucosa of children with fdIBD and rIBD than in controls, which does not support the observation by Cario and Podolsky. Our results, showing that unchanged TLR3 protein levels were unchanged in the colonic mucosa of children with CD or UC compared to controls, were also incongruent with Cario and Podolsky's findings. Our findings suggest that virus infection may not be a major element in the pathogenesis of IBD.
Hausmann et al. [27] analysed TLR1–TLR5 expression in the colonic mucosa of patients with IBD (CD and UC), sygmoid diverticulitis (SD) and controls by RT–PCR, Northern blot, immunohistochemistry and fluorescein activated cell sorter (FACS) flow cytometry. No TLR1–TLR5 expression could be found in the colonic mucosa of controls. They observed inflammation dependent induction of TLR2 and TLR4 expression in colonic macrophages. They could not detect TLR1 and TLR3 expression either in the colonic mucosa of patients with IBD or patients with SD. In line with Hausmann et al.'s results, we also found inflammation-dependent induction of TLR2 and TLR4 expression in the colonic mucosa of children with IBD. The incongruence between our results and the above-mentioned studies [26,27] is likely to be attributable to the discrepancy of age of patients (adults versus children) and the distinct control groups (colonic carcinomas versus rectal bleeding or constipation). Unfortunately, there is no comparative study between TLR expression of normal colonic mucosa in children and in adults. Nevertheless, there are several well-known discrepancies between paediatric and adult patients with IBD, also suggesting possible differences of expression of TLRs [32,33].
Hart et al. analysed TLR2 and TLR4 protein levels on colonic dendritic cells (DCs) of patients with newly diagnosed and treated active IBD (both CD and UC), as well as controls by FACS [34]. In healthy controls, few colonic DCs expressed TLR2 or TLR4; in contrast, DC expression of both TLRs was enhanced significantly in IBD. The proportion of DCs expressing TLR2 and TLR4 was higher in the inflamed than in the non-inflamed colonic mucosa of patients with IBD, while it did not differ significantly between the non-inflamed colonic mucosa of patients with IBD and controls, which supported our results. They found no correlation between the proportion of TLR-positive DCs and whether or not the patients were taking the immunosuppressive drug azathioprine, which was also congruent with our results.
Increased mucosal expression of TLR2 and TLR4 in IBD may be evolved in a number of ways. It is possible that the breakdown of the epithelial barrier and the massive contact with bacterial antigens in the inflamed mucosa found during mucosal inflammation could be responsible for the enhanced expression of TLRs [26,27]. Cytokines, bacterial products and necrotic cells have all been reported to modulate TLR expression [35]. T cell-derived cytokines, such as IFN-γ and TNF, which have a major role in the pathophysiology of IBD, caused increased intestinal epithelial expression of TLR4 in vitro [36,37]. Moreover, Wolfs et al. [38] observed that renal inflammation evoked by ischaemia markedly enhanced synthesis of TLR2 and TLR4 in the renal tubular epithelium, and it was completely dependent upon the action of IFN-γ and TNF. Our findings thatTLR2 and TLR4 mRNA expression and protein levels did not differ between the non-inflamed colonic mucosa of children with IBD (both fIBD and rIBD) and controls also support this theory. An alternative explanation for the increased TLR expression may lie in the recruitment of TLR-positive blood monocytes or DC populations to the inflamed bowel under the influence of inflammatory mediators [34,39]. Nevertheless, Hausmann et al. [27] suggested that macrophages in the inflamed tissue represent not only newly immigrated monocytes from the circulation, because TLR1 and TLR3 were down-regulated in intestinal macrophages of inflamed mucosa. Recent studies have suggested that the increased TLR expression may be caused by a local proliferation of macrophages with altered surface antigen expression [40]. To test these concepts, experimental studies will probably be required.
Irrespective of which pathways lead to increased TLR2 and TLR4 expression in IBD, a consequent alteration in microbial recognition may be central to the disease process. Canto et al. [41] demonstrated that the marked increase of TNF response to TLR2 ligands correlated with a higher TLR2 expression in a group of IBD patients. Moreover, CD40 expression on DCs and macrophages in the inflamed colonic mucosa of patients with IBD is increased by TLRs triggering with microbial products such as LPS and by cytokines including TNF [42,43]. Stimulation via CD40 results in the activation of DCs and macrophages and the production of cytokines, including IL-12, TNF, IL-6, IL-1α, IL-1β and IL-8 [34,44,45]. Enhanced production of IL-12, IL-6 and TNF may contribute to the pathogenesis of IBD [16,46–48].
Our results of increased TLR2 and TLR4 mRNA expression and protein levels in the inflamed colonic mucosa of children with IBD supports the potential implication of the innate immune system in the pathomechanism of this disease. However, the non-elevated expression of these PRRs in the non-inflamed mucosa may imply that the high TLR2 and TLR4 expression are not the cause, rather the consequence of IBD.
Acknowledgments
This study was supported by funds from the Hungarian National Scientific Research Foundation Grant (OTKA T046082).
References
- 1.Rogler G. Update in inflammatory bowel disease pathogenesis. Curr Opin Gastroenterol. 2004;20:311–17. doi: 10.1097/00001574-200407000-00003. [DOI] [PubMed] [Google Scholar]
- 2.Sellon RK, Tonkonogy S, Schultz M, et al. Resident enteric bacteria are necessary for development of spontaneous colitis and immune system activation in interleukin-10-deficient mice. Infect Immun. 1998;66:5224–31. doi: 10.1128/iai.66.11.5224-5231.1998. [DOI] [PMC free article] [PubMed] [Google Scholar]
- 3.Cario E. Bacterial interactions with cells of the intestinal mucosa: toll-like receptors and NOD2. Gut. 2005;54:1182–93. doi: 10.1136/gut.2004.062794. [DOI] [PMC free article] [PubMed] [Google Scholar]
- 4.Schultsz C, Van Den Berg FM, Ten Kate FW, et al. The intestinal mucus layer from patients with inflammatory bowel disease harbors high numbers of bacteria compared with controls. Gastroenterology. 1999;117:1089–97. doi: 10.1016/s0016-5085(99)70393-8. [DOI] [PubMed] [Google Scholar]
- 5.Mayer L, Eisenhardt D, Salomon P, et al. Expression of class II molecules on intestinal epithelial cells in humans. Differences between normal and inflammatory bowel disease. Gastroenterology. 1991;100:3–12. doi: 10.1016/0016-5085(91)90575-6. [DOI] [PubMed] [Google Scholar]
- 6.Smythies LE, Sellers M, Clements RH, et al. Human intestinal macrophages display profound inflammatory anergy despite avid phagocytic and bacteriocidal activity. J Clin Invest. 2005;115:66–75. doi: 10.1172/JCI19229. [DOI] [PMC free article] [PubMed] [Google Scholar]
- 7.Macdonald TT, Monteleone G. Immunity, inflammation, and allergy in the gut. Science. 2005;307:1920–5. doi: 10.1126/science.1106442. [DOI] [PubMed] [Google Scholar]
- 8.Duchmann R, Kaiser I, Hermann E, et al. Tolerance exists towards resident intestinal flora but is broken in active inflammatory bowel disease (IBD) Clin Exp Immunol. 1995;102:448–55. doi: 10.1111/j.1365-2249.1995.tb03836.x. [DOI] [PMC free article] [PubMed] [Google Scholar]
- 9.Duchmann R, Neurath MF, Meyer zum Buschenfelde KH, et al. Responses to self and non-self intestinal microflora in health and inflammatory bowel disease. Res Immunol. 1997;148:589–94. doi: 10.1016/s0923-2494(98)80154-5. [DOI] [PubMed] [Google Scholar]
- 10.Linskens RK, Huijsdens XW, Savelkoul PH, et al. The bacterial flora in inflammatory bowel disease: current insights in pathogenesis and the influence of antibiotics and probiotics. Scand J Gastroenterol Suppl. 2001;234:29–40. doi: 10.1080/003655201753265082. [DOI] [PubMed] [Google Scholar]
- 11.Hilsden RJ, Meddings JB, Sutherland LR. Intestinal permeability changes in response to acetylsalicylic acid in relatives of patients with Crohn's disease. Gastroenterology. 1996;110:1395–403. doi: 10.1053/gast.1996.v110.pm8613043. [DOI] [PubMed] [Google Scholar]
- 12.Allez M, Mayer L. Regulatory T cells: peace keepers in the gut. Inflamm Bowel Dis. 2004;10:666–76. doi: 10.1097/00054725-200409000-00027. [DOI] [PubMed] [Google Scholar]
- 13.Burich A, Hershberg R, Waggie K, et al. Helicobacter-induced inflammatory bowel disease in IL-10- and T cell-deficient mice. Am J Physiol Gastrointest Liver Physiol. 2001;281:G764–78. doi: 10.1152/ajpgi.2001.281.3.G764. [DOI] [PubMed] [Google Scholar]
- 14.Cong Y, Brandwein SL, McCabe RP, et al. CD4+ T cells reactive to enteric bacterial antigens in spontaneously colitic C3H/HeJBir mice: increased T helper cell type 1 response and ability to transfer disease. J Exp Med. 1998;187:855–64. doi: 10.1084/jem.187.6.855. [DOI] [PMC free article] [PubMed] [Google Scholar]
- 15.Fuss IJ, Neurath M, Boirivant M, et al. Disparate CD4+ lamina propria (LP) lymphokine secretion profiles in inflammatory bowel disease. Crohn's disease LP cells manifest increased secretion of IFN-gamma, whereas ulcerative colitis LP cells manifest increased secretion of IL-5. J Immunol. 1996;157:1261–70. [PubMed] [Google Scholar]
- 16.Parronchi P, Romagnani P, Annunziato F, et al. Type 1 T-helper cell predominance and interleukin-12 expression in the gut of patients with Crohn's disease. Am J Pathol. 1997;150:823–32. [PMC free article] [PubMed] [Google Scholar]
- 17.Kanai T, Watanabe M, Okazawa A, et al. Macrophage-derived IL-18-mediated intestinal inflammation in the murine model of Crohn's disease. Gastroenterology. 2001;121:875–88. doi: 10.1053/gast.2001.28021. [DOI] [PubMed] [Google Scholar]
- 18.Cario E, Podolsky DK. Intestinal epithelial TOLLerance versus inTOLLerance of commensals. Mol Immunol. 2005;42:887–93. doi: 10.1016/j.molimm.2004.12.002. [DOI] [PubMed] [Google Scholar]
- 19.Medzhitov R. Toll-like receptors and innate immunity. Nat Rev Immunol. 2001;1:135–45. doi: 10.1038/35100529. [DOI] [PubMed] [Google Scholar]
- 20.Takeda K, Kaisho T, Akira S. Toll-like receptors. Annu Rev Immunol. 2003;21:335–76. doi: 10.1146/annurev.immunol.21.120601.141126. [DOI] [PubMed] [Google Scholar]
- 21.Takeuchi O, Hoshino K, Kawai T, et al. Differential roles of TLR2 and TLR4 in recognition of gram-negative and gram-positive bacterial cell wall components. Immunity. 1999;11:443–51. doi: 10.1016/s1074-7613(00)80119-3. [DOI] [PubMed] [Google Scholar]
- 22.Meylan E, Tschopp J. Toll-like receptors and RNA helicases: two parallel ways to trigger antiviral responses. Mol Cell. 2006;22:561–9. doi: 10.1016/j.molcel.2006.05.012. [DOI] [PubMed] [Google Scholar]
- 23.Poltorak A, He X, Smirnova I, et al. Defective LPS signaling in C3H/HeJ and C57BL/10ScCr mice: mutations in Tlr4 gene. Science. 1998;282:2085–8. doi: 10.1126/science.282.5396.2085. [DOI] [PubMed] [Google Scholar]
- 24.Gupta D, Wang Q, Vinson C, et al. Bacterial peptidoglycan induces CD14-dependent activation of transcription factors CREB/ATF and AP-1. J Biol Chem. 1999;274:14012–20. doi: 10.1074/jbc.274.20.14012. [DOI] [PubMed] [Google Scholar]
- 25.Yao J, Mackman N, Edgington TS, et al. Lipopolysaccharide induction of the tumour necrosis factor-α promoter in human monocytic cells. Regulation by Egr-1, c-Jun, and NF-κB transcription factors. J Biol Chem. 1997;272:17795–801. doi: 10.1074/jbc.272.28.17795. [DOI] [PubMed] [Google Scholar]
- 26.Cario E, Podolsky DK. Differential alteration in intestinal epithelial cell expression of toll-like receptor 3 (TLR3) and TLR4 in inflammatory bowel disease. Infect Immun. 2000;68:7010–17. doi: 10.1128/iai.68.12.7010-7017.2000. [DOI] [PMC free article] [PubMed] [Google Scholar]
- 27.Hausmann M, Kiessling S, Mestermann S, et al. Toll-like receptors 2 and 4 are up-regulated during intestinal inflammation. Gastroenterology. 2002;122:1987–2000. doi: 10.1053/gast.2002.33662. [DOI] [PubMed] [Google Scholar]
- 28.Pivarcsi A, Bodai L, Rethi B, et al. Expression and function of Toll-like receptors 2 and 4 in human keratinocytes. Int Immunol. 2003;15:721–30. doi: 10.1093/intimm/dxg068. [DOI] [PubMed] [Google Scholar]
- 29.Cario E, Gerken G, Podolsky DK. Toll-like receptor 2 enhances ZO-1-associated intestinal epithelial barrier integrity via protein kinase C. Gastroenterology. 2004;127:224–38. doi: 10.1053/j.gastro.2004.04.015. [DOI] [PubMed] [Google Scholar]
- 30.Rakoff-Nahoum S, Paglino J, Eslami-Varzaneh F, et al. Recognition of commensal microflora by Toll-like receptors is required for intestinal homeostasis. Cell. 2004;118:229–41. doi: 10.1016/j.cell.2004.07.002. [DOI] [PubMed] [Google Scholar]
- 31.Elson CO, Sartor RB, Tennyson GS, Riddell RH. Experimental models of inflammatory bowel disease. Gastroenterology. 1995;109:1344–67. doi: 10.1016/0016-5085(95)90599-5. [DOI] [PubMed] [Google Scholar]
- 32.Bousvaros A, Sylvester F, Kugathasan S, et al. Challenges in pediatric inflammatory bowel disease. Inflamm Bowel Dis. 2006;12:885–913. doi: 10.1097/01.mib.0000228358.25364.8b. [DOI] [PubMed] [Google Scholar]
- 33.Mamula P, Markowitz JE, Baldassano RN. Inflammatory bowel disease in early childhood and adolescence: special considerations. Gastroenterol Clin North Am. 2003;32:967–95. doi: 10.1016/s0889-8553(03)00046-3. [DOI] [PubMed] [Google Scholar]
- 34.Hart AL, Al-Hassi HO, Rigby RJ, et al. Characteristics of intestinal dendritic cells in inflammatory bowel diseases. Gastroenterology. 2005;129:50–65. doi: 10.1053/j.gastro.2005.05.013. [DOI] [PubMed] [Google Scholar]
- 35.Zarember KA, Godowski PJ. Tissue expression of human Toll-like receptors and differential regulation of Toll-like receptor mRNAs in leukocytes in response to microbes, their products, and cytokines. J Immunol. 2002;168:554–61. doi: 10.4049/jimmunol.168.2.554. [DOI] [PubMed] [Google Scholar]
- 36.Abreu MT, Arnold ET, Thomas LS, et al. TLR4 and MD-2 expression is regulated by immune-mediated signals in human intestinal epithelial cells. J Biol Chem. 2002;277:20431–7. doi: 10.1074/jbc.M110333200. [DOI] [PubMed] [Google Scholar]
- 37.Suzuki M, Hisamatsu T, Podolsky DK. Gamma interferon augments the intracellular pathway for lipopolysaccharide (LPS) recognition in human intestinal epithelial cells through coordinated up-regulation of LPS uptake and expression of the intracellular Toll-like receptor 4-MD-2 complex. Infect Immun. 2003;71:3503–11. doi: 10.1128/IAI.71.6.3503-3511.2003. [DOI] [PMC free article] [PubMed] [Google Scholar]
- 38.Wolfs TG, Buurman WA, van Schadewijk A, et al. In vivo expression of Toll-like receptor 2 and 4 by renal epithelial cells: IFN-gamma and TNF-alpha mediated up-regulation during inflammation. J Immunol. 2002;168:1286–93. doi: 10.4049/jimmunol.168.3.1286. [DOI] [PubMed] [Google Scholar]
- 39.Rugtveit J, Brandtzaeg P, Halstensen TS, et al. Increased macrophage subset in inflammatory bowel disease: apparent recruitment from peripheral blood monocytes. Gut. 1994;35:669–74. doi: 10.1136/gut.35.5.669. [DOI] [PMC free article] [PubMed] [Google Scholar]
- 40.van Hal PT, Wijkhuijs JM, Mulder PG, et al. Proliferation of mature and immature subpopulations of bronchoalveolar monocytes/macrophages and peripheral blood monocytes. Cell Prolif. 1995;28:533–43. doi: 10.1111/j.1365-2184.1995.tb00042.x. [DOI] [PubMed] [Google Scholar]
- 41.Canto E, Ricart E, Monfort D, et al. TNF alpha production to TLR2 ligands in active IBD patients. Clin Immunol. 2006;119:156–65. doi: 10.1016/j.clim.2005.12.005. [DOI] [PubMed] [Google Scholar]
- 42.Polese L, Angriman I, Cecchetto A, et al. The role of CD40 in ulcerative colitis: histochemical analysis and clinical correlation. Eur J Gastroenterol Hepatol. 2002;14:237–41. doi: 10.1097/00042737-200203000-00006. [DOI] [PubMed] [Google Scholar]
- 43.Battaglia E, Biancone L, Resegotti A, et al. Expression of CD40 and its ligand, CD40L, in intestinal lesions of Crohn's disease. Am J Gastroenterol. 1999;94:3279–84. doi: 10.1111/j.1572-0241.1999.01538.x. [DOI] [PubMed] [Google Scholar]
- 44.Caux C, Massacrier C, Vanbervliet B, et al. Activation of human dendritic cells through CD40 cross-linking. J Exp Med. 1994;180:1263–72. doi: 10.1084/jem.180.4.1263. [DOI] [PMC free article] [PubMed] [Google Scholar]
- 45.McDyer JF, Dybul M, Goletz TJ, et al. Differential effects of CD40 ligand/trimer stimulation on the ability of dendritic cells to replicate and transmit HIV infection: evidence for CC-chemokine-dependent and -independent mechanisms. J Immunol. 1999;162:3711–17. [PubMed] [Google Scholar]
- 46.Atreya R, Mudter J, Finotto S, et al. Blockade of interleukin 6 trans signaling suppresses T-cell resistance against apoptosis in chronic intestinal inflammation: evidence in Crohn disease and experimental colitis in vivo. Nat Med. 2000;6:583–8. doi: 10.1038/75068. [DOI] [PubMed] [Google Scholar]
- 47.Van Deventer SJ. Tumour necrosis factor and Crohn's disease. Gut. 1997;40:443–8. doi: 10.1136/gut.40.4.443. [DOI] [PMC free article] [PubMed] [Google Scholar]
- 48.Insoft RM, Sanderson IR, Walker WA. Development of immune function in the intestine and its role in neonatal diseases. Pediatr Clin North Am. 1996;43:551–71. doi: 10.1016/s0031-3955(05)70420-x. [DOI] [PubMed] [Google Scholar]
- 49.Hyams JS, Ferry GD, Mandel FS, et al. Development and validation of a paediatric CD activity index. J Ped Gastroenterol Nutr. 1999;12:439–447. [PubMed] [Google Scholar]
- 50.Turner D, Otley AR, Mack D, et al. Development, validation, and evaluation of a paediatric ulcerative colitis activity index: a prospective multicentre study. Gastroenterology. 2007;133:423–32. doi: 10.1053/j.gastro.2007.05.029. [DOI] [PubMed] [Google Scholar]