

Abstract
Regulatory T cells seem to play a central role in maintaining immune tolerance in the gut mucosa. Previously we have shown that interleukin (IL)-10 is produced at high levels in the inflamed colonic tissue of ulcerative colitis (UC) patients. The cellular source was CD4+ T cells, suggesting local activation of regulatory T cells. The present study was performed to determine whether the frequency of regulatory T cells is increased in UC colon and whether they are present in the basal lymphoid aggregates, the prominent microanatomical structure in UC colon. Colonic tissue specimens from UC and control patients were analysed for frequencies of lamina propria lymphocytes expressing the regulatory T cell markers forkhead box protein 3 (FoxP3), CD25 and glucocorticoid-induced tumour necrosis factor receptor family-related gene (GITR) as well as CD28, CD4 and CD3 by using marker specific reagents in immunomorphometry. Two-colour immunohistochemistry was used for detection of CD25/IL-10, FoxP3/IL-10 and CD25/FoxP3 double-positive cells. GITR+ and FoxP3+ cells were present in normal colon mucosa, although at a relatively low frequency, and were located preferentially within the solitary follicles. UC was associated with significantly increased frequencies of CD25+, GITR+ and FoxP3+ lamina propria lymphocytes both within the basal lymphoid aggregates and in the lamina propria outside. Many of the CD25+ cells co-expressed FoxP3 as well as IL-10, suggesting that these are indeed IL-10 secreting regulatory T cells, activated in an attempt to counteract the inflammation. Increased frequency of regulatory T cell subtypes seems insufficient to control the disease activity in UC.
Keywords: basal lymphoid aggregates, FoxP3, GITR, interleukin-10, intestinal regulatory T lymphocytes
Introduction
Ulcerative colitis (UC) is a chronic inflammatory disease localized to the intestinal mucosa and restricted to the large intestine. The aetiology of UC is still unknown. The frequency of immune cells is increased markedly in the colonic mucosa of UC patients, manifested commonly as prominent lymphoid aggregates located at the border of the submucosa, so-called basal lymphoid aggregates (Aggrs) [1]. Aggrs occupy an increasing proportion of the lamina propria with severity of disease [1]. Experimental studies on inflammatory bowel disease (IBD) using genetically manipulated mice indicate strongly that T lymphocyte-mediated immune mechanisms play an essential role in the colitis [2]. That T lymphocytes also play an important role in UC is suggested by the following findings: (i) autoantibodies directed against colon antigens are present in serum and colonic mucosa of UC patients [3,4]; (ii) the cytokine production by colonic T cells is altered in patients with UC showing a decrease in interleukin (IL)-2 and a marked increase in IL-10 that correlates with disease activity [5,6]; (iii) the response of lamina propria lymphocytes from UC colon to polyclonal T cell activation in vitro is skewed with production of IL-5 and IL-13 [7]; and (iv) immunosuppressive drugs are effective in the treatment of UC [8].
The immune tolerance of the gut mucosa is thought to be maintained by regulatory T cells (Tregs) [9–11]. Moreover, a role for Tregs in the control of intestinal inflammation was suggested by the finding that they could resolve established colitis in murine IBD models [12,13]. Different subsets of CD4+ and CD8+ T cells have been shown to act as regulatory cells. Three types of CD4+ regulatory cells are currently recognized; T helper type 3 (Th3) cells secreting transforming growth factor-β (TGF-β), Tr1 cells secreting interleukin-10 (IL-10) and Treg cells, i.e. CD4+ CD25bright cells expressing the transcription factor forkhead box protein 3 (FoxP3). Tregs act presumably through cell–cell contact, although some studies suggest that they can act by producing suppressive cytokines, e.g. IL-10 and TGF-β, or by consuming necessary growth factors such as IL-2 [14]. Tregs apparently prevent development of autoimmune diseases by controlling self-reactive T cells, and humans and mice lacking FoxP3 develop a devastating lymphoproliferative autoimmune syndrome [14,15]. Tregs were reported to inhibit a wide range of inflammatory conditions, including IBD [16]. CD25, the α-chain of the IL-2 receptor, is expressed at high levels on the cell surface of CD4+ T cells with down-regulatory functions. This is consistent with the central role for IL-2 in generation of Tregs[17]. Glucocorticoid-induced tumour necrosis factor receptor family-related gene (GITR) is a member of the TNF receptor family, and also considered a marker for regulatory T cells [18]. GITR is expressed preferentially on CD4+ CD25+ T cells and plays a role in the peripheral tolerance mediated by these cells. However, it also acts as a co-stimulatory molecule for various T cell subsets [18].
Production of IL-10 was found to be high while IL-2 production was low in the colonic mucosa of UC patients. The cellular source of IL-10 production was shown to be CD4+ T cells [5]. Interestingly, CD4+ CD25bright cells isolated from human colonic mucosa were increased significantly in frequency in IBD [19,20]. Taken together, these findings suggest strongly that regulatory T cells are activated in the colonic mucosa of UC patients.
This study was undertaken for two reasons: first to relate the presence of T cells with regulatory properties to the two major microanatomical sites in lamina propria of UC colon in comparison with normal colon, and secondly to investigate whether Tregs constitute the cellular source of the IL-10 produced in UC colon [5]. Quantitative immunomorphometric analysis was performed using the point-counting method of Weibel to enumerate the proportion of marker positive cells. Three markers for cells with regulatory properties were studied, namely FoxP3, CD25 and GITR.
Materials and methods
Patients and tissue specimens
Colonic tissue specimens of UC patients were obtained from patients undergoing bowel resection: 12 males and four females aged 21–62 years (median age 40 years). Eleven of these patients did not receive anti-inflammatory drugs, two received corticosteroid and immune modulating treatment and three received only corticosteroid treatment within the last 4 weeks prior to operation. Six of the patients showed low disease activity, six moderate disease activity and four active disease at the time of operation. Control samples were obtained from patients undergoing bowel resection for colon cancer; 10 males and five females aged 46–90 years (median age 70 years). The specimens were taken distant to any macroscopically detectable lesions. All patients received a single intravenous dose of antibiotics 2 h before surgery, according to preoperative standard procedure. None of the control patients were subjected to radiotherapy, chemotherapy, long-standing antibiotic medication or corticosteroid treatment. All specimens were from the sigmoid colon.
Antibodies and substrates
The primary monoclonal antibodies (mAbs) used were: anti-CD45 (a mixture of clones 2B11 and PD7/26), anti-CD3 (clone UCHT1), anti-CD4 (clone MT310), anti-CD25 (clone M0731) [all mouse immunoglobulin 1 (IgG1); Dakopatts, Glostrup, Denmark], anti-CD28 (clone CD28·2, mouse IgG1; Immunotech, Marseille, France), anti-FoxP3 (clone 236A/E7, mouse IgG1, Abcam, Cambridge, MA, USA) and anti-IL-10 (clone 12G8, rat IgG2a; Mabtech, Nacka, Sweden). Polyclonal antibodies used were: anti-CD3 (A0452, rabbit IgG, Dakopatts) and anti-GITR (sc-5759, goat IgG; Santa Cruz Biotechnology, Santa Cruz, CA, USA). Negative control antibodies used were: mouse IgG1 (clone DAK-G01, IgG1), normal goat and rat IgG (all from Dakopatts). Secondary antibodies used were: biotinylated sheep anti-mouse Ig, biotinylated rabbit anti-goat IgG, biotinylated rabbit anti-rat IgG (all from Jackson ImmunoResearch, Cambridgeshire, UK) and biotinylated goat anti-rabbit IgG (Dakopatts). Avidin–biotin complex (ABC) reagents kit and anti-mouse Ig Impress reagents kit were from Vector Laboratories (Burlingame, CA, USA). Enzyme substrates used were: 3′-amino-9-ethylcarbazol (AEC; Sigma, Stockholm, Sweden), 3-3′-diaminobenzidine tetrahydrochloride (DAB; Sigma) and nitro-blue tetrazolium chloride/5-bromo-4-chloro-3-indolyl phosphate (NBT/BCIP; Roche Molecular Biochemicals, Mannheim, Germany).
Immunohistochemistry
Fresh tissue samples were rinsed with cold phosphate-buffered saline (PBS), snap-frozen in isopentane precooled in liquid nitrogen and stored at −80°C. Frozen tissue was cut into 4–6 μm thick sections. One-colour staining was performed using the ABC enhancement technique for all markers except for FoxP3 staining, which was performed using Impress anti-mouse Ig enhancement technique. Briefly, the sections were fixed in acetone at −20°C for 5 min, air-dried, rehydrated in PBS and blocked for endogenous biotin using the avidin–biotin blocking kit. Thereafter, the sections were immersed in PBS containing 0·03% H202 and 2 mM NaN3 at 37°C for 45 min to abolish endogenous peroxidase activity and incubated subsequently with 0·2% bovine serum albumin in PBS at room temperature to block non-specific binding sites. The sections were incubated thereafter with primary antibodies for 1 h at room temperature followed by 1 h incubation with biotinylated sheep anti-mouse Ig for primary mouse mAbs and biotinylated rabbit anti-goat Ig or biotinylated goat anti-rabbit Ig for primary polyclonal antibodies. Finally, the sections were incubated with peroxidase conjugated ABC reagent for 30 min at room temperature; the bound peroxidase was revealed by incubation with 0·05% DAB and 0·03% H202 in 0·05 M Tris buffer (pH 7·6) at room temperature and counterstained with methyl green. Regarding FoxP3 staining, the primary antibody was applied for 1 h followed by incubation with peroxidase conjugated Impress anti-mouse Ig for 30 min. Impress peroxidase activity was revealed subsequently and counterstained as described above. Negative and positive control sections were included in all experiments. The primary antibodies were replaced by concentration and isotype-matched antibodies in negative controls. Sections stained with anti-CD45 mAb and rabbit anti-CD3 constituted positive controls for mAbs and polyclonal antibodies, respectively.
Two protocols were used for double staining. Double staining for IL-10 and the markers CD25 and FoxP3 was performed as described previously with minor modifications [5]. Sections were fixed with 2% paraformaldehyde, incubates with 0·03% H202 and 2 mM NaN3 at 37°C, and incubated subsequently at room temperature with 0·02 M PBS containing 20% horse serum and 0·1% saponin to block non-specific binding sites and enhance the possibility of the reagents to penetrate into the tissue. Sections were then incubated with mixtures of anti-CD25 and anti-IL-10 or anti-FoxP3 and anti-IL-10 mAbs followed by incubations with peroxidase conjugated Impress anti-mouse Ig and biotinylated rabbit anti-rat Ig and avidin–alkaline phosphatase conjugate. Impress peroxidase activity was revealed using AEC as substrate for anti-CD25 staining and DAB for anti-FoxP3 staining. NBT/BCIP was used as substrate to reveal alkaline phosphatase activity for anti-IL-10 staining. Double staining for CD25 and FoxP3 was performed on acetone-fixed frozen tissue sections. Fixed sections were incubated with anti-CD25 mAb followed by anti-mouse Ig Impress peroxidase conjugate and developed using AEC substrate. Subsequently, the sections were incubated with anti-FoxP3 mAb, followed by anti-mouse Impress peroxidase conjugate and developed using DAB substrate. Negative controls were as described above.
Morphometry analysis
Quantification of frequencies of lamina propria cells stained for different markers by immunohistochemistry was performed according to Weibel analysing cells within lymphoid aggregates/solitary follicles and cells outside lymphoid aggregates/solitary follicles separately [21]. One observer (B. S.) performed the analyses and the slides were coded to avoid examiner bias. An integrating, cooled colour 3CCD camera (Colour Chilled 3 CCD Hamamatsu Camera C5810; Hamamatsu Photonics, Hamamatsu City, Japan) was used on a standard light microscope combined with a computer image analysis system (LeicaQWin, Leica Imaging Systems, Cambridge, UK) with an interactive, computerized morphometry program developed at the department [22]. Briefly, microscopic fields were selected randomly using 40 × objective and transferred to the screen, onto which a regular 121-points lattice was superimposed. Points outside the concerned tissue compartment and empty spaces were erased. Positive cells located in the coarse points were counted and the ratio between the number of points covering positive cells and the total number of points covering the tissue under investigation was calculated for each microscopic field. An average of 15 randomly chosen ocular fields was calculated for each marker. Aggregates and follicles commonly occupied an area less than that corresponding to 15 microscopic fields, in which case the entire area occupied by aggregates/follicles was counted.
Statistical analysis
The statistical significance of differences in frequencies of cells expressing different markers in UC compared to control samples, as well as between aggregates/follicles compared to lamina propria outside these structures in the same samples, was evaluated using the two-tailed Mann–Whitney rank sum test. Descriptive values are expressed as mean ± standard error of the mean. For correlation between frequencies of cells expressing different markers, a two-tailed Spearman's rank correlation test was used. P-values below 0·05 were considered statistically significant.
Ethical considerations
Analyses were performed on tissue specimens that were removed surgically for therapeutic reasons. The local committee on human ethics at Umeå University approved this investigation (Dnr 03-477), and the patients gave their informed consent.
Results
Two microanatomical structures can be distinguished in lamina propria of normal colon: solitary follicles and the area outside the follicles. In UC the follicle area is expanded forming so-called Aggrs, which can occupy up to 45% (mean 21%) of the lamina propria [1]. Using quantitative immunomorphometric analysis we compared the immune cell composition of these microanatomical sites focusing on T cells with markers of regulatory functions. The frequency of regulatory T cells was determined by antibodies to FoxP3, CD25 and GITR and total immune cells by anti-CD45, total T cells by anti-CD3, T helper cells by anti-CD4 and T cells expressing the co-stimulatory activation marker CD28 by anti-CD28.
Normal colonic mucosa harbours a small population of regulatory T cells located preferentially in the follicles
Figure 1 shows the result of the quantitative morphometric analysis of six to nine normal colon samples; 28 ± 2·5% of the total number of cells in normal colon follicles were CD4+, in agreement with previous studies [1]. Tregs, as defined by the two more specific markers FoxP3 and GITR, were present in the follicles but constituted only 1–2% of the cells. Four per cent of the cells were CD25+, allowing for the presence of FoxP3+ CD25+ and GITR+ CD25+cells. A two-colour staining experiment confirmed the presence of FoxP3+ CD25+ cells (data not shown). Only 1% of the cells expressed the co-stimulatory activation marker CD28.
Fig. 1.
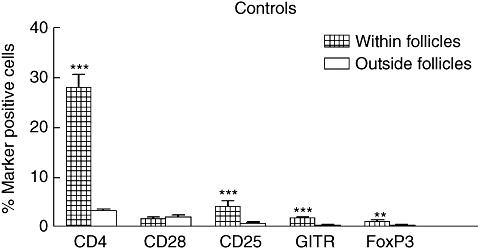
Frequencies of T cell subtypes within (hatched bars; n = 6–7) and in lamina propria outside solitary follicles (open bars; n = 7–9) of control colon, as determined by immunomorphometry analysis. Sections of frozen tissue were stained with antibodies specific for CD4, CD28, CD25, glucocorticoid-induced tumour necrosis factor receptor family-related gene and forkhead box protein 3 by using avidin–biotin complex immunoperoxidase or impress enhancement technique. Bars represent mean plus 1 standard error of the mean. (***) = P-value < 0·001 and (**) = P-value < 0·01 when comparing frequencies of cells expressing indicated marker within and outside follicles.
In lamina propria outside the follicles, immune cells constituted only 13·0 ± 1·1% of the total number of cells and 3·3 ± 0·4% were CD4+. Very few Tregs were present outside the follicles (< 0·5%) and only 1% of the cells were CD25+ (Fig. 1). As can be seen in Fig. 1, all marker-positive cells except CD28+ cells were significantly more frequent in the follicles than in lamina propria outside the follicles.
The fraction of the CD4+ cells that were FoxP3 and/or GITR positive is approximately the same in the follicles as outside the follicles, i.e. 4–10% (Table 1). However, there were no correlations between the frequencies of CD4+, CD25+, GITR+ or FoxP3+ cells in the follicles (Table 2). There is an interesting difference with respect to the CD28 marker between follicles and the area outside the follicles. Thus, in the follicles CD28+ cells constitute only a small fraction of the CD4+ cells, while 50% of the CD4+ cells in lamina propria outside the follicles are CD28+.
Table 1.
Frequencies of T cell subtypes in different microanatomical sites of ulcerative colitis (UC) and control colonic mucosa.
| Marker expressed on CD4+ T cells | Location | Controls (%) | UC patients (%) | P-value |
|---|---|---|---|---|
| CD25 | F/AG† | 15 ± 3* | 32 ± 2 | 0·001 |
| GITR | F/AG | 7 ± 2 | 15 ± 2 | 0·03 |
| FoxP3 | F/AG | 4 ± 2 | 15 ± 1 | 0·004 |
| CD28 | F/AG | 7 ± 2 | 19 ± 3 | 0·01 |
| CD25 | LP outside F/AG | 26 ± 3 | 59 ± 7 | 0·001 |
| GITR | LP outside F/AG | 7 ± 2 | 42 ± 4 | 0·0006 |
| FoxP3 | LP outside F/AG | 10 ± 3 | 26 ± 3 | 0·004 |
| CD28 | LP outside F/AG | 50 ± 13 | 59 ± 10 | > 0·1 |
Calculated as percentage marker positive cells of CD4+ cells in the same sample. Results are given as mean ± standard error of the mean. Number of samples analysed seven for UC patients and seven or eight for controls.
F, follicles; AG, basal lymphoid aggregates; LP, lamina propria. GITR: glucocorticoid-induced tumour necrosis factor receptor family-related gene; FoxP3: forkhead box protein 3.
Table 2.
Correlation between frequencies of different T cell subtypes in ulcerative colitis (UC) and normal colonic mucosa.
| Control colon | UC colon | |||||
|---|---|---|---|---|---|---|
| Follicles | Aggregates | LP outside aggregates | ||||
| Markers compared | r | P-value | r | P-value | r | P-value |
| CD25 versus GITR | 0·4 | > 0·1 | 0·86 | 0·02 | 0·88 | 0·007 |
| CD4 versus CD25 | 0·07 | > 0·1 | 0·79 | 0·04 | 0·2 | > 0·1 |
| CD4 versus GITR | −0·7 | > 0·1 | 0·79 | 0·04 | 0·3 | > 0·1 |
| CD4 versus FoxP3 | 0·3 | > 0·1 | 1·0 | 0·02 | 0·01 | > 0·1 |
r = Correlation coefficient obtained when performing pairwise comparisons between frequencies of cells with the indicated markers within follicles, aggregates and lamina propria (LP) outside aggregates in immunohistochemically stained sections of UC colon (n = 8) or control colon (n = 7). GITR: glucocorticoid-induced tumour necrosis factor receptor family-related gene; FoxP3: forkhead box protein 3.
Increased frequency of Tregs in both microanatomical compartments of lamina propria of UC colon
Next we determined the frequency of marker positive cells in Aggrs and in the area outside the Aggrs of UC colon and compared the results with those obtained for the corresponding compartments of normal colon. The results are shown in Fig. 2. Comparing, first, Aggrs with normal follicles (Fig. 2a) it can be seen that, while the frequency of CD4+ cells is the same in the two structures, the frequencies of FoxP3+, GITR+ and CD25+ cells are clearly increased, reaching 3–8% of the cells in the Aggrs. The increase is statistically significant for all three markers. It can also be seen that the frequency of CD28+ CD4+ cells is increased (Fig. 2a, Table 1 and analysis of consecutive sections).
Fig. 2.
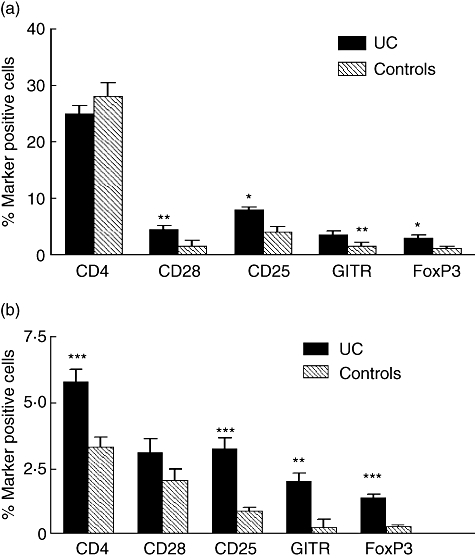
(a) Frequencies of T cell subtypes within aggregates of ulcerative colitis (UC) colon (dark grey bars) and within solitary follicles of control colon (hatched bars), as determined by immunomorphometry. (b) Frequencies of T cell subtypes in lamina propria outside aggregates of UC colon (dark grey bars) and lamina propria outside follicles of control colon (hatched bars). Technique as described in Fig. 1. Bars represent mean plus 1 standard error of the mean (n = 7). ***P-value < 0·001, **P-value < 0·01 and *P-value < 0·05 when comparing frequencies of cells expressing indicated marker in UC and control colon.
When the area outside the Aggrs and follicles, respectively, was analysed (Fig. 2b) we found that the frequency of CD4+ cells was increased in UC from 3% to 5·5%. This increase was mirrored by a statistically highly significant increase in Tregs now constituting 1·3–3% of the cells outside the Aggrs. In contrast, the pool of CD4+ CD28+ cells was not expanded. The density of immune cells was also increased compared to that of normal colon (26 ± 1·5% CD45+ cells and 7·6 ± 0·7% CD3+ cells in UC colon compared to 13 ± 0·1% CD45+ cells and 3·3 ± 0·4% CD3+ cells for normal colon, respectively; P-values 0·0002 and 0·002, respectively). The increase in non-T cells is due partly to a highly significant expansion of the plasma cell pool [23].
The finding that CD25+ cells always occurred at a higher frequency than FoxP3+ and GITR+ cells is expected, as immunhistochemistry does not allow a clear distinction between bright and dull CD25+ cells. Only the CD4+ CD25bright cells are considered to be Tregs. Staining with anti-CD4, anti-CD25 and anti-GITR on sequential sections suggested that most, if not all, CD25- and GITR-expressing cells belong to the CD4+ cells as exemplified in Fig. 3. Two-colour staining with anti-CD25 and anti-FoxP3 revealed double-positive cells (Fig. 4d).
Fig. 3.
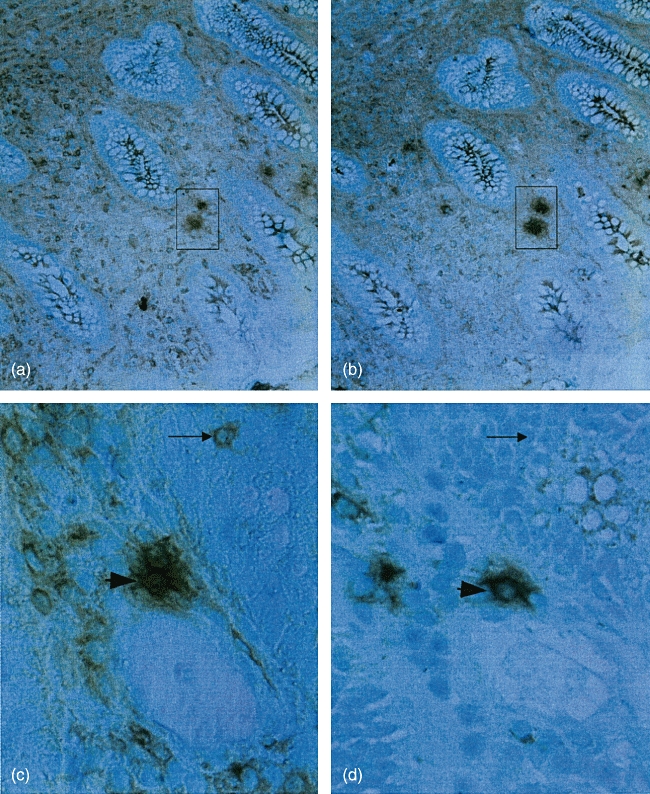
Immunoperoxidase staining of sequential sections with anti-CD4 (a) and anti-CD25 (b) and anti-CD4 (c) and anti-glucocorticoid-induced tumour necrosis factor receptor family-related gene (d). The same cells in consecutive section are boxed or indicated by an arrowhead, respectively. Arrow shows a single positive cell. Technique as described in Fig. 1. Original magnification in micrographs: ×32 (a, b) and ×200 (c, d).
Fig. 4.
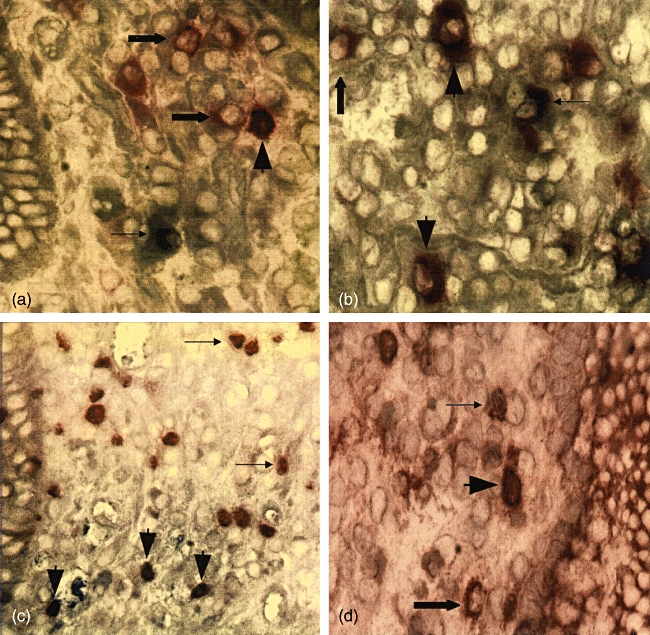
(a, b) Colonic tissue of an ulcerative colitis (UC) patient stained with anti-CD25 (red) and anti-interleukin (IL)-10 (blue). An area in lamina propria outside lymphoid aggregates is displayed in (a). (b) displays an area within a lymphoid aggregate. Fat arrowheads indicate cells double-stained for CD25 and IL-10, fat arrows indicate CD25 single positive cells and thin arrows indicate IL-10 single positive cells. (c) Lamina propria outside lymphoid aggregates in colonic tissue of an UC patient stained with anti-forkhead box protein 3 (FoxP3) (brown) and IL-10 (blue). Fat arrowheads indicate cells double-stained for FoxP3 and IL-10, and thin arrows indicate FoxP3 single positive cells. (d) Lamina propria outside lymphoid aggregates in colonic tissue of an UC patient stained with anti-CD25 (red) and anti-FoxP3 (brown). Fat arrowheads indicate cells double-stained for CD25 and FoxP3, the fat arrow indicates a CD25 single positive cell and the thin arrow indicates a FoxP3 single positive cell. Original magnification in micrographs: ×200.
Table 1 and Fig. 2a and b show that there is, indeed, an altered subtype composition of the CD4+ cells both in Aggrs compared with follicles and in lamina propria outside Aggrs/follicles in colon of UC patients relative to normal colon with an increased proportion of CD25+, GITR+ and FoxP3+ CD4+ T cells. Taken together, these results suggest a marked expansion of regulatory T cells in UC colon both outside and within aggregates.
The numerical values of the frequencies of CD4+ cells, CD25+ cells, GITR+ cells and FoxP3+ cells in UC colon were sufficiently high to allow pairwise correlation analyses between marker positive cells (Table 2). In Aggrs there was an excellent correlation between CD4+ cells, CD25+ cells and GITR+ cells. Moreover, CD4+ cells correlated with FoxP3+ cells. This result is in line with the finding that there is a selective increase in Tregs in Aggrs. Outside Aggrs only CD25+ cells correlated with GITR+ cells, while cells with these markers did not correlate with CD4+ cells, possibly indicating that non-Treg CD4+ cells are also expanded. Unfortunately, analysis of FoxP3-expressing cells was performed on partly different samples than were analysed for CD25 and GITR. The number of samples allowing pairwise correlation analysis between these two markers and FoxP3 became too small for meaningful statistical evaluation. Analysis by double staining and of consecutive sections of UC colon showed, however, that many cells expressed both FoxP3 and CD25 (Fig. 4d and data not shown).
IL-10 expressing T cells
Two-colour immunohistochemistry experiments revealed the presence of cells stained for both IL-10 and CD25 (Fig. 4a and b) or IL-10 and FoxP3 (Fig. 4c) in UC colon. The double-positive cells were situated both outside and within the Aggrs, as exemplified in Fig. 4a and b.
Discussion
Regulatory T cells as detected by the three markers FoxP3, CD25 and GITR were found at a low frequency of 1–2%, in solitary follicles of normal colon and hardly at all in the area outside the follicles. This compares favourably with the recent study by Sather and co-workers, who reported that Tregs are present in most non-lymphoid tissues of mice and that the frequency of FoxP3+ cells in intestinal lamina propria is 5·6% of the CD4+ cells [24]. No significant correlation between CD25-, GITR- or CD4-expressing cells was seen in normal colon, suggesting that the CD25-expressing cells are normally a heterogeneous mixture of activated Th cells and regulatory T cells. In contrast, in UC colon regulatory T cells were found to be significantly more common than in normal colon, reaching a frequency of 3–8% of the cells in the Aggrs. Considering the fact that Aggrs occupy a large area of the lamina propria in UC colon (on average 21% compared to < 5% of the area occupied by follicles in normal colon [1]) the total increase becomes at least five times greater. Also, in the area outside the Aggrs there was a highly significant increase in Tregs, constituting 1–3% of the total number of cells. Taking into account the areas occupied by Aggrs and follicles, respectively, in UC colon and normal colon and the frequency of the different cell types inside and outside Aggrs/follicles, we found a 2·3-fold increase in total CD4+ cells while FoxP3+, GITR+ and CD25+ cells were each increased 4·6–5·3 times comparing UC colon to normal colon. Thus there is a preferential accumulation of regulatory T cells in lamina propria of UC colon. This finding is in line with the results of other authors using immunoflow cytometry of isolated total lamina propria lymphocytes [19,20]. A new finding in this study is that the basal lymphoid aggregates are the main site for Tregs and it is in these unique structures that they supposedly exert their effects. Here the Tregs are concentrated in the T cell areas, where they are in close contact with other T cells and dendritic cells.
In the genetic absence of CD28, low numbers of CD4+ CD25+ regulatory T cells are generated [25]. The frequency of CD28+ cells was increased in the Aggrs, thus one prerequisite for local expansion of Tregs is fulfilled. Intriguingly, an inverse correlation has been reported between frequency of regulatory T cells in blood and disease activity in UC [26].
Do the three regulatory T cell markers detect the same cells? Analysis of consecutive sections, marker correlation analysis and double-staining experiments indicate that this is, to a large extent, the case in UC colon. However, as noted earlier by several authors, CD25+ cells, which always were more frequent than FoxP3+ and GITR+ cells, include non-Treg cells [9,12]. Conversely, FoxP3 expression was reported to be restricted to CD4+ lymphocytes, the majority of which express CD25 with only a minor population being CD4+ CD25– cells [27]. Recently, CD4+ CD25+ expressing FoxP3 exhibiting suppressive functions were also found to be expanded in the mesenteric lymph nodes of UC patients [28]. Expression of GITR is restricted mainly to regulatory T cells. However, signalling through GITR causes reactions with contradictory effects. On one hand, it triggers proliferation and thereby expansion of CD4+ CD25+ regulatory T cells [18]. On the other hand, regulatory T cells stimulated through GITR may lose their suppressive function [29]. As yet we do not know whether GITR ligand is present in the colonic mucosa.
In this study we found that FoxP3 was expressed not only in IL-10– cells, but also in IL-10+ cells. The latter finding is somewhat unexpected, aas it was demonstrated recently that Tregs in mesenteric lymph nodes of UC patients act through cell–cell contact and not by soluble factors [28]. The local conditions in the mucosa compared to the lymph node may have different effects on regulatory T cell function. The CD25+ IL10+ cells observed indicate that Tr1 cells are also present in the diseased mucosa of UC patients. It is noteworthy that CD4+ CD25+ cells have been demonstrated to prevent colitis induction in mouse models in an IL-10-dependent manner [10].
Notably, CD4+ CD25+ cells isolated either from colonic mucosa, regional lymph nodes or peripheral blood of IBD patients can be stimulated to suppressive function in vitro[13,19,28]. In view of this, and the finding that Tregs are increased in number and produce IL-10 in UC colon, it is intriguing that they cannot resolve the inflammation. The undulating nature of the disease activity could be a reflection of an ongoing ‘struggle’ between pro- and anti-inflammatory responses in which the Tregs, for still unknown reasons, lose the advantage.
Acknowledgments
This study was supported financially by grants from the Swedish Research Council, Medicine; the Swedish Research Council, Natural Sciences and Engineering Sciences; the Ihre's Fund, the Medical Faculty at Umeå University; and the County of Västerbotten. We thank Dr Åke Öberg and colleagues for the surgical samples and Ms Marianne Sjöstedt for skilful technical assistance.
References
- 1.Yeung MM, Melgar S, Baranov V, et al. Characterisation of mucosal lymphoid aggregates in ulcerative colitis: immune cell phenotype and TcR-gammadelta expression. Gut. 2000;47:215–27. doi: 10.1136/gut.47.2.215. [DOI] [PMC free article] [PubMed] [Google Scholar]
- 2.Boismenu R, Chen Y. Insights from mouse models of colitis. J Leukoc Biol. 2000;67:267–78. doi: 10.1002/jlb.67.3.267. [DOI] [PubMed] [Google Scholar]
- 3.Fiocchi C. Inflammatory bowel disease: etiology and pathogenesis. Gastroenterology. 1998;115:182–205. doi: 10.1016/s0016-5085(98)70381-6. [DOI] [PubMed] [Google Scholar]
- 4.Halstensen TS, Mollnes TE, Garred P, Fausa P, Brandtzaeg P. Epithelial deposition of immunoglobulin G1 and activated complement (C3b and terminal complement complex) in ulcerative colitis. Gastroenterology. 1990;98:1264–71. doi: 10.1016/0016-5085(90)90343-y. [DOI] [PubMed] [Google Scholar]
- 5.Melgar S, Yeung MM, Bas A, et al. Over-expression of interleukin 10 in mucosal T cells of patients with active ulcerative colitis. Clin Exp Immunol. 2003;134:127–37. doi: 10.1046/j.1365-2249.2003.02268.x. [DOI] [PMC free article] [PubMed] [Google Scholar]
- 6.Holtmann MH, Galle PR. Current concept of pathophysiological understanding and natural course of ulcerative colitis. Langenbecks Arch Surg. 2004;389:341–9. doi: 10.1007/s00423-003-0448-5. [DOI] [PubMed] [Google Scholar]
- 7.Fuss IJ, Heller F, Boirivant M, et al. Nonclassical CD1d-restricted NK T cells that produce IL-13 characterize an atypical Th2 response in ulcerative colitis. J Clin Invest. 2004;113:1490–7. doi: 10.1172/JCI19836. [DOI] [PMC free article] [PubMed] [Google Scholar]
- 8.Nguyen GC, Harris ML, Dassopoulos T. Insights in immunomodulatory therapies for ulcerative colitis and Crohn's disease. Curr Gastroenterol Rep. 2006;8:499–505. doi: 10.1007/s11894-006-0040-6. [DOI] [PubMed] [Google Scholar]
- 9.Allez M, Mayer L. Regulatory T cells: peace keepers in the gut. Inflam Bowel Dis. 2004;10:666–76. doi: 10.1097/00054725-200409000-00027. [DOI] [PubMed] [Google Scholar]
- 10.Singh B, Read S, Asseman C, et al. Control of intestinal inflammation by regulatory T cells. Immunol Rev. 2001;182:190–200. doi: 10.1034/j.1600-065x.2001.1820115.x. [DOI] [PubMed] [Google Scholar]
- 11.Coombes JL, Robinson NJ, Maloy KJ, Uhlig HH, Powrie F. Regulatory T cells and intestinal homeostasis. Immunol Rev. 2005;204:184–94. doi: 10.1111/j.0105-2896.2005.00250.x. [DOI] [PubMed] [Google Scholar]
- 12.Mottet C, Uhlig HH, Powrie F. Cutting edge: cure of colitis by CD4+CD25+ regulatory T cells. J Immunol. 2003;170:3939–43. doi: 10.4049/jimmunol.170.8.3939. [DOI] [PubMed] [Google Scholar]
- 13.Maul J, Loddenkemper C, Mundt P, et al. Peripheral and intestinal regulatory CD4+CD25(high) T cells in inflammatory bowel disease. Gastroenterology. 2005;128:1868–78. doi: 10.1053/j.gastro.2005.03.043. [DOI] [PubMed] [Google Scholar]
- 14.Fontenot JD, Rudensky AY. A well adapted regulatory contrivance: regulatory T cell development and the forkhead family transcription factor Foxp3. Nat Immunol. 2005;6:331–7. doi: 10.1038/ni1179. [DOI] [PubMed] [Google Scholar]
- 15.Hori S, Sakaguchi S. Foxp3: a critical regulator of the development and function of regulatory T cells. Microbes Infect. 2004;6:745–51. doi: 10.1016/j.micinf.2004.02.020. [DOI] [PubMed] [Google Scholar]
- 16.Martin B, Banz A, Bienvenu B, et al. Suppression of CD4+ T lymphocyte effector functions by CD4+CD25+ cells in vivo. J Immunol. 2004;172:3391–8. doi: 10.4049/jimmunol.172.6.3391. [DOI] [PubMed] [Google Scholar]
- 17.Nelson BH. IL-2, regulatory T cells, and tolerance. J Immunol. 2004;172:3983–8. doi: 10.4049/jimmunol.172.7.3983. [DOI] [PubMed] [Google Scholar]
- 18.Ronchetti S, Zollo O, Bruscoli S, et al. GITR, a member of the TNF receptor superfamily, is costimulatory to mouse T lymphocyte subpopulations. Eur J Immunol. 2004;34:613–22. doi: 10.1002/eji.200324804. [DOI] [PubMed] [Google Scholar]
- 19.Makita S, Kanai T, Oshima S, et al. CD4+CD25bright T cells in human intestinal lamina propria as regulatory cells. J Immunol. 2004;173:3119–30. doi: 10.4049/jimmunol.173.5.3119. [DOI] [PubMed] [Google Scholar]
- 20.Holmen N, Lundgren A, Lundin S, et al. Functional CD4+CD25high regulatory T cells are enriched in the colonic mucosa of patients with active ulcerative colitis and increase with disease activity. Inflamm Bowel Dis. 2006;12:447–56. doi: 10.1097/00054725-200606000-00003. [DOI] [PubMed] [Google Scholar]
- 21.Weibel ER. Point counting methods. In: Weibel ER, editor. Sterological methods. Practical methods for biological morphometry. Vol. 1. London: Academic Press; 1979. pp. 101–61. [Google Scholar]
- 22.Ildgruben AK, Sjoberg IM, Hammarstrom ML. Influence of hormonal contraceptives on the immune cells and thickness of human vaginal epithelium. Obst Gynecol. 2003;102:571–82. doi: 10.1016/s0029-7844(03)00618-5. [DOI] [PubMed] [Google Scholar]
- 23.Rahman A, Fahlgren A, Sitohy B, et al. β-Defensin production by human colonic plasma cells: a new look at plasma cells in ulcerative colitis. Inflamm Bowel Dis. 2007;13:847–55. doi: 10.1002/ibd.20141. [DOI] [PubMed] [Google Scholar]
- 24.Sather BD, Treuting P, Perdue N, et al. Altering the distribution of Foxp3+ regulatory T cells results in tissue-specific inflammatory disease. J Exp Med. 2007;204:1335–47. doi: 10.1084/jem.20070081. [DOI] [PMC free article] [PubMed] [Google Scholar]
- 25.Herman AE, Freeman GJ, Mathis D, Benoist C. CD4+CD25+ T regulatory cells dependent on ICOS promoter regulation of effector cells in the prediabetic lesion. J Exp Med. 2004;199:1479–89. doi: 10.1084/jem.20040179. [DOI] [PMC free article] [PubMed] [Google Scholar]
- 26.Takahashi M, Nakamura K, Honda K, et al. An inverse correlation of human peripheral blood regulatory T cell frequency with the disease activity of ulcerative colitis. Dig Dis Sci. 2006;51:677–86. doi: 10.1007/s10620-006-3191-2. [DOI] [PubMed] [Google Scholar]
- 27.Roncador G, Brown PJ, Maestre L, et al. Analysis of Foxp3 protein expression in human CD4+CD25+ regulatory T cells at the single-cell level. Eur J Immunol. 2005;35:1681–91. doi: 10.1002/eji.200526189. [DOI] [PubMed] [Google Scholar]
- 28.Yu QT, Saruta M, Avanesyan A, Fleshner PR, Banham AH, Papadakis KA. Expression and functional characterization of Foxp3(+) CD4(+) regulatory T cells in ulcerative colitis. Inflamm Bowel Dis. 2007;13:191–9. doi: 10.1002/ibd.20053. [DOI] [PubMed] [Google Scholar]
- 29.Belkaid Y, Rouse BT. Natural regulatory T cells in infectious disease. Nat Immunol. 2005;6:353–60. doi: 10.1038/ni1181. [DOI] [PubMed] [Google Scholar]