

Abstract
Background & Aims
Accurate detection of hepatic fibrosis is crucial for assessing prognosis and candidacy for treatment in patients with chronic liver disease. Magnetic Resonance (MR) Elastography, a technique for quantitatively assessing the mechanical properties of soft tissues, has previously been shown to have potential for non-invasively detecting liver fibrosis. The goal of this work was to obtain preliminary estimates of the sensitivity and specificity of the technique in diagnosing liver fibrosis, and to assess its potential for identifying patients who can potentially avoid biopsy.
Methods
MR Elastography was performed in 35 normal volunteers and 50 patients with chronic liver disease. MRI measurements of hepatic fat/water ratios were obtained to assess the potential for fat infiltration to affect stiffness-based detection of fibrosis.
Results
Liver stiffness increased systematically with fibrosis stage. Receiver operating curve (ROC) analysis demonstrated that, with a shear stiffness cut off value of 2.93 kPa, the predicted sensitivity and specificity for detecting all grades of liver fibrosis is 98% and 99%. ROC analysis also provided evidence that MR Elastography can discriminate between patients with moderate and severe fibrosis (grades 2–4) and those with mild fibrosis (sensitivity 86%, specificity 85%). Hepatic stiffness does not appear to be influenced by the degree of steatosis.
Conclusions
MR Elastography is a safe, non-invasive technique with excellent diagnostic accuracy for assessing hepatic fibrosis. Based on the high negative predictive value of MR Elastography, an initial clinical application may be to triage patients who are under consideration for biopsy to assess possible hepatic fibrosis.
Keywords: Chronic liver disease, mechanical properties, elasticity, stiffness, cirrhosis
Introduction
Cirrhosis and its complications represent a significant public health problem in the United States. As the second leading gastrointestinal cause of death following colorectal cancer, cirrhosis accounts for an estimated 44,000 deaths, 150,000 acute care hospitalizations, and $1.1 billion in direct costs annually in the United States (1, 2). Furthermore, these trends are expected to increase, based on an aging population, the growing epidemic of obesity and its complications (non-alcoholic fatty liver diseases, NAFLD), and the continued emergence of chronic liver diseases and its complications among individuals with long-standing chronic hepatitis C infection (3, 4).
The major pathobiological process responsible for this significant burden of disease is progressive hepatic fibrosis, resulting in portal hypertension and liver cancer. Traditionally, the gold standard for detecting hepatic fibrosis is percutaneous liver biopsy. However, the widespread use of liver biopsy for defining the burden of hepatic fibrosis is not feasible based on inherent problems that include sampling error, cost, and poor acceptance of the technique by patients (5, 6). Thus, the lack of alternate, accurate diagnostic methods and continued reliance on liver biopsy represents a major obstacle to understanding the natural history of hepatic fibrogenesis, as well as determining the efficacy of emerging anti-fibrotic therapies in humans (7). A significant need exists for developing a safe and accurate non-invasive technique for detecting hepatic fibrosis in patients with chronic liver disease.
A number of non-invasive imaging techniques have been evaluated for possible use in diagnosing hepatic fibrosis. Dynamic contrast-enhanced MRI of the liver can demonstrate intensity and texture patterns that are associated with hepatic fibrosis, but these techniques are qualitative and may not be sufficiently sensitive in earlier stages of the disease (8–10), when it may be extremely advantageous to institute therapy. An early study of magnetization transfer (MT) contrast MR imaging techniques have demonstrated certain changes in the presence of hepatic fibrosis, but the specificity may be limited (8). Studies of diffusion-weighted MR imaging techniques, have demonstrated reduced apparent diffusion coefficient (ADC) values that are thought to represent the hydration and metabolic status of fibrotic liver, but the differences are relatively small (9). None of these imaging techniques have been shown to be sufficiently sensitive or specific for use as a clinical tool to detect occult yet significant hepatic fibrosis.
The mechanical properties of the liver tissue (elasticity or stiffness) are strongly correlated with the extent of fibrosis (10–14) and perhaps with increased hepatic vascular resistance and the associated elevation of portal venous pressure (15, 16). The feasibility of detecting in vivo liver stiffness among human subjects has been demonstrated with ultrasound-based transient elastography (17). With this method, a special vibrator applies compressional mechanical impulses of low frequency through intercostal spaces into the liver. A Doppler ultrasound system built into the vibrator measures the propagation velocity of the shear wave transients. The stiffness of the liver is then proportional to the square of the shear wave velocity. From seven large cross-sectional investigations involving over 2000 individual patients with chronic viral hepatitis C or B in Europe, the sensitivity and specificity of ultrasound-based elastography for detecting stage 4 fibrosis (cirrhosis) was greater than 90% (18). The precision of these estimates is less well-established for patients with NAFLD (18) and chronic cholestatic liver disease (19). Since the region assessed with transient elastography encompasses a 1 × 4 cm cylindrical area (approximately 1/100th of the entire hepatic parenchyma) with a measurement depth between 25 mm and 65 mm below the skin, and confined to the peripheral part of the right liver lobe, there is a potential for sampling errors. In the presence of prominent central obesity (defined as a body mass index > 28 kg/m²), there is a 9-fold increased risk of technical failure with transient elastography (20).
A technique known as Magnetic Resonance (MR) Elastography has also been described. This involves generating shear waves (either transient or continuous) with a driver device, imaging the propagating shear waves with a modified phase-contrast MR sequence, and processing the wave images with an inversion algorithm to obtain a quantitative image of shear stiffness (called an elastogram). MR Elastography can be readily implemented on standard MR imaging systems with little additional hardware (21). To date, MR Elastography has been applied to quantitatively assess the viscoelastic properties of many human tissues in vivo, including breast, brain, muscle, and liver (22–29). Preliminary studies in human subjects have confirmed the feasibility and promise of this technique for the quantitative assessment of hepatic fibrosis (27, 28).
The study had two aims: First, to estimate the diagnostic performance of an optimized MR Elastography protocol for assessing hepatic fibrosis among patients with diverse etiologies of chronic liver disease, and in normal individuals.
NAFLD is emerging as the most common liver disorder in industrialized countries and in many developing countries. Its histologic spectrum ranges from simple steatosis, steatosis with only mild inflammation to more severe steatohepatitis (30). Given the frequent association of fatty infiltration in patients with chronic liver disease alone or in association with other etiologies, a second aim was to determine whether degree of hepatic steatosis influenced stiffness of the liver, or the ability of MR Elastography to detect hepatic fibrosis.
Materials and Methods
Patient Population
Subjects undergoing clinical evaluation and management for chronic liver disease at the Mayo Clinic (Rochester, MN) between August 4, 2005 and March 10, 2007 were eligible for study participation. Inclusion criteria were 1) age ≥ 18 years, 2) percutaneous liver biopsy within 1 year of study enrollment (average time interval: 6.5 ± 3.9 months, range: 0–12 months) and/or 3) a diagnosis of compensated cirrhosis supported by liver histology or compatible clinical and imaging criteria. Exclusion criteria were 1) current or previous history of decompensating events (variceal hemorrhage and hepatic encephalopathy), 2) history of hepatocellular carcinoma or cholangiocarcinoma, 3) history of prior liver resection or transplantation, and 4) contraindications to MR examination such as aneurysm clip, deep brain stimulator, cardiac pacemaker, or implantable defibrillator. Recruitment was performed by a combination of prospective subject identification and by contact letter to patients with recent liver biopsy and/or clinical evaluation within 12 months. MR Elastography has been determined to be a non-significant risk procedure by the Mayo Institutional Review Board, which approved this study. Verbal consent was obtained from all volunteers and patients after the nature of the procedure had been fully explained to them and. Consent was documented in the medical records.
Normal individuals serving as normal controls were recruited prospectively on a volunteer basis. Inclusion criteria were 1) age ≥ 18 years, 2) no prior history of chronic liver disease, and 3) no abnormal liver enzymes on their most recent medical examination. None of the normal volunteers had previous diagnoses of diabetes mellitus or hypertension.
Data Collection
Following study consent, relevant demographic and clinical information was abstracted from the electronic medical record. Variables of interest for patients included age, sex, height, weight, body mass index, etiology of chronic liver disease, presence or absence of compensated cirrhosis by clinical criteria, and fibrosis stage on liver histology. For normal volunteers, the variables age, sex, height, weight, and body mass index were recorded.
MR Elastography Technique
MR Elastography was performed on a 1.5 T whole-body GE imager (Signa, GE Medical System, Milwaukee, WI, USA), using a transmit/receive body coil (Figure 1). Low amplitude mechanical waves at 60 Hz were generated in the abdomen during imaging, using an acoustic driver device placed on the anterior body wall. The total acquisition time required to obtain MR Elastography data was 40 seconds. Quantitative images displaying shear stiffness (MR elastograms) were generated by processing the acquired images of propagating shear waves with a previously described local frequency estimation (LFE) inversion algorithm (31, 32). The liver imaging protocol also included quantitative measurements of the F/W ratio of the liver using a single echo fast spoiled gradient echo (FSGE) images, collected at several different echo times, and a three-point Dixon method was used to quantitatively evaluate the ratio of fat and water signals (i.e. F/W ratio) (33, 34).
Figure 1. System for applying shear waves to the abdomen for MR Elastography of the liver.
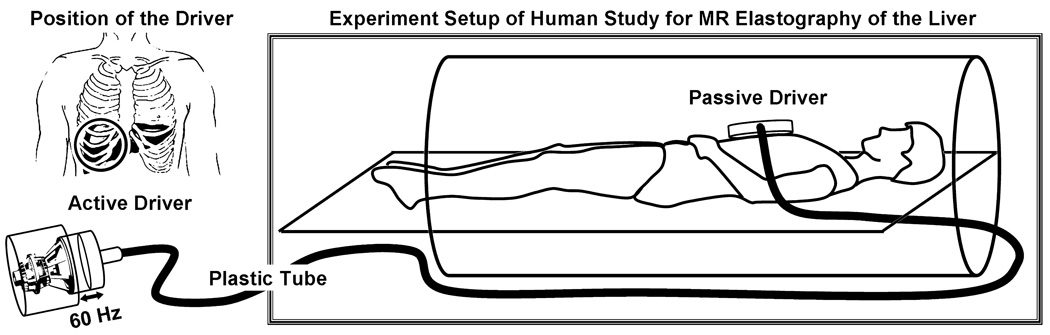
Acoustic pressure waves (at 60 Hz) are generated by an active audio driver, located away from the magnetic field of the MRI unit, and transmitted via a flexible tube to a passive pneumatic driver placed over the anterior body wall. The left diagram is a coronal illustration of the location of the passive pneumatic driver (circle) with respect to the liver.
Appendix (online) provides details of the MR Elastography protocol, processing of elastograms, measurement of steatosis using MR, and optimization of the driver used in MR Elastography.
Liver Histopathology
Specimens obtained from percutaneous liver biopsy were processed on the same day of the procedure. Standard techniques for hematoxylin and eosin (H & E) and Masson’s trichrome staining were applied. Histopathological interpretation was provided by a single hepatopathologist who was blinded to clinical information (inlcuding MR Elastography results) at initial evaluation in all cases. Fibrosis staging was assessed using classification systems developed for the specific liver disease etiologies under study including the METAVIR system for chronic viral and autoimmune hepatitis (35), the Brunt classification for nonalcoholic fatty liver disease (36), and the Batts-Ludwig system for cholestatic liver disease (37).
Statistical Analysis
Continuous variables were expressed as mean (standard deviation) or medians, where appropriate. Categorical variables were expressed as a proportion or percentage. It was hypothesized that there would be a significant correlation (either linear or exponential) between the estimates of liver stiffness and the stage of detected fibrosis. A least-squares regression analysis of the data was performed with the R² value used to evaluate how well the model fit the data. Mean liver stiffness values for each fibrosis stage on liver histology was then compared to mean liver stiffness values obtained from normal volunteers using a Kruskal-Wallis test followed by a nonparametric Dunnett’s test to compare liver stiffness in each stag of fibrosis versus control. Comparisons between mean liver stiffness values for patients with minimal to mild fibrosis (F0-1) and those with moderate to severe fibrosis (F2-3-4) were also performed using the same methods.
Receiver operating characteristic (ROC) analysis was conducted to assess the performance of MR Elastography over a range of sensitivity and specificity values. Area under the curve (AUC) was measured to provide information on the ability for MR Elastography to distinguish fibrotic livers from normal healthy livers. The discriminatory capability of MR Elastography for different fibrosis stages (F) was tested using the following stage groupings: F0-1 and F2-3-4; F0-1-2 and F3-4; F0-1-2-3 and F4. The correlation between the F/W ratio and mean liver stiffness values was assessed using regression methods to fit a linear model. All statistical analyses were performed with using JMP 6.0 (Statistical Discovery ™ From SAS Institute, Cary, NC, USA).
Results
Patient and volunteer demographics and diagnoses
Thirty-five volunteers (28% women, mean age: 37.2 years ± 17.8 with range 19 – 82, mean BMI: 23.6 kg/m² ± 3.8 with range 17.9 – 34.8) with no history of liver disease and 50 patients (54% women, mean age: 55.3 ± 11.2 with range 21 – 76,) with chronic liver disease consented to undergo MR Elastography. Among patients, the major etiologies of chronic liver disease included chronic hepatitis C (33%), nonalcoholic fatty liver disease (20%), autoimmune hepatitis (7%), primary biliary cirrhosis (7%), and alcoholic liver disease (7%). The mean liver biopsy length was 2.0 ± 0.9 cm (range 0.9 – 5.3 cm). The mean number of complete portal tracts available for assessment was 10 ± 4 (range 3–20). Stage of fibrosis was noted as 0 to 1 (40%), 2 to 3 (20%), and 4 (40%). The average MELD (Model End-stage Liver Disease, (38)) score for all patients was 6 (range, 6–7).
Quantitative assessment of MR Elastography performance
The optimized MR Elastography driver system generated shear waves that could be readily imaged throughout the visualized upper abdomen in both normal volunteers and patients. Figure 2 demonstrates shear wave images and elastograms obtained from a normal volunteer and a patient with grade 4 fibrosis. As in previous studies, the images demonstrate a strong relationship between the presence of hepatic fibrosis and increased tissue stiffness.
Figure 2. MR Elastography of the liver in a normal volunteer and a patient with cirrhosis.

Anatomic images of a normal volunteer and a patient with grade 4 fibrosis are shown in the far left column. The middle column of images shows wave image data in the liver and spleen, superimposed on the corresponding anatomic images. The resulting elastograms are shown in the far right column. The wave images show that the shear wavelength was higher in the fibrotic liver than in the normal liver. The elastograms show that the mean shear stiffness of the fibrotic liver was much higher than that of the normal liver (12.1 ± 1.2 kPa versus 1.8 ± 0.3 kPa, respectively).
No problems were encountered in applying the MR Elastography technique with the surface driver in obese patients (mean BMI of all patients: 29.7 ± 5.6 kg/m² with range 18.4 – 42.4) or those with other complications such as ascites (Figure 3), which could potentially prevent adequate generation of shear waves in the liver.
Figure 3. MR Elastography of the liver is applicable to patients with obesity and ascites.

The top row demonstrates MR Elastography in a liver fibrosis patient also suffering from obesity. The mean thickness of the body wall is 6 cm (BMI = 36) and yet the wave image shown in the middle shows that shear waves were still generated within the abdomen by the external driver. This patient with fibrosis stage 2 had a mean liver stiffness of 3.2 ± 0.8 kPa.
The bottom row illustrates application of the technique in a patient with ascites, as demonstrated in the the T2-weighted images on the far left. Excellent shear wave illumination of the liver was obtained, and in this patient with fibrosis stage 4, the mean shear stiffness of the liver was 11.3 ± 2.8 kPa.
Liver Stiffness measurements with MR Elastography
Mean values and variance of liver stiffness from the 35 normal volunteers and 48 patients with chronic liver disease are summarized in Figure 4. Adequate MRI data could not be obtained in 2 patients with hemochromatosis, where iron deposition caused hepatic MRI signal to be severely suppressed. The mean liver stiffness value for normal individuals was 2.20 ± 0.31 kPa (range: 1.77 – 2.85 kPa). For the entire group of patients with varying degrees of chronic liver disease, the mean liver stiffness value was 5.80 ± 2.57 kPa (range: 2.76 – 12.01 kPa). When assessed by stage of fibrosis, the mean liver stiffness value increased systematically with an excellent correlation between histological fibrosis and shear stiffness obtained with MR Elastography (R² = 0.94, p < 0.001) (Figure 4). Further comparisons between the normal volunteers and the patient groups demonstrated significantly higher mean liver stiffness values by fibrosis groups of F0-1-2, F3, and F4 compared to normal volunteers (p-value < 0.0001) (Figure 5). Between the mild (F0-1-2) and severe (F3-4) fibrosis groups, we also found significant differences in mean liver stiffness measurements (p-value < 0.05) (Figure 5).
Figure 4. Mean liver stiffness increases with the increased fibrosis stage in patients.

Shown is a summary of the mean shear stiffness measurements of the liver for the 35 normal volunteers and the 48 patients divided into the five different fibrosis stages, which are indicated as F0, F1 … F4. Liver stiffness is significantly higher in patients than in the control group. The standard errors for each group are also illustrated in error bar for each group. An exponential function fit well to the liver stiffness data with an R² value of 0.94.
Figure 5. Liver stiffness increases significantly with increased fibrosis extent determined by liver biopsy.

In the left diagram, significant differences (marked with star *) are observed in the liver stiffness between the normal control group and patient groups F0-1-2, F3, and F4. The p-values are all less than 0.0001. The confidence interval diamonds are shown for each group. In the right diagram, significant difference is also observed between the mild fibrosis groups (F0-1-2) and the severe fibrosis groups (F3-4). The p-value is less than 0.05. The center and the radius of the three circles indicate the mean and standard deviation of the normal, F0-1-2, and F3-4 fibrosis groups. The data were analyzed with a Kruskal-Wallis test followed by Dunnett’s test.
Initial estimates of sensitivity and specificity for detecting specific degrees of fibrosis by MR Elastography were calculated using ROC analysis (Figure 6). With a cutoff mean liver stiffness value of 2.93 kPa representing optimal performance, MR Elastography had a sensitivity of 98% (95% Confidence Interval (CI) = 87.5 – 99.9%) and specificity of over 99% (95% CI = 87.7 – 100%) for differentiating any stage of liver fibrosis from normal liver tissue with 91% power. The negative predictive value was 97% (95% CI = 83.8 – 99.8%). The AUC value for this cut-off value was 0.9988. For identifying patients with Stage 2–4 fibrosis as compared to individuals with stage 0–1 fibrosis, a cut-off mean value of 4.89 kPa had a sensitivity and specificity of 86% and 85%, respectively. Finally, the detection of advanced hepatic fibrosis(stage 3–4) by MR Elastography had a sensitivity and specificity of 78% and 96%, respectively. No obvious relationship was apparent between stiffness value and etiology in the group of patients with high grade fibrosis. The AUC value for these ROC curves were all greater than 0.91 (Figure 6).
Figure 6. ROC analysis of the diagnostic ability of MR Elastography for hepatic fibrosis.
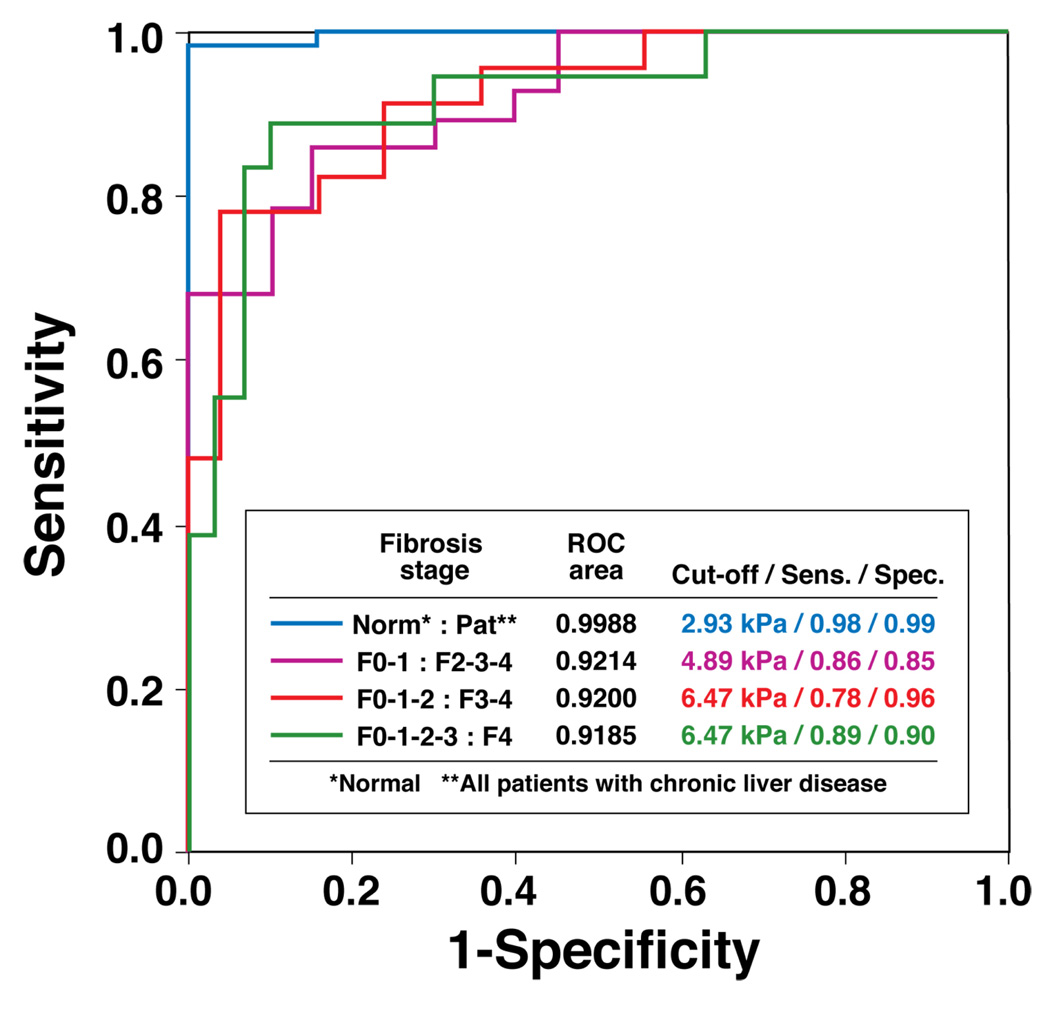
Four ROC curves are illustrated to indicate the ability of this MR Elastography protocol to distinguish different fibrosis stages. The accompanying table shows the values for the AUC (area under the ROC curve), the optimal cut-off liver stiffness, and the corresponding sensitivity and specificity using the optimal cut-off stiffness for each test.
Hepatic Steatosis measurements with MR Elastography
The degree of hepatic steatosis was successfully assessed in all volunteers and patients. The range of hepatic F/W ratio values was between 0 and 0.68. Irrespective of fibrosis stage, there was no significant relationship between degree of hepatic steatosis and mean liver stiffness overall (R² < 0.05) (Figure 7).
Figure 7. No correlations were observed between the F/W ratios and the liver stiffness measurements in normal volunteers and each fibrosis groups.
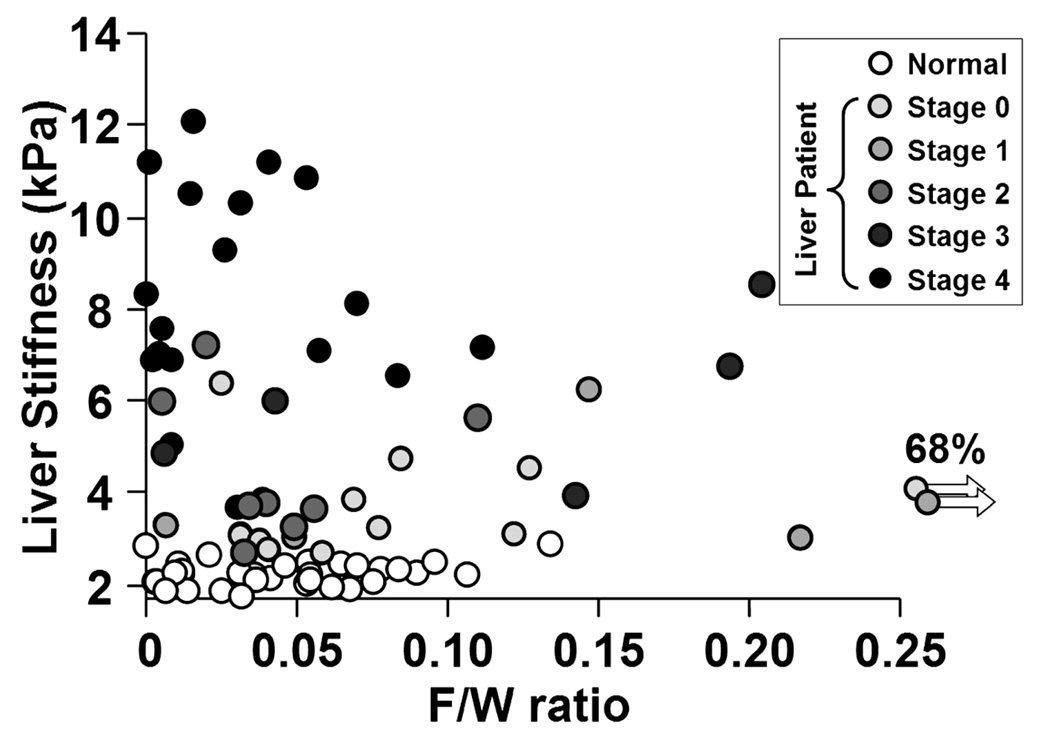
Linear regressions were used to evaluate the possible correlation between the hepatic F/W ratios and the liver stiffness measurements for the normals and the patients. Since the R² values are all less than 0.05, no significant correlations were found.
Discussion
The results of this study support the hypothesis that MR Elastography is effective for distinguishing normal from fibrotic livers with a very high negative predictive value of 97%. It appears to be very good at differentiating normal from mild fibrosis (F0-2), and mild fibrosis (F0-2) from severe fibrosis (F3-4). The presence of steatosis does not appear to affect shear stiffness measurements.
Liver stiffness assessed by MR Elastography was highly consistent among normal individuals with a mean value of 2.20 ± 0.31 kPa. Among patients with diverse chronic liver diseases, the mean liver stiffness values increased systematically with progressive degrees of hepatic fibrosis. The upward curving slope observed in the relationship between the mean liver stiffness and fibrosis stage may be related to varying rates of fibrosis progression with advancing disease. An alternative explanation may be that the limitations of the discrete values used in the histological scoring systems, preventing a true ordinal discrimination between early and intermediate stages (5). However, these results are in agreement with observations from different research groups using ultrasound-based transient elastography (17, 39–41) and MR Elastography techniques (27–29).
Significant differences in mean liver stiffness were observed between the normal volunteers and the patient cohort as a whole. With a cut-off value of 2.93 kPa, we obtained a sensitivity of 98% (95% CI = 87.5 – 99.9%) and a specificity of over 99% (95% CI = 87.7 – 100%) for discriminating any degree of hepatic fibrosis compared to normal liver tissue. The negative predictive value of stiffness measurement below the cut-off is 97% (95% CI = 83.8 – 99.8%). The ROC analysis also predicts that MR Elastography will be useful for differentiating patients with clinically important hepatic fibrosis (stage 2–4) from those individuals with lesser degrees of fibrosis, including persons without chronic liver disease.
In view of the fact that hepatic steatosis is common in the presence or absence of well-described chronic liver disease, we also sought to determine whether fatty infiltration influenced the detection of hepatic fibrosis by MR Elastography, leading to an underestimation of liver stiffness because fat is typically soft. Analysis of the F/W ratios and liver stiffness in all human subjects does not support an effect of steatosis on measurement of liver stiffness. The elastograms show that the stiffness of normal liver tissue is very similar to that of subcutaneous fat. This may explain why the presence of steatosis in otherwise normal liver tissue does not directly affect shear stiffness. However, the introduction of fibrosis may independently cause the liver to become stiffer, much as placing a stiff spring in parallel with a soft spring will cause the combined mechanical system to become stiffer. Hence, fat infiltration does not appear to interfere with the shear stiffness measurements of normal or fibrotic liver. In summary, MR Elastography appears to be equally feasible and reliable as a technique for assessing hepatic fibrosis in patients with steatosis and BMI indices above 28 kg/m², as it is for people without steatosis.
Several unique qualities are observed with MR Elastography with respect to its potential broad application in heterogeneous populations. These include 1) a freely oriented field of view, 2) no need for acoustical window in contrast to transient elastography, 3) compatibility with many other receive coils such as multi-channel phased array torso coil, 4) operator independence, 5) insensitivity to body habitus, 6) the ability to obtain a conventional MR examination at the same time (27–29), and 7) potential to assess the entire liver with an appropriate rapid multi-slice method, as echo-planar MR Elastography (42). Thus, this technique provides an overall estimate rather than a narrow sliver obtained with ultrasound transient elastography or liver biopsy.
This study has several potential limitations. The time interval between the biopsies and the MR Elastography exam ranged from 0.5 days to 12 months before the study, with a mean of 6.5 ± 3.9 months. This could have resulted in some bias in the results if the disease progressed, between the time of biopsy and imaging. The promising results of this preliminary study provide motivation for further evaluation of the technique using a study design with more defined inclusion criteria, biopsy within days of the imaging procedure, and more comprehensive characterization of the associated clinical data. Further experience with MR Elastography in a larger population of patients with chronic liver disease will also serve to verify the estimates of sensitivity and specificity for diagnosis of hepatic fibrosis and differentiating between stages of the disease observed in this investigation.
Given the high negative predictive value observed in this study, an initial application for MR Elastography in clinical practice may be to systematically improve patient selection and appropriateness for liver biopsy performance. As anti-fibrotic therapies evolve, it is possible that the MR Elastography technique may be useful to monitor treatment efficacy and optimize dosing. The technique may also be helpful in studying the natural history of liver fibrosis in patients with chronic liver disease.
Conclusion
The detection of hepatic fibrosis by MR Elastography appears safe and feasible in human subjects with chronic liver disease. Furthermore, this method is highly sensitive and specific for detecting intermediate stages of hepatic fibrosis based on the information available from this investigation. The presence of hepatic steatosis had no apparent effect on the liver stiffness measurements. Overall, these results provide continued motivation for further evaluation of hepatic MR Elastography in patients with suspected hepatic fibrosis. The technique has potential to spare certain patients the discomfort and risk of complications associated with liver biopsy, and to potentially increase the reliability of diagnosis by reducing sampling errors.
Acknowledgement
The authors thank Diane M. Sauter, and Jennifer L. Kugel for technical assistance.
This work has been supported by NIH grants EB001981
Abbreviations
- AUC
area under curve
- F
fibrosis
- F/W
fat to water ratio
- MR
magnetic resonance
- MT
magnetization transfer
- NAFLD
non-alcoholic fatty liver disease
- kPa
kilopascal
Appendix
MR Elastography Protocol
MR Elastography Technique
All MR Elastography experiments were performed using a 1.5 T whole-body GE imager (Signa, GE Medical System, Milwaukee, WI, USA) using the transmit/receive body coil (Figure 1).
All volunteers and patients were imaged in the supine position with a 19-cm diameter 1.5-cm thick cylindrical passive longitudinal shear wave driver placed against the anterior body wall. The driver was placed over the right lobe of the liver on the chest wall below the breast. Continuous longitudinal vibrations at 60 Hz were generated by varying acoustic pressure waves transmitted from an active driver device via a vinyl tube (2.5 cm inside diameter and 7.6 m length).
A 2-D gradient echo MR Elastography sequence was used to collect axial wave images with the following parameters: 60 Hz continuous sinusoidal vibration, FOV = 32–42 cm, matrix = 256×64, flip angle = 30°, slice thickness = 10 mm, TR/TE = 50/23 ms, 4 evenly-spaced phase offsets, and 1 pair of 60 Hz trapezoidal motion-encoding gradients with zeroth and first moment nulling along the through-plane direction. Two spatial presaturation bands were applied on each side of the selected slice to reduce motion artifacts from blood flow. The total acquisition time was 40 seconds, split into 4 periods of suspended respiration. The appendix figure shows the pulse sequence implemented for 2-D MR Elastography acquisition. In order to obtain a consistent position of the liver for each phase offset, individual subjects were asked to hold their breath at the end of expiration.
Appendix Figure. Gradient echo MR Elastography sequence.

This sequence is a conventional gradient echo sequence with an additional motion encoding gradient (MEG) applied along the slice-selection direction (Gz) to detect cyclic motion in the through-plane direction. The MEG was designed to minimize zeroth and first gradient moments. The MEG and the acoustic driver are synchronized using trigger pulses provided by the imager. The phase offset (θ) between the two can be adjusted to acquire wave images at different phases of the cyclic motion.
MR Elastograms
MR elastograms of the liver were obtained by processing the acquired images of propagating shear waves with a previously described local frequency estimation (LFE) inversion algorithm (31, 32). The LFE algorithm combines local estimates of instantaneous spatial frequency over several scales to provide robust estimates of stiffness. A Gaussian bandpass filter was applied to the original wave data to remove low-frequency wave information due to longitudinal waves and bulk motion, and high-frequency noise. The cut-off frequencies of the bandpass filter were carefully chosen to be far away from the dominant spatial frequencies observed in the liver data. The high-end spatial frequency cut-off value is 1.25 cm−1 that corresponds to stiffness values less than 0.5 kPa, while the low-end cut-off value is 0.08 cm−1 that corresponds to stiffness values above 100 kPa. Prior to applying the LFE inversion algorithm, we used 8 motion direction filters (43) evenly spaced between 0° and 360° and combined in a weighted least-square method to improve the performance of the algorithm, since complex interference of shear waves from all directions might produce areas with low shear displacement amplitude. All of these steps in processing can be applied automatically, without human intervention, to yield quantitative images of tissue shear stiffness, in units of kilopascals. We have used the designation “shear stiffness”, rather than “shear modulus” to indicate that the measurements may include a viscous component, although this is likely to be very small at the low driving frequency used (22). The elastograms were analyzed by measuring mean shear stiffness within a large, manually specified region-of interest that included an entire cross-sectional image of hepatic parenchyma, while excluding major blood vessels, such as hepatic veins, main portal veins and branches that have width greater than 6 pixels (about 8 mm). MR Elastography interpretation was performed in a blinded fashion without knowledge of clinical information for all patients.
Measurement of Hepatic Steatosis by MR Imaging
The liver imaging protocol also included quantitative measurements of the F/W ratio of the liver using a single echo fast spoiled gradient echo (FSGE) images, collected at several different echo times. The imaging parameters for these acquisitions were: FOV = 32–42 cm, matrix = 256×256, flip Angle = 30°, slice thickness = 10 mm, TR = 34 ms, TE = 4.8/7.2/9.6 ms, 9 second breath hold for each acquisition. A three-point Dixon method was used to quantitatively evaluate the ratio of fat and water signals (i.e. F/W ratio) from three MR data sets obtained with 4.8/7.2/9.6 ms echo times, giving two in-phase and one opposed-phase images that represent (2π, 3π, 4π) phase angles between fat and water (33, 34). The F/W ratio was calculated within the same ROI in the liver tissue as was used for the stiffness estimates.
Driver Optimization
The experimental setup for this study was the culmination of several previous MR Elastography studies involving different driver designs and imaging parameters. Because of the limited accessibility of the liver, other researchers have investigated delivering longitudinal vibrations into the liver using a subcostally located, extended piston driver design (29) or an electromechanically activated piston placed against the posterior body wall (27). Our solution employed a 19-cm passive pneumatic drum-like driver placed on the anterior body wall and connected by a flexible waveguide conduit to an active audio driver. Previous studies (28) indicated that while this style of passive driver produces no MR artifacts and is well tolerated by the subjects, it creates diffraction-biased shear wave fields (44). However, since increasing the driver size decreases the diffraction angle, the large, 19-cm driver used for this study was chosen because its large size would result in shear waves with approximately no diffraction even in cirrhotic liver tissue, and drivers with larger diameters may fit the contour of the body wall of a diverse range of patients. Larger drivers (like the 19-cm driver) also tend to deliver superior motion amplitude at the low frequency used for this study than the smaller drivers previously reported.
An open question in abdominal MR Elastography with the kinds of drivers presented here and by other researchers (27–29) involves the primary mechanisms of shear wave production in the abdominal organs due to vibrations from external sources. One source is shear waves produced through mode conversion at the surface, that then propagate directly through the body wall and into the abdominal organs. However, as can be seen in Figure 2 and Figure 3, there is significant wave motion throughout the abdomen, including within the spleen which is located on the opposite side of the abdominal cavity from where the driver was located. This behavior could also be explained by the hypothesis that shear waves in the abdomen may also be produced by a secondary vibrating source which encloses the abdominal organs, specifically the diaphragm. Since the diaphragm is adjacent to organs like the liver and spleen, the longitudinal vibrations of the driver may significantly vibrate the diaphragm, which then transmits that energy into the abdominal organs. There is currently not enough data to distinguish the exact mechanisms of shear wave formation that are occurring in vivo, but a better understanding of these mechanisms could lead to improved driver design and imaging parameters.
Footnotes
Conflicts of interests: PJR and RLE and their institution hold patents related to this technology and have a potential financial interest in this research.
Publisher's Disclaimer: This is a PDF file of an unedited manuscript that has been accepted for publication. As a service to our customers we are providing this early version of the manuscript. The manuscript will undergo copyediting, typesetting, and review of the resulting proof before it is published in its final citable form. Please note that during the production process errors may be discovered which could affect the content, and all legal disclaimers that apply to the journal pertain.
References
- 1.Kim WR, Brown RS, Jr, Terrault NA, El-Serag H. Burden of liver disease in the United States: summary of a workshop. Hepatology. 2002;36:227–242. doi: 10.1053/jhep.2002.34734. [DOI] [PubMed] [Google Scholar]
- 2.Shaheen NJ, Hansen RA, Morgan DR, Gangarosa LM, Ringel Y, Thiny MT, Russo MW, et al. The burden of gastrointestinal and liver diseases, 2006. Am J Gastroenterol. 2006;101:2128–2138. doi: 10.1111/j.1572-0241.2006.00723.x. [DOI] [PubMed] [Google Scholar]
- 3.Davis GL, Albright JE, Cook SF, Rosenberg DM. Projecting future complications of chronic hepatitis C in the United States. Liver Transpl. 2003;9:331–338. doi: 10.1053/jlts.2003.50073. [DOI] [PubMed] [Google Scholar]
- 4.Charlton M. Nonalcoholic fatty liver disease: a review of current understanding and future impact. Clin Gastroenterol Hepatol. 2004;2:1048–1058. doi: 10.1016/s1542-3565(04)00440-9. [DOI] [PubMed] [Google Scholar]
- 5.Standish RA, Cholongitas E, Dhillon A, Burroughs AK, Dhillon AP. An appraisal of the histopathological assessment of liver fibrosis. Gut. 2006;55:569–578. doi: 10.1136/gut.2005.084475. [DOI] [PMC free article] [PubMed] [Google Scholar]
- 6.Bravo AA, Sheth SG, Chopra S. Liver biopsy. N Engl J Med. 2001;344:495–500. doi: 10.1056/NEJM200102153440706. [DOI] [PubMed] [Google Scholar]
- 7.Friedman SL, Bansal MB. Reversal of hepatic fibrosis -- fact or fantasy? Hepatology. 2006;43:S82–S88. doi: 10.1002/hep.20974. [DOI] [PubMed] [Google Scholar]
- 8.Chen JH, Chai JW, Shen WC. Magnetization transfer contrast imaging of liver cirrhosis. Hepatogastroenterology. 1999;46:2872–2877. [PubMed] [Google Scholar]
- 9.Aube C, Racineux PX, Lebigot J, Oberti F, Croquet V, Argaud C, Cales P, et al. Diagnosis and quantification of hepatic fibrosis with diffusion weighted MR imaging: preliminary results. J Radiol. 2004;85:301–306. doi: 10.1016/s0221-0363(04)97582-8. [DOI] [PubMed] [Google Scholar]
- 10.Yeh WC, Li PC, Jeng YM, Hsu HC, Kuo PL, Li ML, Yang PM, et al. Elastic modulus measurements of human liver and correlation with pathology. Ultrasound Med Biol. 2002;28:467–474. doi: 10.1016/s0301-5629(02)00489-1. [DOI] [PubMed] [Google Scholar]
- 11.Yamanaka N, Okamoto E, Toyosaka A, Ohashi S, Tanaka N. Consistency of human liver. J Surg Res. 1985;39:192–198. doi: 10.1016/0022-4804(85)90142-8. [DOI] [PubMed] [Google Scholar]
- 12.Nishizaki T, Matsumata T, Kamakura T, Adachi E, Sugimachi K. Significance of intraoperative measurement of liver consistency prior to hepatic resection. Hepatogastroenterology. 1995;42:5–8. [PubMed] [Google Scholar]
- 13.Castera L, Vergniol J, Foucher J, Le Bail B, Chanteloup E, Haaser M, Darriet M, et al. Prospective comparison of transient elastography, Fibrotest, APRI, and liver biopsy for the assessment of fibrosis in chronic hepatitis C. Gastroenterology. 2005;128:343–350. doi: 10.1053/j.gastro.2004.11.018. [DOI] [PubMed] [Google Scholar]
- 14.Ziol M, Handra-Luca A, Kettaneh A, Christidis C, Mal F, Kazemi F, de Ledinghen V, et al. Noninvasive assessment of liver fibrosis by measurement of stiffness in patients with chronic hepatitis C. Hepatology. 2005;41:48–54. doi: 10.1002/hep.20506. [DOI] [PubMed] [Google Scholar]
- 15.Hernandez-Guerra M, Garcia-Pagan JC, Bosch J. Increased hepatic resistance: a new target in the pharmacologic therapy of portal hypertension. J Clin Gastroenterol. 2005;39:S131–S137. doi: 10.1097/01.mcg.0000155513.17715.f7. [DOI] [PubMed] [Google Scholar]
- 16.Carrion JA, Navasa M, Bosch J, Bruguera M, Gilabert R, Forns X. Transient elastography for diagnosis of advanced fibrosis and portal hypertension in patients with hepatitis C recurrence after liver transplantation. Liver Transpl. 2006;12:1791–1798. doi: 10.1002/lt.20857. [DOI] [PubMed] [Google Scholar]
- 17.Sandrin L, Fourquet B, Hasquenoph JM, Yon S, Fournier C, Mal F, Christidis C, et al. Transient elastography: a new noninvasive method for assessment of hepatic fibrosis. Ultrasound Med Biol. 2003;29:1705–1713. doi: 10.1016/j.ultrasmedbio.2003.07.001. [DOI] [PubMed] [Google Scholar]
- 18.Ganne-Carrie N, Ziol M, de Ledinghen V, Douvin C, Marcellin P, Castera L, Dhumeaux D, et al. Accuracy of liver stiffness measurement for the diagnosis of cirrhosis in patients with chronic liver diseases. Hepatology. 2006;44:1511–1517. doi: 10.1002/hep.21420. [DOI] [PubMed] [Google Scholar]
- 19.Corpechot C, El Naggar A, Poujol-Robert A, Ziol M, Wendum D, Chazouilleres O, de Ledinghen V, et al. Assessment of biliary fibrosis by transient elastography in patients with PBC and PSC. Hepatology. 2006;43:1118–1124. doi: 10.1002/hep.21151. [DOI] [PubMed] [Google Scholar]
- 20.Foucher J, Castera L, Bernard PH, Adhoute X, Laharie D, Bertet J, Couzigou P, et al. Prevalence and factors associated with failure of liver stiffness measurement using FibroScan in a prospective study of 2114 examinations. Eur J Gastroenterol Hepatol. 2006;18:411–412. doi: 10.1097/00042737-200604000-00015. [DOI] [PubMed] [Google Scholar]
- 21.Muthupillai R, Lomas DJ, Rossman PJ, Greenleaf JF, Manduca A, Ehman RL. Magnetic resonance elastography by direct visualization of propagating acoustic strain waves. Science. 1995;269:1854–1857. doi: 10.1126/science.7569924. [DOI] [PubMed] [Google Scholar]
- 22.McKnight AL, Kugel JL, Rossman PJ, Manduca A, Hartmann LC, Ehman RL. MR elastography of breast cancer: preliminary results. AJR Am J Roentgenol. 2002;178:1411–1417. doi: 10.2214/ajr.178.6.1781411. [DOI] [PubMed] [Google Scholar]
- 23.Sinkus R, Tanter M, Xydeas T, Catheline S, Bercoff J, Fink M. Viscoelastic shear properties of in vivo breast lesions measured by MR elastography. Magn Reson Imaging. 2005;23:159–165. doi: 10.1016/j.mri.2004.11.060. [DOI] [PubMed] [Google Scholar]
- 24.Kruse SA, Smith JA, Lawrence AJ, Dresner MA, Manduca A, Greenleaf JF, Ehman RL. Tissue characterization using magnetic resonance elastography: preliminary results. Phys Med Biol. 2000;45:1579–1590. doi: 10.1088/0031-9155/45/6/313. [DOI] [PubMed] [Google Scholar]
- 25.Dresner MA, Rose GH, Rossman PJ, Muthupillai R, Manduca A, Ehman RL. Magnetic resonance elastography of skeletal muscle. J Magn Reson Imaging. 2001;13:269–276. doi: 10.1002/1522-2586(200102)13:2<269::aid-jmri1039>3.0.co;2-1. [DOI] [PubMed] [Google Scholar]
- 26.Sack I, Bernarding J, Braun J. Analysis of wave patterns in MR elastography of skeletal muscle using coupled harmonic oscillator simulations. Magn Reson Imaging. 2002;20:95–104. doi: 10.1016/s0730-725x(02)00474-5. [DOI] [PubMed] [Google Scholar]
- 27.Huwart L, Peeters F, Sinkus R, Annet L, Salameh N, ter Beek LC, Horsmans Y, et al. Liver fibrosis: non-invasive assessment with MR elastography. NMR Biomed. 2006;19:173–179. doi: 10.1002/nbm.1030. [DOI] [PubMed] [Google Scholar]
- 28.Rouviere O, Yin M, Dresner MA, Rossman PJ, Burgart LJ, Fidler JL, Ehman RL. MR elastography of the liver: preliminary results. Radiology. 2006;240:440–448. doi: 10.1148/radiol.2402050606. [DOI] [PubMed] [Google Scholar]
- 29.Klatt D, Asbach P, Rump J, Papazoglou S, Somasundaram R, Modrow J, Braun J, et al. In Vivo Determination of Hepatic Stiffness Using Steady-State Free Precession Magnetic Resonance Elastography. Invest Radiol. 2006;41:841–848. doi: 10.1097/01.rli.0000244341.16372.08. [DOI] [PubMed] [Google Scholar]
- 30.Marx J. Unraveling the causes of diabetes. Science. 2002;296:686–689. doi: 10.1126/science.296.5568.686. [DOI] [PubMed] [Google Scholar]
- 31.Westin CF, Wigstrom L, Loock T, Sjoqvist L, Kikinis R, Knutsson H. Three-dimensional adaptive filtering in magnetic resonance angiography. J Magn Reson Imaging. 2001;14:63–71. doi: 10.1002/jmri.1152. [DOI] [PubMed] [Google Scholar]
- 32.Manduca A, Oliphant TE, Dresner MA, Mahowald JL, Kruse SA, Amromin E, Felmlee JP, et al. Magnetic resonance elastography: non-invasive mapping of tissue elasticity. Med Image Anal. 2001;5:237–254. doi: 10.1016/s1361-8415(00)00039-6. [DOI] [PubMed] [Google Scholar]
- 33.Glover GH, Schneider E. Three-point Dixon technique for true water/fat decomposition with B0 inhomogeneity correction. Magn Reson Med. 1991;18:371–383. doi: 10.1002/mrm.1910180211. [DOI] [PubMed] [Google Scholar]
- 34.Glover GH. Multipoint Dixon technique for water and fat proton and susceptibility imaging. J Magn Reson Imaging. 1991;1:521–530. doi: 10.1002/jmri.1880010504. [DOI] [PubMed] [Google Scholar]
- 35.The French METAVIR Cooperative Study Group. Intraobserver and interobserver variations in liver biopsy interpretation in patients with chronic hepatitis C. Hepatology. 1994;20:15–20. [PubMed] [Google Scholar]
- 36.Brunt EM, Janney CG, Di Bisceglie AM, Neuschwander-Tetri BA, Bacon BR. Nonalcoholic steatohepatitis: a proposal for grading and staging the histological lesions. Am J Gastroenterol. 1999;94:2467–2474. doi: 10.1111/j.1572-0241.1999.01377.x. [DOI] [PubMed] [Google Scholar]
- 37.Batts KP, Ludwig J. Chronic hepatitis. An update on terminology and reporting. Am J Surg Pathol. 1995;19:1409–1417. doi: 10.1097/00000478-199512000-00007. [DOI] [PubMed] [Google Scholar]
- 38.Kamath PS, Wiesner RH, Malinchoc M, Kremers W, Therneau TM, Kosberg CL, D'Amico G, et al. A model to predict survival in patients with end-stage liver disease. Hepatology. 2001;33:464–470. doi: 10.1053/jhep.2001.22172. [DOI] [PubMed] [Google Scholar]
- 39.Nguyen-Khac E, Capron D. Noninvasive diagnosis of liver fibrosis by ultrasonic transient elastography (Fibroscan) Eur J Gastroenterol Hepatol. 2006;18:1321–1325. doi: 10.1097/01.meg.0000243884.55562.37. [DOI] [PubMed] [Google Scholar]
- 40.Verveer C, de Knegt RJ. Non-invasive measurement of liver fibrosis: application of the FibroScan in hepatology. Scand J Gastroenterol Suppl. 2006:85–88. doi: 10.1080/00365520600664359. [DOI] [PubMed] [Google Scholar]
- 41.Foucher J, Chanteloup E, Vergniol J, Castera L, Le Bail B, Adhoute X, Bertet J, et al. Diagnosis of cirrhosis by transient elastography (FibroScan): a prospective study. Gut. 2006;55:403–408. doi: 10.1136/gut.2005.069153. [DOI] [PMC free article] [PubMed] [Google Scholar]
- 42.Yin M, Grimm RC, Manduca A, Ehman RL. Proceedings of the International Society for Magnetic Resonance in Medicine; 2006. Seattle, WA, USA: 2006. Rapid EPI-based MR Elastography of the Liver. [Google Scholar]
- 43.Manduca A, Lake DS, Kruse SA, Ehman RL. Spatio-temporal directional filtering for improved inversion of MR elastography images. Med Image Anal. 2003;7:465–473. doi: 10.1016/s1361-8415(03)00038-0. [DOI] [PubMed] [Google Scholar]
- 44.Yin M, Rouviere O, Ehman RL. Proceedings of the International Society for Magnetic Resonance in Medicine; 2005. Miami Beach, FL, USA: 2005. Shear Wave Diffraction Fields Generated by Longitudinal MRE Drivers; p. 2560. [Google Scholar]