

Abstract
Background
A low level of response to alcohol is a major risk factor for the development of alcohol dependence, but neural correlates of this marker are unclear.
Method
Ten healthy volunteers were classified by median split on level of response to alcohol and underwent 2 sessions of functional magnetic resonance imaging following ingestion of a moderate dose of alcohol and a placebo. The blood oxygen level–dependent activation to an event-related visual working memory test was examined.
Results
The subjects exhibited longer response latencies and more errors as a function of increasing working memory load and showed a load-dependent increase in activation in dorsolateral prefrontal cortex, posterior parietal cortex, and visual cortex. Alcohol did not affect performance (errors or response latency), but attenuated the working memory load–dependent activation in the dorsolateral prefrontal cortex. During the placebo condition, individuals with a low level of response to alcohol showed greater activation in dorsolateral prefrontal cortex and posterior parietal cortex than those with a high level of response to alcohol. During the alcohol condition, groups showed similar attenuation of load-dependent brain activation in these regions.
Conclusion
Low-level responders relative to high-level responders exhibited an increased working memory load–dependent activation in dorsolateral prefrontal cortex and posterior parietal cortex when not exposed to alcohol. This increase in brain response was attenuated in low-level responders after ingesting a moderate dose of alcohol.
Keywords: Alcohol, Working Memory, Functional MRI, Risk Factors
ALOW LEVEL of response to alcohol is a genetically influenced factor that contributes to the development of alcohol use disorders (AUD, Schuckit, 1994; Schuckit, 1998; Schuckit, 1999; Schuckit and Smith, 1996). Individuals who require higher doses of alcohol to achieve a given effect (i.e., have a low level of response at a given blood alcohol concentration or BAC) are more likely to develop AUDs than those who react more intensely to ethanol's effects, as shown by 10- and 15-year follow-ups (Heath et al., 1999; Schuckit and Smith, 1996; Volavka et al., 1996). This trait is seen in 40% of sons and daughters of alcoholics but less than 10% of controls (Schuckit and Smith, 1996). Animal and human studies indicate a heritability of 40% to 60% (Martin, 1988; Schuckit, 1999; Schuckit et al., 2001). A search is now under way to identify specific genes that contribute to level of response (Hu et al., 2005; Schuckit et al., 1999; Schuckit et al., 2001).
Little is known about the neural mechanisms that underlie individual differences in the level of response to alcohol. Using functional neuroimaging, one can begin to identify how brain systems contribute to individual differences in level of response to alcohol. In a previous study, we examined the relationship between neural activation during a visual working memory task and the self-reported level of response to alcohol in 35 adolescents. In that study, a retrospective self-report measure ascertained the number of drinks required for each of up to 4 effects of alcohol during the first 5 times of drinking (Schuckit et al., 1997, 2005). For the teenage participants, the self-report measure significantly predicted functional magnetic resonance imaging (FMRI) blood oxygen level–dependent (BOLD) response to the visual working memory task in right dorsolateral prefrontal (BA 6, 8, and 9) and bilateral anterior cingulate (BA 32) regions, as well as the right cerebellum and parahippocampal gyrus (BA 28). This relationship remained significant after controlling for drinks consumed per month, age, gender, and ethnicity. These results suggested that young people who report having needed more alcohol to achieve specific effects during early drinking experiences (i.e., have a low level of response) show higher levels of brain response during visual working memory. However, it remained unclear how individuals with a low or high level of response might respond to such a task after alcohol administration.
Alcohol profoundly affects brain metabolism and blood flow. Some investigators have found up to 23% reductions in cerebral glucose metabolism after alcohol (Volkow et al., 2005; Wang et al., 2000), whereas others reported much smaller changes (deWit et al., 1990) or even metabolic increases (Lyons et al., 1998). A moderate dose of alcohol increases blood flow in ventral striatum and in the ascending reticular activating system (Ingvar et al., 1998). Previous studies using FMRI (Logothetis et al., 2001) and a standardized alcohol challenge found both increased and decreased activation patterns (Calhoun et al., 2004a, 2004b; Levin et al., 1998). In particular, during a visual perception task, dose-related activation increases were found in insula, dorsolateral prefrontal, and precentral cortices, while dose-dependent activation decreases were observed in anterior and posterior cingulate, precuneus, middle frontal, and superior frontal areas (Calhoun et al., 2004b). However, relatively few studies have used FMRI to examine acute effects of alcohol, and results have been somewhat inconsistent.
Behaviorally, several studies have shown that alcohol affects executive functioning, which comprises a series of cognitive processes such as selective attention, task switching, and working memory (Baddeley et al., 2001; Weissenborn and Duka, 2003). Specifically, alcohol impairs aspects of immediate working memory performance during rising blood alcohol levels (Grattan-Miscio and Vogel-Sprott, 2005), which is consistent with the general hypothesis of alcohol-induced impairment of the behavioral control system (Vogel-Sprott et al., 2001). Our previous study showed that low-level response individuals relative to high responders exhibited increased brain activation during a working memory task when sober (Tapert et al., 2004). Therefore, paradigms examining working memory are useful for probing the effects of alcohol on executive functioning, and the level of response to alcohol as an important mediating factor, because they are associated with a well-defined neural substrate and show load-related neural activation differences and performance effects.
This investigation examined: (1) the effect of a standardized alcohol challenge on behavioral performance and neural activation during a visual working memory task and (2) the relationship between the level of response to alcohol and behavioral performance and related neural activation patterns. Based on our prior study with adolescents (Tapert et al., 2004), we hypothesized that a low level of response to alcohol would be associated with increased neural activation in dorsolateral prefrontal regions during placebo conditions. Based on prior work on the level of response to alcohol (e.g., Schuckit, 1998; Schuckit et al., 2005), we hypothesized little change in activation following a moderate dose of alcohol for low-level responders.
METHODS
Participants
Ten healthy, nonsmoking individuals (4 females, 6 males), aged 19 to 29 years (mean 23.2 ± 0.9 SD years) and unfamiliar to MRI, were studied, using methods approved by the UCSD Institutional Review Board and with written informed consent. Participants did not have medical or psychiatric disorders as determined by a medical history and clinical interview based on the Semi-Structured Assessment for the Genetics of Alcoholism (SSAGA; Hesselbrock et al., 1999) conducted by a physician (M.A.S or M.P.P). All participants denied a history of drug or alcohol dependence or regular use of prescription medications other than oral contraceptives and demonstrated a negative urine screen for illicit drugs. Two additional subjects participated in this study, but data were discarded due to excess movement during scanning (n = 1) or equipment failure (n = 1).
Procedures
At the beginning of the first session, individuals completed several questionnaires concerning medical, psychiatric, and substance use histories. At the beginning of both sessions, participants were administered the Spielberger State Trait Anxiety scale (Spielberger et al., 1970) and visual analog scale items rating subjective levels of anxiety, and, for females, a nonpregnant status was confirmed by a urine pregnancy test. A Breathalyzer (Intoximeter, St. Louis, MO) reading of 0.000 established a zero breath alcohol concentration (BrAC), and participants were trained on the use of the Subjective High Assessment Scale (SHAS; Schuckit et al., 1997) and cognitive task protocol.
In a random order, participants were administered either ethanol or placebo for session 1 and the other beverage at session 2. Based on doses used in prior level of response studies (Schuckit and Smith, 1996), the active beverage contained ethanol mixed with caffeine-free diet soda using 0.75 mL/kg laboratory-grade ethanol for males or 0.68 mL/kg for females to produce comparable BACs (Breslin et al., 1997). The placebo beverage contained a similar amount of the soda in a closed container that helped disguise the taste (Mendelson, 1984), with the liquid in both sessions consumed over 8 minutes. Breath alcohol concentration and SHAS ratings were recorded at 15 and 27 minutes after drinking started, and at 30 minutes subjects entered the scanner and FMRI brain imaging began.
Data were collected in a 3T GE CXK4 imager using an 8-channel head array coil. Each 60-minute scan session began with a scout scan, a sagittally acquired spoiled gradient recalled (SPGR) high-resolution anatomical sequence (25-cm field of view; 256 × 256 matrix; 172 slices each 1.0 mm thick covering the whole brain; 20-ms repetition time; 4.8-ms echo time). The task was administered during acquisition of T2*-weighted echo-planar imaging (EPI) (3.43 × 3.43 × 2.6-mm voxels with a 1.4-mm gap, 2,000-ms repetition time, 32-ms echo time, 90° flip angle, 30 axial slices covering the whole brain). The EPI parameters were chosen to minimize susceptibility artifacts in mesial temporal and orbitofrontal cortices.
Participants were administered an event-related visual working memory task during FMRI acquisition, 65 minutes after drinking started. Luck and Vogel (1997) developed an experimental paradigm derived from a previously described memory task that parametrically manipulated working memory load to estimate visual working memory capacity. The structure of a single trial consisted of a sample array of 2, 4, or 6 colored dots briefly presented at random locations on the computer screen against a gray background. After a short delay, a test array of 2, 4, or 6 colored dots was presented at the same random locations, the colors of which were either the same or a dot differed by selecting a new color at random. Because prior research showed that 3 to 4 different items can be held simultaneously in visual working memory (Luck and Vogel, 1997), this task used arrays of 2, 4, and 6 colored dots as low (infracapacity), mid, and high (supracapacity) loads. In sum, each 4,000-ms trial consisted of: (1) a 100-ms sample dot array presented 400-ms into the trial; (2) a 1,000-ms delay period; (3) 2,000-ms presentation of the test dot array during which the subject made a button press response; and (4) a 500-ms time out. In half of the trials, the sample and test dot arrays differed by the color of 1 dot only, while in the other 50% of trials, the 2 arrays were identical. Locations of dots were always identical. On each trial, participants responded by pressing 1 of 2 buttons during the test dot array presentation to indicate whether the 2 arrays were the same or different. Each subject completed 30 trials of each trial type (2, 4, and 6 dots), which were presented in pseudorandom order, and 69 null trials of 2,000 ms each were interspersed pseudorandomly to provide an optimized fast-event related sequence. Total task time was 8 minutes and 32 seconds.
In the scanner, the SHAS that had been given as a paper and pencil test before imaging was administered verbally at 60 minutes (i.e., 30 minutes after entry to the scanner) and 90 minutes after beverage consumption started. After imaging, participants exited the scanner and were given BrAC and SHAS assessments every 30 minutes until BrAC was <0.01 g/dL. BrAC values at 27 minutes averaged about 0.70 g/dL (see Fig. 1), and the 2 groups did not differ on estimated peak BrAC (mean 0.06 ± 0.02 SD for low-level responders and mean 0.08 ± 0.04 SD for high-level responders; t(8) = 1.17, p = 0.27).
Fig. 1.
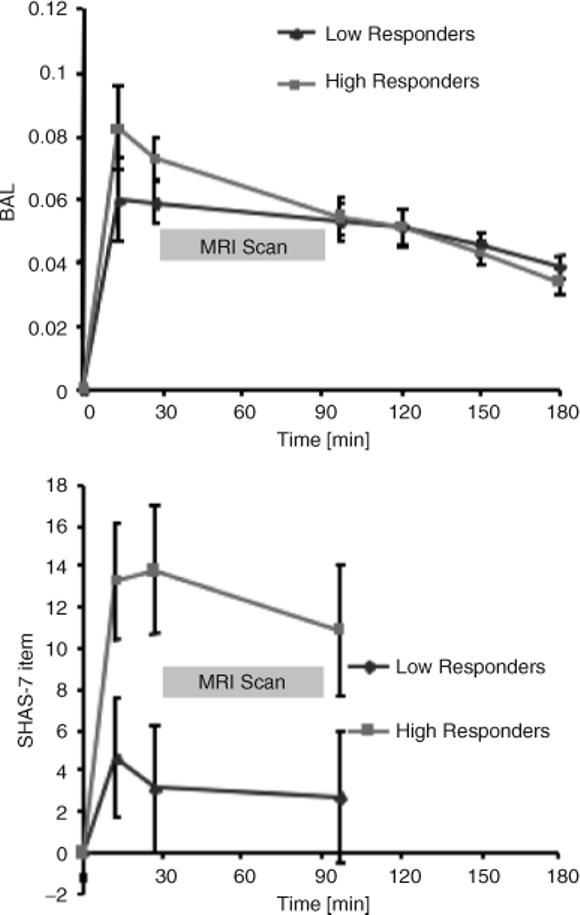
Breath alcohol concentration at 15, 27, 90, 120, 150, and 180 minutes during the 3-hour follow-up period (top) for low and high responders. Average Subjective High Assessment Scale (SHAS) scores for low and high responders (bottom). Error bars indicate standard error of the mean.
Data Processing and Analysis
All structural and functional image processing was done with the Analysis of Functional Neuroimages software package (AFNI) (Cox, 1996). Echo-planar imaging intensity images were coregistered to the 128th image using a 3D-coregistration algorithm, and 3 motion parameters (droll, dpitch, dyaw) from each subject's time series were used as nuisance regressors to account for motion artifacts. The 3 orthogonal regressors of interest (2-, 4-, and 6-dot visual working memory loads) were convolved with a modified γ variate function to account for the delay and dispersion relating presumed neural activation to hemodynamic changes measured by the BOLD response (Boynton et al., 1996). Percent signal change data were calculated as the regressor height divided by the baseline coefficient of the model. The AFNI program 3dDeconvolve calculated the estimated voxel-wise response amplitude, and a Gaussian filter (FWHM 6 mm) was applied to voxelwise percent signal change data to account for individual anatomical variations. The smoothed voxelwise percent signal change data (representing the signal contrast between echo planar image intensity during the visual working memory task and null trials) were entered into a mixed-model ANOVA, with working memory load (2, 4, and 6 dots) and dose (alcohol and placebo) as fixed within-subject factors and subject as a random factor. Analyses concerning level of response to alcohol added the between-subjects factor of level of response group, based on median split of SHAS assessment at 27 minutes. Thus, voxelwise image data yielding percent signal change contrast and corresponding F statistics for each factor were created. A threshold adjustment method based on Monte-Carlo simulations guarded against identifying false-positive areas of activation (Forman et al., 1995), and labels for brain activation foci were confirmed using the Talairach Daemon software (Lancaster et al., 2000). Based on these simulations, it was determined that a voxelwise a priori probability of 0.05 would result in a corrected clusterwise activation probability of 0.05 if a minimum volume of 1,000 μL and a connectivity radius of 4.0 mm was considered.
All behavioral analyses were carried out with SPSS 10.0 (Chicago, IL). To develop 2 groups for comparison, a median split (SHAS median = 4.85) was performed to classify participants as having a low level of response (n = 5; mean 3.51 ± 0.98 SD) versus a high level of response (n = 5; mean 10.57 ± 3.56 SD) to alcohol based on SHAS responses 27 minutes after alcohol administration, just before entering the FMRI scanner (overall mean 7.04 ± 4.46 SD). These values are comparable with previous studies on level of response to similar doses of alcohol using the SHAS, with low-level responders here falling toward the lower end of previously published ranges (e.g., Eng et al., 2005; Schuckit and Smith, 1997; Schuckit et al., 2000). A repeated-measures multivariate ANOVA, with condition ( placebo or alcohol) and working memory load (2-, 4-, or 6-dot) as within-subjects factors, analyzed the behavioral measures and neural activation patterns in areas that showed a significant condition by working memory load interaction.
RESULTS
Participant Characteristics
The median split groups of low responders and high responders did not differ in age (low responders, mean 24.8 ± 2.7 SD; high responders, mean 21.6 ± 1.7 SD; t(8) = 2.2, p = 0.06) or weight (low responders, mean 143 ± 14.6 SD pounds; high responders, mean 149 ± 20 SD; t(8) = 0.5, p = 0.60). Moreover, groups showed similar levels of past 6-month use of alcohol (low responders, 12.6 drinks/mo; high responders, 30.8 drinks/mo; p = 0.18), cigarettes (low responders, 5.2 days; high responders, 0.6 days; p = 0.24), and marijuana (low responders, 0.0; high responders, 0.8; p = 0.25). There were no differences between groups on any items pertaining to state or trait anxiety, and levels did not appear elevated for any subject.
Subjective Effect of Alcohol
Acute alcohol administration resulted in the elimination curve shown in Fig. 1 (top). The estimated BrAC did not differ between the low responders and high responders [t(8) = 0.50, p = 0.64], and there was no significant difference in the time course of alcohol elimination [F(7, 56) = 1.90, p = 0.82]. The subjective effects of alcohol underwent a significant change over time [F(3, 24) = 12.6, p < 0.001] and were significantly different for low versus high responders [F(1, 8) = 4.1, p = 0.01]. According to the group selection procedure, the low responders showed markedly attenuated subjective feelings after alcohol (average SHAS at 7 minutes = mean 2.6 ± 2.2 SD) relative to the high responders to alcohol (average SHAS at 27 minutes = mean 9.5 ± 2.2 SD; F(1, 8) = 5.61, p = 0.04) across the testing period (Fig. 1, bottom). Groups did not differ on these measures following placebo beverage administration.
Performance Effects of Alcohol
As shown in Table 1, irrespective of the administration of placebo or alcohol, subjects demonstrated the expected (Luck, 1995) load-dependent increase in errors [F(2, 16) = 31.5, p<0.001] and took longer to respond when the working memory load was high (6 dots) versus when it was low (2 dots) [F(2, 16) = 95.27, p<0.001]. Consuming a moderate dose of alcohol did not significantly affect error rate [F(1, 8) = 1.89, p = 0.20] or response latency [F(1, 8) = 1.57, p = 0.24] or interact with working memory load error rate [F(2, 16) = 1.22, p = 0.32] or response latency [F(2, 16) = 1.07, p = 0.36]. Overall, in this small sample, alcohol did not significantly affect performance in general or high working memory load trials in particular.
Table 1.
Visual Working Memory Task Performance Measures
| Placebo |
Alcohol |
|||||||
|---|---|---|---|---|---|---|---|---|
| Low responders |
High responders |
Low responders |
High responders |
|||||
| Group | Mean | SD | Mean | SD | Mean | SD | Mean | SD |
| Error rate (%) | ||||||||
| 2 dots | 5.16 | 4.33 | 7.10 | 5.77 | 8.39 | 5.40 | 14.84 | 8.09 |
| 4 dots | 10.32 | 5.30 | 18.71 | 10.80 | 12.90 | 6.84 | 15.48 | 5.77 |
| 6 dots | *12.92 | 8.19 | 27.20 | 10.95 | *20.00 | 8.35 | 28.39 | 7.70 |
| Latency (ms) | ||||||||
| 2 dots | 2504 | 120 | 2599 | 245 | 2564 | 125 | 2604 | 154 |
| 4 dots | 2561 | 164 | 2659 | 271 | 2663 | 145 | 2700 | 108 |
| 6 dots | 2636 | 140 | 2728 | 255 | 2748 | 162 | 2752 | 135 |
p<0.05 for group. Overall performance across trial types did not differ between groups.
Effects of Alcohol on Brain Functioning
As shown in Table 2, working memory load had a significant effect in right dorsolateral prefrontal and posterior parietal cortices, areas important for processing working memory. In addition, there was a working memory load–dependent increase of task-related activation in primary and secondary visual areas (cuneus and middle occipital gyrus), such that more activation was observed when a larger number of colored dots were presented. Alcohol affected several neural substrates important for working memory processing, as shown in Fig. 2. Specifically, there was a main effect of alcohol in right and left inferior frontal gyrus activation. In these areas, activation was significantly increased independent of working memory load (Fig. 2 left panel, top). In comparison, the right inferior parietal lobule and medial frontal gyrus showed main effects for alcohol, in which signal reduction relative to baseline in the placebo condition was significantly attenuated by alcohol, so that signal differences between null trials and visual working memory trials were no longer apparent (Fig. 2 left panel, bottom).
Table 2.
Clusters of Visual Working Memory Related Activation for Alcohol Effect, Load Effect, and Their Interaction
| Volume | x | y | z | BA | Description | p (Alcohol) | p (Load) | p (Alcohol×Load) |
|---|---|---|---|---|---|---|---|---|
| Alcohol | ||||||||
| 2048 | 7r | 37a | 36s | 6 | Medial frontal gyrus | 0.002 | ||
| 1408 | 28r | 18p | 55s | 6 | Precentral gyrus | 0.002 | ||
| 1344 | 47r | 11a | 28s | 9 | Inferior frontal gyrus | 0.002 | 0.006 | |
| 1344 | 20l | 19p | 56s | 4 | Precentral gyrus | 0.003 | ||
| 1280 | 28r | 47a | 21i | 11 | Superior frontal gyrus | 0.02 | ||
| 1216 | 44l | 5a | 26s | 9 | Inferior frontal gyrus | 0.01 | ||
| 1152 | 45r | 57p | 46s | 40 | Inferior parietal lobule | 0.006 | 0.04 | |
| 1088 | 53l | 38p | 28s | 40 | Supramarginal gyrus | 0.001 | ||
| Load | ||||||||
| 8960 | 27l | 78p | 3s | 18 | Middle occipital gyrus | <0.001 | ||
| 8512 | 0 | 65p | 6s | 30 | Cuneus | <0.001 | ||
| 8192 | 31r | 70p | 27s | 19 | Superior occipital gyrus | <0.001 | ||
| 1856 | 45r | 4a | 31s | 9 | Inferior frontal gyrus | <0.001 | ||
| 1856 | 46r | 33p | 43s | 40 | Inferior parietal lobule | <0.001 | ||
| 1856 | 18l | 61p | 49s | 7 | Precuneus | <0.001 | ||
| Alcohol×Load | ||||||||
| 6080 | 31r | 2a | 20i | Amygdala/parahippocampus | <0.001 | |||
| 3456 | 30l | 3p | 22i | Amygdala/parahippocampus | 0.002 | |||
| 1856 | 35r | 26a | 36s | 9 | Middle frontal gyrus | 0.007 | 0.003 | |
| 1472 | 44r | 56p | 43s | 40 | Inferior parietal lobule | 0.05 | 0.004 | |
| 1408 | 36r | 4a | 41s | 6 | Middle frontal gyrus | 0.008 | 0.004 | |
| 1280 | 52r | 14a | 5i | 22 | Superior temporal gyrus | <0.001 | ||
| 1152 | 41l | 49a | 33s | 9 | Middle frontal gyrus | 0.003 |
Note. p Values are based on a mixed ANOVA with alcohol and load as fixed effects and subjects as random effects. Labels are based on Talairach Demon software (Lancaster et al., 2000) and coordinates refer to center of mass for volume-thresholded clusters.
Fig. 2.
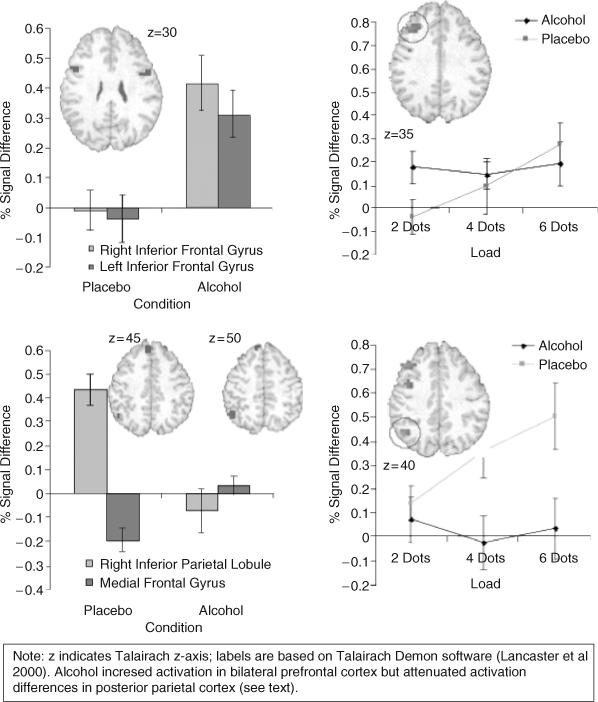
Working memory load–independant effect of alcohol (left panel) and load-dependent effects of alcohol (right panel). Error bars refer to SEM; insets are in radiological convention.
There were several areas that showed an alcohol by working memory load interaction (Fig. 2, right panel). Specifically, alcohol attenuated the activation in a load-dependent manner in right middle frontal gyrus (Fig. 2 right panel, top) and in right inferior parietal lobule (Fig. 2 right panel, bottom). In particular, although there was still significant activation in the right middle frontal gyrus during the visual working memory trials after acute administration of alcohol, this activation was no longer modulated by working memory load. Alcohol additionally attenuated activation increase as a function of working memory load in bilateral amygdala.
Difference Between Low and High Responders
There were no multivariate differences in performance between low- and high-responder groups during the placebo or alcohol conditions (see Table 1). Specifically, there were no overall differences on number of errors (placebo, F(2, 8) = 4.32, p = 0.07; alcohol, F(2, 8) = 2.65, p = 0.14) or response latency (placebo, F(2, 8) = 0.53, p = 0.48; alcohol, F(2, 8) = 2.65, p = 0.14) between groups. Moreover, there was no differential effect of alcohol on low- versus high-level responders for number of errors [F(1, 8) = 0.28, p = 0.60] or latency [F(1, 8) = 0.55, p = 0.47].
Figure 3 presents percent signal change in the right inferior frontal gyrus and inferior parietal lobule following placebo and alcohol administration for these 10 subjects. Following placebo, low-response individuals showed greater load-related BOLD response in the right inferior frontal gyrus [F(2, 16) = 3.74, p = 0.04] and right inferior parietal lobule [F(2, 16) = 3.45, p = 0.05] and a trend was found in the middle frontal gyrus [F(2, 16) = 2.67, p = 0.10]. In limbic regions following placebo, low-response individuals showed higher load-independent activations in the right amygdala and adjacent parahippocampal gyrus [F(1, 8) = 7.11, p = 0.03)] but not the left amygdala [F(1, 8) = 0.75, p = 0.41]. In contrast, following alcohol, the low-level responders showed similar BOLD response as high-level responders (inferior frontal gyrus, F(2, 16) = 0.26, p = 0.77; inferior parietal lobule, F(2, 16) = 0.02, p = 0.98; middle frontal gyrus, F(2, 16) = 0.02, p = 0.97; right amygdala, F(1, 8) = 0.30, p = 0.59; left amygdala, F(1, 8) = 0.02, p = 0.88). Therefore, the main differences in brain activation between low- and high-level responders were observed during the placebo condition and not following alcohol administration.
Fig. 3.
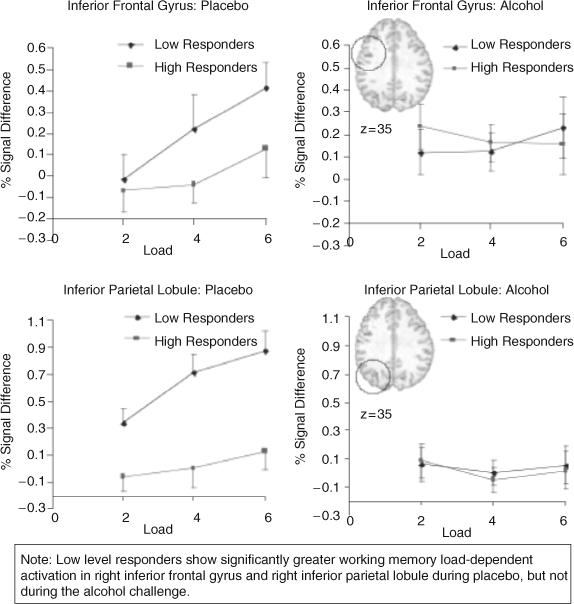
Percent signal change for each working memory load size, presented for placebo and alcohol conditions for the low- and high-level responders in prefrontal and posterior parietal cortices. Error bars refer to SEM; insets are in radiological convention.
DISCUSSION
This investigation yielded 2 main results. First, the moderate dose of alcohol administered here did not affect overall behavioral performance as measured by error rate and latency to the visual working memory task. In particular, there were no overall level of response group–related differences on task performance, although low responders performed slightly better during the high working memory load condition. Second, groups differed on working memory load–dependent brain activation during the placebo (Fig. 3) but not the alcohol condition. Following placebo, those with a low level of response to alcohol showed increased activation with increasing working memory load compared with high-level responders. Moreover, these findings confirm our previous results, indicating that low level responders exhibited increased activation in dorsolateral prefrontal cortex and other neural structures during visual working memory (Tapert et al., 2004).
Differences Between Low- and High-Level Responders
The level of response to alcohol is one of the more thoroughly studied genetically related phenotypes contributing to alcoholism risk and is thought to be predictive of later alcohol-related problems (Schuckit et al., 2004a, 2004b, 2005). Previous studies have shown that the level of response to an alcohol challenge has excellent test–retest reliability. Moreover, different measures of the level of response to alcohol in the same individuals (e.g., alcohol challenges and self-report of the effects of alcohol) correlate highly, as do different measures of the same aspect of functioning (e.g., different types of evaluations of subjective feelings). As shown in previous studies (Schuckit et al., 2004a, 2004b, 2005), this investigation confirms that the level of response to alcohol is not related to blood alcohol level (correlation between SHAS and BrAC at 27 minutes was r = 0.10, p = 0.77).
In a previous imaging investigation, we observed a larger rise in brain activation as working memory load increased for individuals who required more drinks to experience certain effects during their first few alcohol use episodes. This finding was interpreted to indicate that individuals with a low level of response to alcohol mount more neural systems resources than those with a high level of response when challenged by an executive functioning task. Our current results are consistent with this notion. Surprisingly, however, we did not find that low-level responders exhibited any attenuation of neural activation during the alcohol challenge. If one adopts the notion proposed above of a slope-related efficiency measure, one could argue that low-level responders were less efficient during the placebo condition and then became more similar to the high-level responders during the alcohol challenge. Alternatively, alcohol may attenuate differential brain activation such that group differences cannot be determined.
The finding and replication that working memory load–dependent increases in neural activation within the dorsolateral prefrontal cortex and the posterior parietal cortex under placebo conditions can be used to differentiate low- and high-level responders has several important implications. First, in contrast to behavioral and subjective reports measures, which do not differentiate these groups under alcohol-free conditions, functional neuroimaging may be useful to identify this endophenotype without the need for exposure to alcohol. This would enable one to study level of response in children or adolescents of high-risk families without the risk of alcohol administration. Second, the differences in processing efficiency between low- and high-level responders provides a new theory relating cognitive processing to the level of response to alcohol, which can be examined experimentally by challenging individuals with parametric cognitive tasks.
Alcohol Effects on Neural Activation
Consistent with the results reported by Calhoun and colleagues, we observed a load-independent increase of activation in parts of the dorsolateral prefrontal cortex and a load-independent decrease in the posterior parietal cortex. Calhoun and colleagues reported activation in response to a visual perceptual task during alcohol-free conditions in primary visual and visual association areas, frontal eye field, dorsolateral prefrontal cortex, and the supplemental motor area, while acute administration of alcohol resulted in activation increases in insula, dorsolateral prefrontal cortex, and precentral regions and decreases over the visual perception network, precuneus, cingulate, and middle frontal areas (Calhoun et al., 2004b). These findings were interpreted as alcohol producing less efficient processing (i.e., need to activate more areas to achieve the same behavioral performance) and alcohol enhancing task performance by decreasing perceptual motor involvement. The neural substrates of visual working memory have been studied extensively (see reviews Cohen et al., 1997; Courtney et al., 1998; D'Esposito et al., 1995; Smith and Jonides, 1999), and visuospatial working memory tasks typically activate dorsolateral prefrontal and parietal cortices (Goldman-Rakic, 1996; Owen, 2000; Petrides, 2000). However, there are no prior studies of working memory following acute administration of alcohol.
Acute administration of alcohol impairs a variety of cognitive functions (Bartholow et al., 2003), but it is not clear if these effects are due to global cognitive impairment or specific dysfunction of particular brain systems. Acute administration of alcohol impairs a “stop” paradigm, in which participants respond to “go” signals while “stop” signals prompt an inhibition of the response (Fillmore and Vogel-Sprott, 2000; Vogel-Sprott et al., 2001). Some evidence suggests that alcohol acutely impairs executive working memory (Peterson et al., 1990). For example, alcohol consumption limits the ability to engage in controlled, effortful processing of verbal information (Lister et al., 1987). The dose of alcohol used in the current study did not influence performance but did affect neural substrate activation patterns. Thus, the neural activation differences could be interpreted as altered computational efficiency. Specifically, if one assumes that processing efficiency inversely relates to the slope of the neural activation as a function of increased difficulty of the task (working memory load), then it could be concluded that the dose of alcohol used here increased processing efficiency because the slope was attenuated. Alternatively, alcohol may modify the extent to which individuals select information from working memory storage, and greater signal change may indicate that the task is more difficult after consuming alcohol.
Limitations
This investigation has several limitations. First, the number of subject tested was small and, thus, these results need replication with larger samples. Second, the level of response to alcohol was determined by only 1 measure, the subjective effects during the alcohol challenge. Future studies will need to employ multiple assessments to improve the definition of the endophenotype. Third, an inherent limitation of the BOLD FMRI methodology is its inability to provide an absolute measure of metabolic activity. Thus, it is conceivable that the alcohol findings are due to changes in blood flow, as ethanol may affect the baseline activation level or relate to increased oxygen extraction during the baseline condition, which could plausibly vary by level of response to alcohol. While we did not find widespread and uniform activation differences, alcohol may yet induce local differences in blood flow. Alcohol administration was associated with regionally specific BOLD FMRI changes, which are frequently reported with manipulations that affect global blood flow, such as breath holding (Kastrup et al., 1999). Future investigations will need to incorporate techniques such as arterial spin labeling to obtain measures of blood flow. Fourth, although overall performance was similar between groups, low responders had slightly lower error rates on the highest working memory load condition, leaving open the possibility of cognitive functioning differences. Fifth, we observed slightly but not significantly different BrAC values at 2 time points between groups, which, if more statistical power were available, would optimally be controlled. Finally, level of response groups reported somewhat different recent drinking patterns, which could possibly affect findings.
Summary
Activation patterns of individuals with a low level of response to alcohol differed from those with a high-level response during the placebo condition but not during the alcohol challenge. Thus, level of response may be an endophenotype that can be tested without the need for an alcohol challenge. Moreover, this investigation showed that alcohol attenuates working memory load–dependent increases in neural activation patterns in the dorsolateral prefrontal cortex and the posterior parietal cortex.
Acknowledgments
This work was supported by the VA Research Service and grants from NIH (DA13186 and DA016663 to MPP, AA13419 to SFT, and AA005526 to MAS).
REFERENCES
- Baddeley A, Chincotta D, Adlam A. Working memory and the control of action: evidence from task switching. J Exp Psychol Gen. 2001;130:641–657. [PubMed] [Google Scholar]
- Bartholow BD, Pearson M, Sher KJ, Wieman LC, Fabiani M, Gratton G. Effects of alcohol consumption and alcohol susceptibility on cognition: a psychophysiological examination. Biol Psychol. 2003;64:167–190. doi: 10.1016/s0301-0511(03)00108-x. [DOI] [PubMed] [Google Scholar]
- Boynton GM, Engel SA, Glover GH, Heeger DJ. Linear systems analysis of functional magnetic resonance imaging in human V1. J Neurosci. 1996;16:4207–4221. doi: 10.1523/JNEUROSCI.16-13-04207.1996. [DOI] [PMC free article] [PubMed] [Google Scholar]
- Breslin F, Kapur B, Sobell M, Cappell H. Gender and alcohol dosing: a procedure for producing comparable breath alcohol curves for men and women. Alcohol Clin Exp Res. 1997;21:928–930. doi: 10.1111/j.1530-0277.1997.tb03860.x. [DOI] [PubMed] [Google Scholar]
- Calhoun VD, Altschul D, McGinty V, Shih R, Scott D, Sears E, Pearlson GD. Alcohol intoxication effects on visual perception: an fMRI study. Human Brain Mapping. 2004b;21:15–26. doi: 10.1002/hbm.10145. [DOI] [PMC free article] [PubMed] [Google Scholar]
- Calhoun V, Pekar J, Pearlson G. Alcohol intoxication effects on simulated driving: exploring alcohol dose effects on brain activation using functional MRI. Neuropsychopharmacology. 2004a;29:2097–2017. doi: 10.1038/sj.npp.1300543. [DOI] [PubMed] [Google Scholar]
- Cohen JD, Perlstein WM, Braver TS, Nystrom LE, Noll DC, Jonides J, Smith EE. Temporal dynamics of brain activation during a working memory task. Nature. 1997;386:604–608. doi: 10.1038/386604a0. [DOI] [PubMed] [Google Scholar]
- Courtney SM, Petit L, Haxby JV, Ungerleider LG. The role of prefrontal cortex in working memory: examining the contents of consciousness. Phil Trans R Soc Lond B Biol Sci. 1998;353:1819–1828. doi: 10.1098/rstb.1998.0334. [DOI] [PMC free article] [PubMed] [Google Scholar]
- Cox RW. AFNI: software for analysis and visualization of functional magnetic resonance neuroimages. Comput Biomed Res. 1996;29:162–173. doi: 10.1006/cbmr.1996.0014. [DOI] [PubMed] [Google Scholar]
- D'Esposito M, Detre JA, Alsop DC, Shin RK, Atlas S, Grossman M. The neural basis of the central executive system of working memory. Nature. 1995;378:279–281. doi: 10.1038/378279a0. [DOI] [PubMed] [Google Scholar]
- deWit H, Metz J, Wagner N, Cooper M. Behavioral and subjective effects of ethanol: relationship to cerebral metabolism using PET. Alcohol Clin Exp Res. 1990;14:482–489. doi: 10.1111/j.1530-0277.1990.tb00508.x. [DOI] [PubMed] [Google Scholar]
- Eng MY, Schuckit MA, Smith TL. The level of response to alcohol in daughters of alcoholics and controls. Drug Alcohol Depend. 2005;79:83–93. doi: 10.1016/j.drugalcdep.2005.01.002. [DOI] [PubMed] [Google Scholar]
- Fillmore MT, Vogel-Sprott M. Response inhibition under alcohol: effects of cognitive and motivational conflict. J Stud Alcohol. 2000;61:239–246. doi: 10.15288/jsa.2000.61.239. [DOI] [PubMed] [Google Scholar]
- Forman SD, Cohen JD, Fitzgerald M, Eddy WF, Mintun MA, Noll DC. Improved assessment of significant activation in functional magnetic resonance imaging (fMRI): use of a cluster-size threshold. Magnet Reson Med. 1995;33:636–647. doi: 10.1002/mrm.1910330508. [DOI] [PubMed] [Google Scholar]
- Goldman-Rakic PS. The prefrontal landscape: implications of functional architecture for understanding human mentation and the central executive. Phil Trans R Soc Lond B Biol Sci. 1996;351:1445–1453. doi: 10.1098/rstb.1996.0129. [DOI] [PubMed] [Google Scholar]
- Grattan-Miscio K, Vogel-Sprott M. Effects of alcohol and performance incentives on immediate working memory. Psychopharmacology (Berlin) 2005;181:188–196. doi: 10.1007/s00213-005-2226-2. [DOI] [PubMed] [Google Scholar]
- Heath AC, Madden PA, Bucholz KK, Dinwiddie SH, Slutske WS, Bierut LJ, Rohrbaugh JW, Statham DJ, Dunne MP, Whitfield JB, Martin NG. Genetic differences in alcohol sensitivity and the inheritance of alcoholism risk. Psychol Med. 1999;29:1069–1081. doi: 10.1017/s0033291799008909. [DOI] [PubMed] [Google Scholar]
- Hesselbrock M, Easton C, Bucholz KK, Schuckit M, Hesselbrock V. A validity study of the SSAGA—a comparison with the SCAN. Addiction. 1999;94:1361–1370. doi: 10.1046/j.1360-0443.1999.94913618.x. [DOI] [PubMed] [Google Scholar]
- Hu X, Oroszi G, Chun J, Smith TL, Goldman D, Schuckit MA. An expanded evaluation of the relationship of four alleles to the level of response to alcohol and the alcoholism risk. Alcohol Clin Exp Res. 2005;29:8–16. doi: 10.1097/01.alc.0000150008.68473.62. [DOI] [PubMed] [Google Scholar]
- Ingvar M, Ghatan P, Wirsen-Meurling A, Risberg J, Von Heijne G, Stone-Elander S, Ingvar D. Alcohol activates the cerebral reward system in man. J Stud Alcohol. 1998;59:258–269. doi: 10.15288/jsa.1998.59.258. [DOI] [PubMed] [Google Scholar]
- Kastrup A, Kruger G, Glover G, Neumann-Haefelin T, Moseley M. Regional variability of cerebral blood oxygenation response to hypercapnia. NeuroImage. 1999;10:675–681. doi: 10.1006/nimg.1999.0505. [DOI] [PubMed] [Google Scholar]
- Lancaster JL, Woldorff MG, Parsons LM, Liotti M, Freitas CS, Rainey L, Kochunov PV, Nickerson D, Mikiten SA, Fox PT. Automated Talairach atlas labels for functional brain mapping. Hum Brain Mapp. 2000;10:120–131. doi: 10.1002/1097-0193(200007)10:3<120::AID-HBM30>3.0.CO;2-8. [DOI] [PMC free article] [PubMed] [Google Scholar]
- Levin JM, Ross MH, Mendelson JH, Kaufman MJ, Lange N, Maas LC, Mello NK, Cohen BM, Renshaw PF. Reduction in BOLD fMRI response to primary visual stimulation following alcohol ingestion. Psychiatry Res. 1998;82:135–146. doi: 10.1016/s0925-4927(98)00022-5. [DOI] [PubMed] [Google Scholar]
- Lister RG, Eckardt MJ, Weingartner H. Ethanol intoxication and memory. Recent developments and new directions. Rec Dev Alcohol. 1987;5:111–126. [PubMed] [Google Scholar]
- Logothetis NK, Pauls J, Augath M, Trinath T, Oeltermann A. Neurophysiological investigation of the basis of the fMRI signal. Nature. 2001;412:150–157. doi: 10.1038/35084005. [DOI] [PubMed] [Google Scholar]
- Luck SJ. Multiple mechanisms of visual-spatial attention: recent evidence from human electrophysiology. Behav Brain Res. 1995;71:113–123. doi: 10.1016/0166-4328(95)00041-0. [DOI] [PubMed] [Google Scholar]
- Luck SJ, Vogel EK. The capacity of visual working memory for features and conjunctions. Nature. 1997;390:279–281. doi: 10.1038/36846. [DOI] [PubMed] [Google Scholar]
- Lyons D, Whitlow C, Smith H, Porrino L. Brain imaging: functional consequences of ethanol in the central nervous system. Rec Dev Alcohol. 1998;14:253–284. doi: 10.1007/0-306-47148-5_11. [DOI] [PubMed] [Google Scholar]
- Martin N. Twin studies of alcohol consumption, metabolism and sensitivity. Aust Drug Alcohol Rev. 1988;7:9–12. [Google Scholar]
- Mendelson J. A new device for administering placebo alcohol. Alcohol. 1984;1:417–419. doi: 10.1016/0741-8329(84)90014-4. [DOI] [PubMed] [Google Scholar]
- Owen AM. The role of the lateral frontal cortex in mnemonic processing: the contribution of functional neuroimaging. Exp Brain Res. 2000;133:33–43. doi: 10.1007/s002210000398. [DOI] [PubMed] [Google Scholar]
- Peterson J, Rothfleisch J, Zelazo P, Pihl R. Acute alcohol intoxication and cognitive functioning. J Stud Alcohol. 1990;51:114–122. doi: 10.15288/jsa.1990.51.114. [DOI] [PubMed] [Google Scholar]
- Petrides M. The role of the mid-dorsolateral prefrontal cortex in working memory. Exp Brain Res. 2000;133:44–54. doi: 10.1007/s002210000399. [DOI] [PubMed] [Google Scholar]
- Schuckit MA. A clinical model of genetic influences in alcohol dependence. J Stud Alcohol. 1994;55:5–17. doi: 10.15288/jsa.1994.55.5. [DOI] [PubMed] [Google Scholar]
- Schuckit MA. Biological, psychological and environmental predictors of the alcoholism risk: a longitudinal study. J Stud Alcohol. 1998;59:485–494. doi: 10.15288/jsa.1998.59.485. [DOI] [PubMed] [Google Scholar]
- Schuckit MA. New findings in the genetics of alcoholism. JAMA. 1999;281:1875–1876. doi: 10.1001/jama.281.20.1875. [DOI] [PubMed] [Google Scholar]
- Schuckit MA, Edenberg HJ, Kalmijn J, Flury L, Smith TL, Reich T, Bierut L, Goate A, Foroud T. A genome-wide search for genes that relate to a low level of response to alcohol. Alcohol Clin Exp Res. 2001;25:323–329. [PubMed] [Google Scholar]
- Schuckit MA, Mazzanti C, Smith TL, Ahmed U, Radel M, Iwata N, Goldman D. Selective genotyping for the role of 5-HT2A, 5-HT2C, and GABA alpha 6 receptors and the serotonin transporter in the level of response to alcohol: a pilot study. Biol Psychiatry. 1999;45:647–651. doi: 10.1016/s0006-3223(98)00248-0. [DOI] [PubMed] [Google Scholar]
- Schuckit MA, Smith TL. An 8-year follow-up of 450 sons of alcoholic and control subjects. Arch Gen Psychiatry. 1996;53:202–210. doi: 10.1001/archpsyc.1996.01830030020005. [DOI] [PubMed] [Google Scholar]
- Schuckit MA, Smith TL. Assessing the risk for alcoholism among sons of alcoholics. J Stud Alcohol. 1997;58:141–145. doi: 10.15288/jsa.1997.58.141. [DOI] [PubMed] [Google Scholar]
- Schuckit MA, Smith TL, Anderson KG, Brown SA. Testing the level of response to alcohol: social information processing model of alcoholism risk a 20 year prospective study. Alcohol Clin Exp Res. 2004a;28:1881–1889. doi: 10.1097/01.alc.0000148111.43332.a5. [DOI] [PubMed] [Google Scholar]
- Schuckit MA, Smith TL, Danko GP, Anderson KG, Brown SA, Kuperman S, Kramer J, Hesselbrock V, Bucholz K. Evaluation of a level of response to alcohol based structural equation model in adolescents. J Stud Alcohol. 2005;66:174–184. doi: 10.15288/jsa.2005.66.174. [DOI] [PubMed] [Google Scholar]
- Schuckit MA, Smith TL, Kalmijn J. The search for genes contributing to the low level of response to alcohol: patterns of findings across studies. Alcohol Clin Exp Res. 2004b;28:1449–1458. doi: 10.1097/01.alc.0000141637.01925.f6. [DOI] [PubMed] [Google Scholar]
- Schuckit MA, Smith TL, Kalmijn J, Tsuang J, Hesselbrock V, Bucholz K. Response to alcohol in daughters of alcoholics: a pilot study and a comparison with sons of alcoholics. Alcohol Alcohol. 2000;35:242–248. doi: 10.1093/alcalc/35.3.242. [DOI] [PubMed] [Google Scholar]
- Schuckit MA, Tipp JE, Smith TL, Wiesbeck GA, Kalmijn J. The relationship between Self Rating of the Effects of alcohol and alcohol challenge results in ninety eight young men. J Stud Alcohol. 1997;58:397–404. doi: 10.15288/jsa.1997.58.397. [DOI] [PubMed] [Google Scholar]
- Smith EE, Jonides J. Storage and executive processes in the frontal lobes. Science. 1999;283:1657–1661. doi: 10.1126/science.283.5408.1657. [DOI] [PubMed] [Google Scholar]
- Spielberger CD, Gorsuch RL, Lushene . Manual for the State-Trait Anxiety Inventory. Consulting Psychologists Press; Palo Alto, CA: 1970. [Google Scholar]
- Tapert SF, Pulido C, Paulus MP, Schuckit MA, Burke C. Level of response to alcohol and brain response during visual working memory. J Stud Alcohol. 2004;65:692–700. doi: 10.15288/jsa.2004.65.692. [DOI] [PubMed] [Google Scholar]
- Vogel-Sprott M, Easdon C, Fillmore M, Finn P, Justus A. Alcohol and behavioral control: cognitive and neural mechanisms. Alcohol Clin Exp Res. 2001;25:117–121. [PubMed] [Google Scholar]
- Volavka J, Czobor P, Goodwin DW, Gabrielli WFJ, Penick EC, Mednick SA, Jensen P, Knop J. The electroencephalogram after alcohol administration in high risk men and the development of alcohol use disorders 10 years later. Arch Gen Psychiatry. 1996;53:258–263. doi: 10.1001/archpsyc.1996.01830030080012. [DOI] [PubMed] [Google Scholar]
- Volkow N, Wang G, Franceschi D, Fowler J, Thanos P, Maynard L, Gatley S, Wong C, Veech R, Kunos G, Kai L. Low doses of alcohol substantially decrease glucose metabolism in the human brain. NeuroImage. 2005 doi: 10.1016/j.neuroimage.2005.07.004. [DOI] [PubMed] [Google Scholar]
- Wang G, Volkow N, Franceschi D, Fowler J, Thanos P, Scherbaum N, Pappas N, Wong C, Hitzemann R, Felder C. Regional brain metabolism during alcohol intoxication. Alcohol Clin Exp Res. 2000;24:822–829. [PubMed] [Google Scholar]
- Weissenborn R, Duka T. Acute alcohol effects on cognitive function in social drinkers: their relationship to drinking habits. Psychopharmacology (Berlin) 2003;165:306–312. doi: 10.1007/s00213-002-1281-1. [DOI] [PubMed] [Google Scholar]