

Abstract
Synchronous activities of neuronal populations are often initiated in a pacemaker region and spread to recruit other regions. Here we examine factors that define a pacemaker site. The CA3a region acts as the pacemaker for disinhibition induced synchrony in guinea pig hippocampal slices and CA3b is a follower region. We found CA3a pyramidal cells were more excitable and fired in bursts more frequently than CA3b cells. CA3a cells had more complex dendritic arbors than CA3b cells especially in zones targetted by recurrent synapses. The product of the density of pyramidal cell axon terminals and dendritic lengths in innervated zones predicted a higher recurrent synaptic connectivity in the CA3a than in the CA3b region. We show that some CA3a cells but few CA3b cells behave as pacemaker cells by firing early during population events and by recruiting follower cells to fire. With a greater excitability and enhanced synaptic connectivity these CA3a cells may also possess initiating functions for other hippocampal ensemble activities initiated in this region.
A pacemaker cell group plays a leading role in the generation of the cardiac rhythm (Boyett et al. 2000). The heart beat depends on a process by which pacemaker cells of the sinoatrial node initiate the spread of activity by excitatory interactions to induce discharges in rhythmically active ventricular cells. The generation of some rhythmic population activities in the brain has similarities to the heart beat in that neurones of a pacemaker region generate and distribute rhythmic activities to neurones in follower regions. Thus groups in central pattern generators initiate and transmit rhythmic activities to motoneurones including those that control walking (Kiehn & Butt, 2003) and breathing (Koshiya & Smith, 1999). The septal nuclei are involved in the generation of the theta rhythm and its transmission to the hippocampus (Petsche et al. 1962; Stewart & Fox, 1990; Tóth et al. 1997). The suprachiasmatic nucleus acts as the master circadian pacemaker for mammalian brain (Aton & Herzog, 2005).
Circuits underlying focal epilepsies also possess a pacemaker organization. Population activity generated at one or more pacemaker sites can recruit distant regions to interictal rhythmicity or to a seizure (McCormick & Contreras, 2001). The CA3 region is critical in the initiation of hippocampal interictal-like activity, although some differences exist in different species and different models used (Korn et al. 1987; Colom & Saggau, 1994; Dzhala & Staley, 2003). The synchronous activity generated in disinhibited hippocampal slices (Wong & Traub, 1983) offers a simple system to study epileptiform pacemaker mechanisms. In the guinea-pig, the CA3a region usually acts as pacemaker for disinhibition induced synchrony but the cellular and synaptic correlates of this role are not clear (Wong & Traub, 1983; Colom & Saggau, 1994; Dzhala & Staley, 2003).
In this study, we first explored the location of the pacemaker region, defined as the zone where synchronous activity was initiated. Population events invariably occurred first in the CA3a subregion of guinea-pig hippocampus and propagated to the follower CA3b region. This pacemaker function of the CA3a region might depend on differences in cellular excitability or synaptic strength or connectivity. Anatomy, and multiunit and single cell physiology revealed that cellular excitability and synaptic connectivity were higher in the pacemaker CA3a zone than in the follower CA3b region. We then showed that some CA3a cells but few CA3b cells discharged early with respect to population events and could influence other neurones of the CA3 region, as judged by extracellularly recorded field potentials or action potentials. These neurones may represent a group of pacemaker cells that underly the pacemaker properties of the CA3a region. Thus differences between pyramidal cells in the CA3 region combine to shape a functional property of a simple population activity.
Methods
Slice preparation
Hippocampal slices were prepared from guinea-pigs of weight 100–200 g according to the EC Council Directive of November 24, 1986 (86/89/EEC) and INSERM guidelines. Animals were anaesthetized intraperitoneally with urethane (1000 mg kg−1) and chloral hydrate (800 mg kg−1) and perfused intracardially with a solution of 248 mm sucrose, 26 mm NaHCO3, 1 mm KCl, 10 mm MgCl2, 1 mm CaCl2, and 10 mm glucose, equilibrated with 5% CO2–95% O2 at 3–5°C. After perfusion, animals were decapitated, both hippocampi were dissected free, and transverse slices of thickness 400 μm were prepared from the middle third of the hippocampus. These were transferred to an interface recording chamber at 35–37°C, and perfused with a solution containing 124 mm NaCl, 26 mm NaHCO3, 4 mm KCl, 2 mm MgCl2, 2 mm CaCl2 and 10 mm glucose, equilibrated with 5% CO2–95% O2.
Drugs
GABAA receptor mediated signalling was suppressed by picrotoxin (50 μm), or bicuculline (20 μm). Fast EPSPs were blocked using 2,3-dihydroxy-6-nitro-7-sulfamoyl-benzo(f)quinoxaline (5 μm, NBQX) and d,l-2-amino-5-phosphonovaleric acid (100 μm, d,l-APV). Miniature synaptic events were recorded in 100 nm tetrodotoxin. Drugs were obtained from Tocris Neuramin (Bioblock, France) and Latoxan (Valence, France).
Recordings
Extracellular recording electrodes were made from tungsten wire of 50 μm diameter etched to a point. Signals were amplified 1000× and filtered with a pass-band of 0.1 Hz to 10 kHz (AM Systems, 1700, Sequim, WA, USA). Intracellular records were made with glass electrodes filled with 2 m potassium acetate (KAc) and bevelled to final resistances of 50–80 MΩ. Signals were amplified in current-clamp mode with an Axoclamp 2B amplifier (Axon Instruments, Union City, CA, USA) and high-pass filtered at 3 kHz. Intracellular records with an input resistance larger than 20 MΩ and a time constant longer than 10 ms were retained for this study. Intracellular electrodes sometimes contained biocytin (16 mg ml−1; Invitrogen, Leek, Holland) so that recorded cells could be visualized subsequently. Biocytin was injected by applying 1.5 nA depolarizing current steps of duration 200 ms at 1 Hz for at least 20 min.
Data treatment
Extracellular and intracellular signals were stored with a modified videotape recorder (Neurodata, NY, USA), digitized to a computer with a 12 bit, A–D converter (Digidata 1200A, Axon Instruments, Union City, CA, USA) and monitored during experiments with the program Axoscope (Axon Instruments). Signals derived from extracellular recordings including the frequency of all detected spikes (Cohen & Miles, 2000) were processed using routines written in LabView (Spikoscope, http://spikoscope.sourceforge.net/Spikoscope/Home.html). The start of field potentials (Fig. 1C) was defined as the time point when the average of the second derivative (n =∼60 traces) exceeded twice the maximal difference from the mean value of the 200 ms long baseline, at 400–200 ms before the event.
Figure 1.
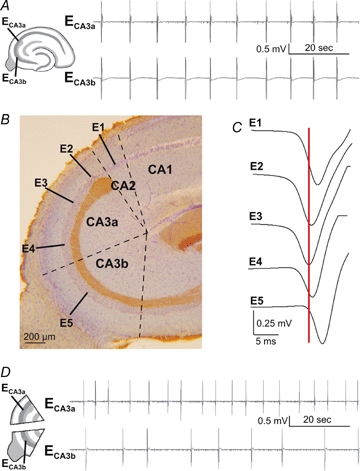
Pacemaker role of the CA3a region in disinhibition-induced synchrony A, epileptiform field potentials recorded from the CA3a, ECA3a, and CA3b, ECA3b, regions of a guinea-pig hippocampal slice exposed to 20 μm bicuculline. B, the CA3 region, with cell bodies indicated by blue Nissl staining and the mossy fibres coloured brown by immunostaining for Calbindin. The CA2, CA3a and CA3b zones are defined with dashed lines. Positions of recording electrodes E1–E5 for C. C, the initiation of field potentials at five sites in stratum pyramidale from CA2 to CA3b. Averages of 60 events show that the E3 electrode in mid-CA3a leads. D, exposure to bicuculline (20 μm) induces rhythmic activity in separated mini-slices of the CA3a and CA3b regions (both ∼800 μm along stratum pyramidale). The frequency of activity from the CA3a segment is faster than that from CA3b.
In intracellular records, membrane potential was measured if a cell did not fire with no injected current. Neuronal input resistance and time constant were measured from responses to hyperpolarizing current pulses of duration 200 ms and intensity 0.5 nA. Firing threshold was determined for the first action potential evoked by depolarizing current pulses of duration 200 ms. The voltage threshold was defined as the potential where the dV/dt exceeded 10 mV ms−1 (Fricker et al. 1999). A cell was considered to fire in bursts if it discharged stereotyped groups of at least three spikes at interval of 5–15 ms either spontaneously or in response to current injection. Measurements of factors contributing to cellular excitability, or the frequency of extracellular multiunit activity, were made over the period 5–30 min after the start of the recording.
Miniature excitatory synaptic potentials (Fig. 5) were detected using Detectivent software (Norbert Ankri, INSERM U641, Marseille, France). Cumulative probability distributions were calculated for the frequency and amplitude of miniature EPSPs in records from CA3a and CA3b pyramidal cells. Outlier cells, with the highest and the lowest frequencies were excluded in results from both regions.
Figure 5.

Differences in miniature synaptic events in CA3a and CA3b cells A–B, miniature EPSPs recorded from CA3a and CA3b cells in 0.1 μm tetrodotoxin and 10 μm bicuculline. C and D, the distribution of mEPSP amplitudes (C) and the cumulative probability plot (D) show that larger amplitude miniature synaptic events tended to be more frequent in CA3a cells (n = 7) than in CA3b cells (n = 7). E, miniature EPSP frequency was higher in CA3a cells (n = 5) than in CA3b cells (n = 5, P < 0.05, t test).
Field potentials initiated by firing of a single cell (Fig. 7), were examined by averaging at least 50 extracellular responses. An averaged event of amplitude 5 μV or greater was considered as a field potential. Changes in multiunit firing induced by a single pyramidal cell were measured from at least 50 responses as the difference in the frequency of spikes occurring in 100 ms after the start of presynaptic firing and that occurring in 100 ms before firing. An increase in frequency greater than 10 Hz was considered to reflect an interaction.
Figure 7.

Influence of single cells on population activity A, firing induced in single cells (top trace) elicited local field potentials (lower traces). B, field potentials could be associated with increased multi unit activity. In these records synaptic inhibition was blocked (20 μm bicuculline). Either excitability was reduced (4 mm Ca, 4 mm Mg) to abolish epileptiform events or the effects of single cell firing were tested between population bursts. C, the latency of the field potential in the interaction from B was about 6 ms. Average of 100 traces. D, in another interaction, pyramidal cell firing elicited unit discharges of similar form at short latency. Note that the second action potential failed occasionally. E, CA3a cells initiate increased multi unit firing (right panel) either in CA3a or in CA3b regions in a significantly more efficient manner than CA3b cells (P < 0.05, Fisher's exact test). About half of the cells in both regions are able to induce local field potential (right panel).
Staining procedures
After recording, slices containing biocytin-filled cells were fixed overnight in 4% paraformaldehyde and 15% saturated picric acid solution in 0.1 m phosphate buffer (PB). They were washed in 0.1 m PB, embedded in 4% agar, and re-sectioned at 70 μm with a Vibratome. They were immersed in 30% saccharose for 1 h and frozen three times over liquid nitrogen. Endogenous peroxidase was blocked by 1% peroxide solution for 10 min. Avidin-biotinylated horseradish peroxidase complex (ABC, 1 : 250, Vector) was applied for 1.5 h and the immunoperoxidase reaction was developed using 3,3′-diaminobenzidine tetrahydrochloride (DAB, Sigma) as a chromogen. Sections were then osmicated (0.25% OsO4 in PB, for 30 min), dehydrated in ethanol (1% uranyl acetate was added with 70% ethanol) and mounted in Durcupan (ACM, Fluka).
Immunostaining against calbindin-d28k and Nissl-staining was used to define the borders of the different hippocampal areas. Immunostaining for the potassium-chloride cotransporter, KCC2, was used to count pyramidal cell soma size and density (see Appendix). Slices of thickness 70 μm were washed in PB, treated with 1% peroxide solution for 10 min, washed in PB, and blocked with a solution containing 2% bovine serum albumin, 5% skim milk powder and 0.1% Triton X-100 for 1 h. Monoclonal mouse antibody against calbindin-d28k (1 : 3000, Swant, Bellinzona, Switzerland) or KCC2 (1 : 2000, Payne et al. 1996) and 0.1% Triton X-100 was used for 24 h. Biotinylated donkey anti-mouse secondary antibody (1 : 250, Vector) was applied for 2 h, ABC (1 : 250, Vector) for 1.5 h, and the immunoperoxidase reaction was developed with DAB.
Quantification of dendrites, terminals and connectivity estimates
Dendritic arbors and the axon terminal distributions of well-filled pyramidal cells were reconstructed in three dimensions and measured using the NeuroLucida system (MicroBrightField, Bioscience) with an Axioscope 2 microscope at magnification 40×. We completely reconstructed dendritic arbors for five representative CA3a pyramidal cells chosen from 24 well-filled neurons, five CA2 cells from 29 well-filled neurons and six from 17 CA3b cells. Cells chosen for reconstruction had a cell body located in the middle of the slice and no sign of a truncated dendritic tree. Synaptic terminal distributions were measured for 13 well-filled CA3a cell axons and nine CA3b cell axons. Together with dendritic and terminal data for each cell, we saved data on the boundaries of the CA2, CA3a and CA3b regions and of the different layers in each region. The end point of the hippocampal fissure was used as a reference point. A shrinkage correction factor of 1.33 was used in the x and y dimensions (Turner et al. 1995). Shrinkage in the z dimension was determined from measurements at 10 randomly chosen points from five random sections cut at 70 μm. A z shrinkage correction of 2.52 was determined.
A standard CA3 region was constructed to map mean dendritic lengths and terminal distributions. This template was made by matching borders of regions and layers to make an average from eight different reconstructed slices. Borders of strata followed concentric circles centred on a reference point at the end-point of the hippocampal fissure. Total dendritic length in each square of a 100 μm × 100 μm grid was measured for each CA3a or CA3b cell using the NeuroLucida system. Averaged dendritic lengths for a mean CA3a pyramidal cell and CA3b cell were obtained by placing somata in the same square of the standard CA3 region. A dendritic map was created by plotting the average dendritic length into a 100 μm × 100 μm grid placed over the template CA3 region. Each layer of each subregion containing axon terminals were matched to the template CA3 region, and the mean number of axon terminals counted in the squares of the same 100 μm × 100 μm grid. As for the dendritic map, a terminal density map was made by plotting the mean number of terminals on the standard template and grid CA3 region. Estimates for the total number of recurrent synaptic contacts made by both CA3a and CA3b pyramidal cells on a pyramidal cell in either region were made by summing connectivities calculated for each square of the 100 μm × 100 μm grid: CA3a→CA3a and CA3b→CA3a for CA3a cells; CA3a→CA3b and CA3b→CA3b for CA3b cells. Errors in connectivity estimates were derived using error propagation formulae for each square then for their sum.
Statistics
Values are given as mean ± standard deviation. For statistical analyses the following tests were used: Fisher's exact test for contingency tables, t test or one-way ANOVA if data followed a normal distribution, or the Kruskall–Wallis ANOVA on Ranks, if data did not pass the normality test (SigmaStat 3.0).
Results
We first defined the pacemaker zone for the initiation of synchronous population events in extracellular records from the stratum pyramidale of the CA3 region of disinhibited hippocampal slices. Antagonists of fast inhibition induced a rhythmic activity (n = 40) consisting of field events of duration 120–360 ms that recurred at interval 5–12 s (Fig. 1A). This activity was invariably initiated in the CA3 region near the CA1 border.
We examined the identity of the pacemaker zone (Fig. 1B) with Nissl staining for pyramidal cell somata and immunostaining for the calcium binding protein calbindin, which labels mossy fibres (Baimbridge & Miller, 1982). The CA2 region was defined by the absence of stratum lucidum (Lorente De No, 1934) and CA3a was identified by a feature specific to the guinea-pig, where the stratum lucidum expands to end in a bulb. This region extends for ∼800–1000 μm along the stratum pyramidale (Geneser-Jensen, 1972; Wong & Traub, 1983). CA3b was defined as extending for a similar distance towards the dentate. While the transition between CA2 and CA3a could be clearly determined, the boundary between CA3a and CA3b was less easy to define. Our definition resulted in two segments of similar size (Fig. 1B), with the CA3a region containing the end bulb, and the fimbria in the middle of the CA3b region. Note that in previous work (Wong & Traub, 1983; Miles et al. 1984) the region containing the end-bulb has been called the CA2 region. Since pyramidal cells in this region receive mossy fibre afferents it should be termed CA3a.
The peak of epileptiform field potentials invariably occurred first in the CA3a region (n = 40). The time difference between the peak of the field in the CA3a and CA2 regions was 1.2 ± 0.6 ms and it was 3.1 ± 0.3 ms between CA3a and CA3b (n = 7 slices; Fig. 1C). The time difference between the starting point of field potentials, defined using a threshold on the second derivative of the extracellular signal (see Methods), was 1.3 ± 1.5 ms from CA3a to CA2, and 5.6 ± 3.8 ms from CA3a to CA3b (n = 7 slices).
We asked whether the CA3a and CA3b regions could generate independent rhythmic activities by preparing separate segments of each region measuring ∼700 μm along the stratum pyramidale (Fig. 1D). Isolated CA3a (n = 9) and CA3b segments (n = 9) both generated an independent rhythmic activity consisting of field potential bursts of duration 70–140 ms. The interval between bursts was shorter for CA3a segments, 4.6 ± 1.6 s, than for those from CA3b, 21.1 ± 22.0 s. These data confirm that CA3a is the pacemaker for synchrony and show that the CA3b generates bursts independently but at a lower frequency.
Several factors might underly this pacemaker and follower organization. Cells in the pacemaker region might be more excitable, recurrent synapses which generate the synchrony might be stronger or synaptic connectivity might be higher in the CA3a region. We next examined each of these factors.
Do different cellular electrical properties contribute to the pacemaker function?
The excitability of pyramidal cells in the CA3a and CA3b regions was compared in intracellular and multiunit records (Fig. 2A and B). Most cells – 23 of 24 CA3a cells, 15 of 17 CA2 cells and 16 of 21 CA3b cells – discharged spontaneously when inhibition was functional (Fig. 2D). CA3 pyramidal cells often fire in stereotyped bursts of several spikes at short intervals (Fig. 2Ab). All CA3a cells (24/24), most (13/17) CA2 cells and most (17/21) CA3b cells discharged bursts of spikes either spontaneously or in response to current injection (Fig. 2E). The voltage firing threshold was comparable for cells from all regions (Fig. 2C) and there were no significant differences in input resistance or membrane time constant (Table 1, P > 0.05, Kruskall–Wallis ANOVA).
Figure 2.

CA3a pyramidal cells are more excitable than CA3b cells Aa and Ba, comparison of intracellular (upper) and extracellular (lower) activity of CA3a and CA3b pyramidal cells. CA3a pyramidal cells tend to fire in bursts (Ab) somewhat more than CA3b cells (Bb). Multi-unit extracellular records reveal a higher level of spontaneous spiking in the CA3a region. Ac and Bc, visualization of biocytin-filled CA3a and CA3b cells. Comparison of firing threshold and depolarizing after-potential (C), proportion of spontaneously active cells (D) and bursting cells in the CA3a and CA3b regions (E). Scale bars for C: 2 mV, 5 ms.
Table 1.
Comparison of the active and passive properties of CA2, CA3a and CA3b cells
| Control (4 mm K+) | Low K+ (2 mm K+) | |||||||||||
|---|---|---|---|---|---|---|---|---|---|---|---|---|
| n | Spontaneously active (%) | Bursting cells (%) | Firing threshold (mV) | Input resistance (MΩ) | Time constant (ms) | n | Spontaneously active (%) | Bursting cells (%) | Firing threshold (mV) | Input resistance (MΩ) | Time constant (ms) | |
| CA2 | 17 | 88% (15) | 76% (13) | −58.7 ± 3.2 | 27.9 ± 7.0 | 18.5 ± 5.6 | 6 | 50% (3) | 67% (4) | −58.3 ± 5.8 | 30.8 ± 6.7 | 23.3 ± 3.6 |
| CA3a | 24 | 96% (23) | 100% (24)* | −58.7 ± 6.5 | 28.3 ± 6.7 | 20.5 ± 4.6 | 10 | 100% (10)** | 100% (10) | −58.1 ± 2.9 | 29.3 ± 6.4 | 20.9 ± 6.3 |
| CA3b | 21 | 75% (16) | 81% (17) | −55.0 ± 4.1 | 30.8 ± 9.2 | 21.1 ± 8.7 | 10 | 60% (6) | 70% (7) | 53.4 ± 4.7 | 34.0 ± 15.0 | 22.7 ± 9.7 |
The proportion of bursting cells in the CA3a region significantly differs from CA2 or CA3b (P < 0.05 in both cases, Fisher's exact test). The Kruskall–Wallis ANOVA determined no statistically significant differences in values for firing threshold, input resistance or membrane constant of cells from different regions. Lowering K+ level from 4 mm to 2 mm did not change any of the examined features.
Significantly different from either CA3b or CA2, P < 0.05 in both cases, Fisher's exact test.
Significantly different from the CA2 region, P < 0.05, Fisher's exact test.
Differences in excitability of CA2, CA3a and CA3b pyramidal cells persisted when external K+ was reduced from 4 to 2 mm. CA3a cells were more often spontaneously active: all 10 recorded CA3a cells, but only 3 of 6 CA2 cells and 6 of 10 CA3b cells fired without stimulation (CA3a cells differ from CA2, but not from CA3b, cells P < 0.05, Fisher's exact test). CA3a cells tended to fire in bursts: all 10 CA3a cells, but only 4 of 6 CA2 cells and 7 of 10 CA3b cells fired in bursts in response to current injection (Table 1).
As an alternative, non-invasive, approach to measure cellular excitability, we made multiunit extracellular records from the pacemaker and follower regions (Fig. 2Aa and Ba). Extracellular records, which detect spikes from a population of several hundred pyramidal cells (Cohen & Miles, 2000), confirmed that activity was higher in the CA3a region. The mean frequency of detected spikes was 214 ± 64 Hz in CA3a, 138 ± 80 Hz in CA3b and 66 ± 35 Hz in CA2 (n = 8, significant at P < 0.05 with one-way ANOVA). Burst firing seemed to be more frequent in CA3a records (Figs 2Aa and b), although multiunit data cannot prove that a sequence of spikes at short interval originate from a single cell. Different cell densities might contribute to the difference in multiunit activity. An extracellular electrode may detect activity from cells located within a radius of about 80 μm (Cohen & Miles, 2000). Our calculations from data on cell densities (see Appendix) suggest that a sphere of such a radius in the stratum pyramidale might contain 230 cells in CA2, 216 cells in CA3a and 240 pyramidal cells in CA3b. Thus fewer cells generate the higher spike frequencies recorded from CA3a than CA2 or the CA3b region. Estimates for multiunit frequencies based on cell densities and firing measured from intracellular records gave spike frequencies of a similar order of magnitude to those measured extracellularly: 327 Hz in CA3a and 228 Hz in the CA3b region.
Inhibitory and excitatory synaptic transmission influence cellular excitability. To confirm that CA3a cells are intrinsically more excitable than CA2 or CA3b cells, we therefore compared the frequency of multiunit activity before and after blocking fast excitatory and inhibitory synapses (picrotoxin, 50 μm; DNQX, 10 μm; d,l-APV, 50 μm; n = 12 slices). Firing frequency was reduced in all areas, but differences persisted: the spike frequency was highest in CA3a and the lowest in the CA2 region. Mean frequencies were 39 ± 24 Hz in CA3a, 29 ± 27 Hz in CA3b and 13 ± 12 Hz in the CA2 region (n = 12, significant at P < 0.05 with one-way ANOVA).
Differences in ionic currents might account for the differences in cellular excitability. As an approach to this question, we examined waveforms of single action potentials in intracellular records. The difference between firing threshold and medium hyperpolarizing after-potential was 2.9 ± 1.5 mV in CA3a cells, 4.4 ± 2.5 mV in CA3b cells and 4.0 ± 1.7 mV in CA2 cells (Fig. 2C, CA3a is significantly different from CA3b, P < 0.05, CA3a versus CA2: P = 0.06). The difference between firing threshold and depolarizing after-potentials was smallest in CA3a cells: 0.8 ± 1.3 mV for CA3a versus 1.6 ± 2.1 mV in CA3b cells and 2.0 ± 1.7 mV in CA2 cells. Single action potentials might thus more easily initiate burst firing in CA3a cells than those of the other regions. We note, however, that these data might be biased since single action potentials were measured even for those cells which tended to fire in bursts.
Anatomical differences between pyramidal cells of the CA2, CA3a and b regions
Recurrent excitatory synapses between CA3 pyramidal cells drive disinhibition induced synchrony (Miles & Wong, 1983; Menendez De La Prida et al. 2006). Differences in the connectivity of recurrent synapses might contribute to the pacemaker role of the CA3a region. One way to measure synaptic connectivity is to count the proportion of connected cells in records from cell pairs. More recently synaptic connectivity has also been estimated from averaged anatomical data on the pre- and postsynaptic components of cortical connections (Lübke et al. 2003; Shepherd et al. 2005). We followed this approach to compare recurrent synaptic connectivity in pacemaker and follower regions by measuring dendritic arbors and axon terminal distributions of biocytin filled CA3a and CA3b pyramidal cells.
Dendritic arborizations of pyramidal cells of the CA3a pacemaker region were longer and more elaborate than those of cells from the CA2 and CA3b follower regions (Fig. 3). The maximal length of apical dendrites of CA3a pyramidal cells was 1200–1400 μm, while that CA2 and CA3b cells was 800–1000 μm. Basilar dendrites of cells from all regions extended for similar distances of 300–400 μm from the soma although CA3a cell basilar dendrites had a wider distribution than those of cells from the other two regions. Total dendritic lengths were 17 785 ± 3395 μm (n = 5) for CA2 pyramidal cells, 28 173 ± 3235 μm (n = 5), for CA3a cells and 22 055 ± 2904 μm cells (n = 6) for CA3b cells (significantly different for all regions at P < 0.05, one-way ANOVA).
Figure 3.

CA3a cells have longer and more exuberant dendrites than CA3b pyramidal cells A–C, reconstructions of dendritic branching for representative pyramidal cells from the CA2, CA3a and CA3b regions. A Sholl plot of total dendritic length against distance from the soma is shown at the right for mean values derived from dendrites of 5 CA2 cells, 5 CA3a cells and 6 CA3b cells. Apical dendrites of CA3a pyramidal cells branch within 50 μm of the soma in stratum lucidum more frequently than those of CA2 and CA3b cells (arrowhead). CA3a apical dendrites also branch more exuberantly at the stratum lucidum–radiatum border (arrow). The Sholl plots reveal a greater total dendritic length of CA3a cells than for CA3b or CA2 cells. It depends on the more profuse branching in stratum oriens and radiatum (arrow) and a greater maximal dendritic length (arrow). LM: stratum lacunosum-moleculare; Re: external stratum radiatum; Ri: internal stratum radiatum; L: stratum lucidum; P: stratum pyramidale; O: stratum oriens.
Dendritic reconstructions (Fig. 3) showed that apical dendrites of CA3a pyramidal cells often branched close to the soma (Fig. 3B, arrowhead) while the first apical dendritic branchpoint was typically more distant in CA2 and CA3b cells. The first branchpoint occurred within 50 μm of the soma in stratum lucidum for 23/24 CA3a cells but for only 8/17 CA3b cells and 9/29 CA2 pyramidal cells.
Recurrent synapses between CA3 pyramidal cells terminate on dendrites in stratum oriens and stratum radiatum (Ishizuka et al. 1990; Li et al. 1994). Sholl plots (Fig. 3A–C, right panels) illustrate the distribution of dendritic length against distance from the soma (mean values from 5 CA2 cells, 5 CA3a cells and 6 CA3b cells). They show that apical dendrites of CA3a cells branch more exuberantly at the lucidum–radiatum border than those of CA3b and CA2 pyramidal cells (Fig. 3). This branching, as well as a wider extent for basilar dendrites, underlies a greater total dendritic length for CA3a cells in layers receiving recurrent synapses – stratum radiatum and stratum oriens – than for CA2 or CA3a cells. The total dendritic length in stratum radiatum and oriens was significantly greater for CA3a cells, 23 302 ± 2178 μm, than for CA2 cells, 12 280 ± 1309 μm or for CA3b pyramidal cells, 19 300 ± 2888 μm (P < 0.05, one-way ANOVA).
Axonal arborizations of CA3a and CA3b pyramidal cells
Synaptic connectivity is the product of contacts between axon terminals of presynaptic cells and dendrites of postsynaptic cells. We measured the presynaptic component of recurrent connectivity by counting the number of terminals established by 13 well-filled CA3a cells and nine CA3b pyramidal cells. The diameter of CA3 pyramidal cell terminals was 0.8–1.5 μm and the distance between them was 3–10 μm (Fig. 4A). Most terminals were formed in stratum oriens and radiatum (Fig. 4B). The mean number of terminals established by one CA3a cell was 1197 ± 553 (n = 13) while CA3b cells formed 1325 ± 755 terminals (n = 9, not statistically different, P = 0.65, t test).
Figure 4.

Mapping theoretical recurrent connectivity in CA3a and CA3b regions A, axon collaterals and terminals of a CA3b pyramidal cell in the stratum oriens of CA3a. B, reconstruction of the dendrites (black) and terminals (blue) of this cell. LM: stratum lacunosum-moleculare; Re: external stratum radiatum; Ri: internal stratum radiatum; L: stratum lucidum; P: stratum pyramidale; O: stratum oriens. C, mean axon terminal distributions for CA3a (left, n = 13) and CA3b (right n = 9) pyramidal cells, mapped onto a standard CA3 region. Each square of the standard CA3 region represents 100 × 100 × 400 μm, where 400 μm is the slice thickness. The mean number of terminals in each volume is colour-coded. D, mean dendritic length of CA3a (left, n = 5) and CA3b (right, n = 6) pyramidal cells, colour-coded and plotted onto the standard CA3 region. The soma of each reconstructed pyramidal cell was displaced to the same site. E, estimate of the number of terminals, from both CA3a and CA3b cells, that could contact dendrites of a single CA3a (left) or CA3b (right) pyramidal cell.
In the intact hippocampus, CA3 pyramidal cell axons project for distances of several millimetres (Ishizuka et al. 1990; Li et al. 1994). Our data from cells filled in slices, reveal consistent differences in local terminal distributions (Fig. 4C). On average, 18% of CA3a cell axon terminals were made in stratum radiatum and 68% in stratum oriens (n = 15 568 boutons derived from 13 cells). In contrast 36% of CA3b cell axon terminals were made in radiatum and 59% in oriens (n = 14 206 boutons derived from 9 cells). CA3a cells were more likely to synapse with other CA3a cells than with CA3b cells – 72% of CA3a cell terminals were made in the CA3a region and 28% in CA3b. Of CA3b axon terminals, 59% were located in CA3b and 41% in CA3a. Thus self connectivity is higher in the CA3a region, and it is most often mediated by synapses in stratum oriens.
Estimates of recurrent synaptic connectivity in the CA3a and CA3b regions
With these data on dendritic length and synaptic terminal distributions, we could estimate recurrent synaptic connectivity in the pacemaker and follower regions (Lübke et al. 2003; Shepherd et al. 2005). We compared self-connectivity, within the CA3a or CA3b regions, and crossed connectivity between the regions. Terminals and dendrites of filled cells were mapped onto a standard version of the CA3 region divided into volumes of 100 × 100 × 400 μm (Fig. 4C and D) with 400 μm corresponding to the slice thickness. As described in Methods, data from each slice were deformed in the x and y dimensions to conform to the standard CA3 region.
Figure 4C shows a map of the mean distribution of terminals established by CA3a (n = 13) and CA3b cells (n = 9). It suggests that a local maximum exists in stratum oriens near the soma of the cell and that terminals established by CA3b cells have a somewhat higher density in both radiatum and oriens than those made by CA3a cells. Figure 4D shows the dendritic map which plots the mean length of CA3a and CA3b dendrites in each volume of the standard CA3 region. It reveals longer dendritic lengths for CA3a cells with a similar horizontal extent for apical dendrites and a larger extent for basal dendrites of CA3a than CA3b cells.
Self and crossed connectivity for recurrent synapses between the CA3a and CA3b regions was estimated (Lübke et al. 2003; Shepherd et al. 2005) by multiplying volume values from the terminal map and the dendritic map (Fig. 4E). Dendrites were assumed to be able to receive a synapse from any terminal within a cylindrical space of diameter 3 μm. A terminal was assumed to be capable of forming a synapse with any dendrite within a sphere of radius 1 μm (see for the CA3 to CA1 pyramidal cell connection Shepherd & Harris (1998). Corrections were made for tissue shrinkage and for the different densities of CA3a and CA3b pyramidal cell somata (see Appendix for density estimation). We assumed that 10% of pyramidal cell terminals contact GABAergic cells (Gulyás et al. 1993; Sík et al. 1993; Wittner et al. 2006) and that 25% of closely apposed terminals and dendrites do not establish a synaptic contact (Sík et al. 1993; Wittner et al. 2006).
This calculation based on dendritic lengths and bouton distributions gave a probability of 0.109 for a recurrent contact between CA3a cells and of 0.045 for a CA3a to CA3b connection. Reciprocally, the probability of a contact between CA3b cells was 0.113 and CA3b to CA3a connections occurred with probability 0.109. Summing connectivities suggests that a single CA3a cell, in a slice, receives 649 ± 52 terminals originating from CA3a and CA3b cells while a CA3b pyramidal cell receives 491 ± 30 terminals from both sources.
The prediction that CA3a pyramidal cells are more heavily innervated by recurrent synapses than CA3b cells was tested physiologically by comparing miniature excitatory synaptic events in these two cell groups. Miniature excitatory events were recorded (Fig. 5A and B) in the presence of tetrodotoxin (100 nm) to suppress action potentials and bicuculline (10 μm) to block fast IPSPs. The frequency of miniature events was significantly higher in CA3a pyramidal cells (5.1 ± 1.7 s−1; n = 5) than in CA3b pyramidal cells (2.7 ± 0.5 s−1; n = 5; P < 0.05, t test, Fig. 5D). Comparison of amplitude distributions suggested that larger miniature excitatory events occurred more often in CA3a cells (Fig. 5C). Thus CA3a cells appear to receive more excitatory synaptic inputs than CA3b cells. We note that the inputs include all sources of synaptic excitation terminating on CA3 cells. While our data (Fig. 4) suggest that a CA3 pyramidal cell may receive several hundred recurrent terminals, it also receives a few dozen mossy fibre terminals (Amaral et al. 1990).
Cellular basis for the pacemaker role of the CA3a region
These data suggest CA3a pyramidal cells are more excitable and receive more recurrent synapses than CA3b cells. How do these factors ensure the CA3a pacemaker function? Pacemaker cells must not only fire early in a population burst but also recruit follower cells to fire. We tested the first condition in multiunit records to compare the timing of firing in the CA3a and CA3b during a population burst (Fig. 6A). They showed that firing in the CA3a region, together with a slow field potential, consistently preceded population bursts by 50–120 ms while the onset of extracellular spikes in CA3b always occurred later (Menendez de la Prida et al. 2006).
Figure 6.

The CA3a region possesses more pacemaker cells A, five sequential multi unit records show population events are preceded by more spikes in the CA3a region (top) than in CA3b (bottom). The sixth trace for CA3a and CA3b is an averaged field potential showing a ramp deflection that emerges first in CA3a. All records made in 10 μm bicuculline. B–D, distinct patterns of single cell activity before spontaneously occurring epileptiform events. Intracellular record (top trace), extracellular field (bottom trace) and raster plots of spike timing for 12 sequential events (middle). In strong pacemaker cells (B) firing occurred more than 20 ms before the population field potential both at rest (spontaneous) and from potentials of −70 to −80 mV (hyperpolarized). In weak pacemaker cells (C) firing preceded the local field only at rest. In follower cells firing never preceded the local field. Spike timing was measured from more than 50 events at both potentials. E, more pacemaker cells were recorded from the CA3a region and more follower cells from the CA3b region. Strong pacemaker cells were only observed in CA3a.
We next compared the timing of firing by individual CA3a and CA3b pyramidal cells during population bursting (Fig. 6B–D). The onset of firing was determined with respect to a time point at 20 ms before the peak of the local field potential. This let us identify cells that fired early and so might fulfil a pacemaker function. The timing of firing in recorded cells was measured over at least 50 spontaneous population events with no injected current and also at hyperpolarized potentials in the range −70 to −80 mV. Of 27 CA3a cells examined, 11 were strong pacemakers that fired before population bursts both at rest and when hyperpolarized, nine were weak pacemakers that fired early only at resting potential and seven were follower cells that never discharged before the field potential (Fig. 6B–D). In contrast, no CA3b cells fired before population bursts from hyperpolarized potentials, 10 of 26 cells tested were weak pacemakers and 16 CA3b cells were follower cells that never fired before population bursts. The raster plots of Fig. 6B–D, show how cell firing varied during successive events. Of the nine CA3a pyramidal cells that discharged early even when hyperpolarized, five discharged before each event while the others fired before 7–37% of population events. These data suggest that some but not all CA3a cells contribute to the pacemaker role of this region.
Firing early during a population event is not enough for a cell to function as a pacemaker. Pacemaker cells must also recruit other neurones to fire (Fig. 7). We examined this point by comparing the efficacy of single cells to induce multiunit firing in extracellular records from the CA3a and CA3b regions. Responses induced by burst firing in single CA3a or CA3b cells were examined with synaptic inhibition suppressed. In some experiments epileptiform burst firing was abolished by reducing K+ (1 mm) or increasing Ca2+ and Mg2+ (3 and 3 mm), while in other experiments the effects of single cells were tested between population events. Firing of single CA3a or CA3b pyramidal cells induced several types of response. (1) Field potentials with amplitudes of 5–30 μV, rise times of 10–30 ms and latencies of 5–25 ms (Fig. 7A and C). (2) Multi-unit activity of onset latency 10–50 ms, usually associated with a field potential (Fig. 7B). The timing, frequency and duration of multiunit activity varied between trials. (3) Extracellular spikes of similar shape and low temporal variability, initiated with latencies of 3–8 ms (Fig. 7D). These units may correspond to local GABAergic interneurons (Csicsvári et al. 1998; Cohen & Miles, 2000).
We found that field potentials (Fig. 7A and C, Table 2), were reliably initiated by 16 of 33 CA3a cells tested (48%) and by 18 of 28 CA3b cells tested (64%, Fig. 7E, not significantly different, P = 0.3, Fisher's exact test). A single cell must initiate firing in its neighbours to fulfil a pacemaker function. Multi-unit discharges in either CA3a or CA3b were initiated by 21/33 CA3a cells tested (64%) and by 9/28 CA3b cells tested (32%, Fig. 7E, significantly different, P < 0.05, Fisher's exact test). Thus, CA3a cells were more effective in initiating firing than CA3b cells. Finally we asked whether strong pacemaker cells that consistently fired before population bursts (Fig. 6, Table 2) initiated population firing more effectively than late-firing cells. Field potentials were initiated by 10/19 pacemaker cells (53%) and by 12/18 follower cells (67%) from both regions (not significantly different, Fisher's exact test, P = 0.51). Multi-unit activity was consistently initiated by 11/19 pacemaker cells (58%) from both regions, and by 9/18 follower cells (50%, not different, Fisher's exact test, P = 0.75).
Table 2.
Effect of single cell firing on the population
| Pacemaker cells | Follower cells | |||||||
|---|---|---|---|---|---|---|---|---|
| All CA3a cells (n = 33) | All cells CA3b cells (n = 28) | CA3a (n = 14) | CA3b (n = 5) | CA3a (n = 7) | CA3b (n = 11) | |||
| Field potential in CA3a and/or CA3b | 48% | 64% | 43% | 80% | 53% | 57% | 73% | 67% |
| Multi unit activity in CA3a and/or CA3b | 64%* | 32%* | 71% | 20% | 58% | 71% | 36% | 50% |
Firing of single CA3a and CA3b cells induced field potential and/or multiunit firing in CA3a and/or CA3b regions. CA3a cells are significantly more effective in inducing multiunit firing than CA3b cells (P < 0.05, Fisher's exact test). Early firing pacemaker cells induce field potential or multiunit activity in similar percentages than late firing follower cells.
P < 0.05, Fisher's exact test.
Discussion
In this work we showed that the CA3a region acts as pacemaker and the CA3b region as a follower in the generation of population bursts in disinhibited hippocampal slices from the guinea-pig. We examined several factors that might contribute to this organization for the generation of synchrony. We note that the CA3a region often, but not always, serves as a pacemaker region for synchronous activities induced in hippocampal tissue from different species and with different techniques (Schwartzkroin & Prince, 1977; Wong & Prince, 1981; Korn et al. 1987; Chamberlin et al. 1990; Colom & Saggau, 1994; Dzhala & Staley, 2003). We found that CA3a pyramidal cells of the guinea-pig are more excitable, have more complex dendritic trees and receive more excitatory synapses than those in the CA3b region. Similar features may contribute to a pacemaker organization for other population activities (Petsche et al. 1962; Koshiya & Smith, 1999; Kiehn & Butt, 2003; Aton & Herzog, 2005). In the heart too, the pacemaker role of the sino-atrial cells is assured by their higher excitability (Kodama & Boyett, 1985) and participation in a syncytium of gap-junctions which ensures that activity is transmitted to neighbouring cells (Jalife, 1984).
Events inside a pacemaker zone
The diagram of Fig. 8 shows how these physiological and anatomical factors may combine during temporally overlapping events in the pacemaker zone. Each event starts in the CA3a pacemaker region with firing of more excitable cells (Fig. 2). Not all CA3a cells can initiate and the exact cells that lead firing may differ between successive events (Fig. 6). Recurrent synapses between CA3 pyramidal cells are crucial to the synchronization process (Fig. 4). The contributions of recurrent inputs and recurrent outputs to pacemaking can be considered separately. The extended dendrites of CA3a pyramidal cells (Fig. 3) imply that they receive more recurrent inputs, and so may be recruited to the burst more efficiently. Furthermore the recurrent outputs of CA3a cells are more effective than those of CA3b cells in eliciting CA3 population firing (Fig. 7). This enhanced efficacy depends on processes involved in EPSP-spike coupling summed over all recurrent CA3 connections. Our data suggest that it may depend on the enhanced excitability of postsynaptic CA3a cells and stronger synaptic connections rather than a higher output connectivity.
Figure 8.

Diagram of factors underlying the pacemaker role This figure summarizes the properties of the pacemaker region and their role in population burst initiation in the disinhibited hippocampal slice. High intrinsic cellular excitability and recurrent synaptic input (i/p) characterize cells in the pacemaker region and may facilitate cell firing in the initiating phase. More efficient recurrent output (o/p) and EPSP-spike coupling might help recruiting other cells and other regions to the population burst.
Factors contributing to the pacemaker function of the CA3a region therefore include the enhanced excitability of some CA3a cells, their extended dendritic arborizations, a stronger recurrent input connectivity and a recurrent output connectivity that more effectively initiates firing in the CA3 population. Modelling studies might permit estimates of the relative contributions of differences in cellular properties, synaptic strength and connectivity. We consider each factor in turn.
Physiological differences between pacemaker and follower cells
CA3a pyramidal cells were more excitable and tended to discharge in bursts (Masukawa et al. 1982) more often than those in the CA3b follower region. Our data suggest the difference in cellular excitability was not due to a different voltage threshold for firing. We could not examine possible differences in resting potential since most CA3a and CA3b cells discharged in our conditions, but the amplitude of currents responsible for spontaneous firing could differ in cells of the two regions (Mitterdorfer & Bean, 2002). Differences in burst firing presumably result from differences in voltage-gated currents are involved in the generation (Wong & Prince, 1981; Azouz et al. 1996; Metz et al. 2005) or control (Yue & Yaari, 2004) of depolarizing after-potentials and burst firing by hippocampal pyramidal cells. We showed that depolarizing after-potentials in CA3a pyramidal cells were rather larger than in CA3b cells (Fig. 2) but did not explicitly examine the currents involved.
Anatomical differences between cells of pacemaker and follower regions
Our data suggest there are anatomical differences between CA3a and CA3b pyramidal cells, even while these properties seem likely to change in a graded fashion with no clear dividing line between the two regions (Ishizuka et al. 1995). A typical pyramidal cell from the middle of the pacemaker CA3a region had significantly longer dendrites with more complex branching patterns than a typical cell from the middle of the follower CA3b zone (Fig. 3). Part of the enhanced length is specific to dendritic zones that receive recurrent excitatory synapses, contributing to the higher recurrent connectivity. The early branching of CA3a pyramidal cell apical dendrites (Bartesaghi & Severi, 2002) may also provide more space for mossy fibre terminals (Fig. 3). These anatomical differences may result from genetic instructions (Ginsberg & Che, 2005), extrahippocampal connectivity (Maglóczky et al. 1994) or interactions with cell growth (Pascual et al. 2005) and extracellular matrix (Bruckner et al. 2003) molecules. Postnatal influences (Gomez-Di Cesare et al. 1997; Bartesaghi & Severi, 2002) including corticosteroid signals (Magarinos & McEwen, 1995) also clearly affect CA3 dendritic form, but there is no evidence for differential effects in the CA3a and CA3b regions. The longer, more complex dendritic tree of CA3a pyramidal cells may also contribute to their tendency to burst firing (Menendez De La Prida & Gal, 2004). Simulation studies suggest an extended cellular geometry favours decoupling between somatic and dendritic oscillators and so encourages burst firing (Mainen & Sejnowski, 1996).
Differences in synaptic strength and connectivity in pacemaker and follower regions
We compared both synaptic strength and connectivity in CA3a and CA3b regions. Synaptic strength was estimated from somatically recorded miniature EPSPs. CA3a cells tended to receive larger miniatures (Fig. 5) and their frequency was higher for CA3a than CA3b cells. If release probability is similar at excitatory synapses, this suggests CA3a cells receive more excitatory contacts than CA3b cells. However the difference cannot be attributed exclusively to EPSPs initiated at recurrent synapses, since it might also originate in part at mossy fibre terminals or perhaps perforant path inputs. The CA3a cells with early branching apical dendrites (Fig. 3B) may receive more mossy fibre inputs. Even so, a single CA3 pyramidal cell in a slice preparation probably receives more recurrent synaptic terminals – our data suggest several hundred – than mossy fibre release sites (Amaral et al. 1990).
Using a recently developed approach (Lübke et al. 2003; Shepherd et al. 2005) we estimated the recurrent connectivity within the CA3 region. Our analysis suggests CA3a cells receive more recurrent synaptic input, in a slice, than CA3b pyramidal cells (Fig. 4). This enhanced connectivity is a product of the greater dendritic length of CA3a cells and the higher density of terminals formed by CA3b cells in CA3a than that of projections of CA3a axons into CA3b. We estimate the probability of close contacts between CA3 terminals and dendrites at ∼0.1. This is not equivalent to the probability that cells are connected, since connections may comprise more than one axo-dendritic contact. Excitatory connections made by CA3 pyramidal cells with local interneurons (Gulyás et al. 1993), and CA1 pyramidal cells (Sorra & Harris, 1993; Shepherd & Harris, 1998) involve 1–3 contacts between coupled cells. With a similar number of terminals at connections with other CA3 pyramidal cells, then this estimate, 0.1, is higher than estimates from paired recordings of ∼0.05 (Miles & Wong, 1986) for the probability of a recurrent connection between two CA3 pyramidal cells. The difference might result from the existence of silent synapses (Liao et al. 1995) between CA3 pyramidal cells (Montgomery et al. 2001).
Pacemaker properties of single CA3 pyramidal cells
Finally, CA3a pyramidal cells induced multiunit firing more effectively than CA3b cells. This property probably did not depend on a numerically larger output connectivity since the mean number of terminals made by a single CA3a cell in a slice was not significantly higher than for a CA3b cell. It could depend on the enhanced excitability of postsynaptic CA3a cells which should assist EPSP-spike coupling. CA3a cell synapses tended to terminate on dendrites in stratum oriens rather than stratum radiatum which could also favour action potential discharge. Cells in the pacemaker region seem to have stronger synaptic effects on the CA3 network.
Significance
Is this finding that the CA3a region acts as the pacemaker for disinhibition induced synchrony specific to disinhibited slices from the guinea-pig or does it have a broader relevance? There are parallels between the synchrony induced by disinhibition and hippocampal sharp waves although the size of the synchronously active population is clearly larger during disinhibition. Sharp waves are also generated in CA3a (Csicsvári et al. 2000) and involve recurrent excitatory synapses. Excitable initiating cells have been implicated in the genesis of sharp waves (Buzsáki, 1989) as part of a two-stage memory process. Such cells may initiate the replay of pyramidal cell firing sequences (Wilson & McNaughton, 1994) thought to be implicated in memory processes involving the CA3 region. Thus pacemaker cells described here might autonomously initiate firing in associated CA3 pyramidal cells. Alternatively they could be activated by mossy fibre signals, which may excite CA3a especially effectively due to the early branching of their apical dendrites.
Acknowledgments
We would like to thank Kathryn Richards, Farid Hamzei-Sichani, Katalin Tóth, György Buzsáki, Liset Menendez de la Prida and Attila Gulyás for comments on the manuscript. Arndt Roth helped with the calculations on synaptic connectivity. We thank Tamás Freund and Gilles Huberfeld for encouragement and discussions. Our work was supported by INSERM, the CE, the NIH, and grants from the ANR and ACI (Ministère de la Recherche). LW was supported by a poste vert fellowship from INSERM.
Appendix
Pyramidal cell packing density and numbers in the CA3 and CA2 regions
Estimates of pyramidal cell numbers and packing density in the CA2, CA3a and CA3b regions were needed to estimate recurrent synaptic connectivity. We used the finding, in another context, that immunostaining for the K+–Cl− transporter KCC2 provides a uniform, consistent membrane staining of CA2 and CA3 pyramidal cell somata (not shown). This permitted measurements of cross-sectional somatic area for cut cells with a visible nucleus at the slice surface. Somatic area was significantly larger for CA3a pyramidal cells, 426 ± 130 μm2 (n = 395), than for CA2 cells, 372 ± 134 μm2 (n = 78), and CA3b cells, 347 ± 86 μm2 (n = 496, P < 0.01, Kruskall–Wallis ANOVA). We calculated the proportion of the stratum pyramidale occupied by cells, in effect a 2-D packing density. The CA2 region was the most densely packed with somata filling 62% of stratum pyramidale compared with 57% in CA3a, and 50% in CA3b. Values for packing density and soma diameter gave estimates of cell densities in the str. pyramidale of the different regions: 178 804 cells mm−3 in CA2, 156 409 cells mm−3 in CA3a and 191 927 cells mm−3 in CA3b. Cell densities together with estimates on the length of stratum pyramidale provided estimates on the number of cells in each region. In a 400 μm thick slice, the CA2 region of length 300 μm contains about 500 cells, the CA3a region of length 800 μm contains ∼2600 cells and the CA3b region of length 800 μm ∼3300 pyramidal cells. Combining these estimates with data on the timing of cell firing with respect to population bursts (Fig. 6), we suggest that about 1000 strong pacemaker cells are present in the CA3a region, about 2100 weak pacemaker cells in the CA3a and CA3b regions and about 2700 follower cells exist in the CA3b and CA3a regions of a 400 μm thick slice.
References
- Amaral DG, Ishizuka N, Claiborne B. Neurons, numbers and the hippocampal network. Prog Brain Res. 1990;83:1–11. doi: 10.1016/s0079-6123(08)61237-6. [DOI] [PubMed] [Google Scholar]
- Aton SJ, Herzog ED. Come together, right…now: synchronization of rhythms in a mammalian circadian clock. Neuron. 2005;48:531–534. doi: 10.1016/j.neuron.2005.11.001. [DOI] [PMC free article] [PubMed] [Google Scholar]
- Azouz R, Jensen MS, Yaari Y. Ionic basis of spike after-depolarization and burst generation in adult rat hippocampal CA1 pyramidal cells. J Physiol. 1996;492:211–223. doi: 10.1113/jphysiol.1996.sp021302. [DOI] [PMC free article] [PubMed] [Google Scholar]
- Baimbridge KG, Miller JJ. Immunohistochemical localization of calcium-binding protein in the cerebellum, hippocampal formation and olfactory bulb of the rat. Brain Res. 1982;245:223–229. doi: 10.1016/0006-8993(82)90804-6. [DOI] [PubMed] [Google Scholar]
- Bartesaghi R, Severi S. Effects of early environment on field CA3a pyramidal neuron morphology in the guinea-pig. Neuroscience. 2002;110:475–488. doi: 10.1016/s0306-4522(01)00469-9. [DOI] [PubMed] [Google Scholar]
- Boyett MR, Honjo H, Kodama I. The sinoatrial node, a heterogeneous pacemaker structure. Cardiovasc Res. 2000;47:658–687. doi: 10.1016/s0008-6363(00)00135-8. [DOI] [PubMed] [Google Scholar]
- Bruckner G, Grosche J, Hartlage-Rubsamen M, Schmidt S, Schachner M. Region and lamina-specific distribution of extracellular matrix proteoglycans, hyaluronan and tenascin-R in the mouse hippocampal formation. J Chem Neuroanat. 2003;26:37–50. doi: 10.1016/s0891-0618(03)00036-x. [DOI] [PubMed] [Google Scholar]
- Buzsáki G. Two-stage model of memory trace formation: a role for ‘noisy’ brain states. Neuroscience. 1989;31:551–570. doi: 10.1016/0306-4522(89)90423-5. [DOI] [PubMed] [Google Scholar]
- Chamberlin NL, Traub RD, Dingledine R. Role of EPSPs in initiation of spontaneous synchronized burst firing in rat hippocampal neurons bathed in high potassium. J Neurophysiol. 1990;64:1000–1008. doi: 10.1152/jn.1990.64.3.1000. [DOI] [PubMed] [Google Scholar]
- Cohen I, Miles R. Contributions of intrinsic and synaptic activities to the generation of neuronal discharges in in vitro hippocampus. J Physiol. 2000;524:485–502. doi: 10.1111/j.1469-7793.2000.00485.x. [DOI] [PMC free article] [PubMed] [Google Scholar]
- Colom LV, Saggau P. Spontaneous interictal-like activity originates in multiple areas of the CA2-CA3 region of hippocampal slices. J Neurophysiol. 1994;71:1574–1585. doi: 10.1152/jn.1994.71.4.1574. [DOI] [PubMed] [Google Scholar]
- Csicsvári J, Hirase H, Czurkó A, Buzsáki G. Reliability and state dependence of pyramidal cell-interneuron synapses in the hippocampus: an ensemble approach in the behaving rat. Neuron. 1998;21:179–189. doi: 10.1016/s0896-6273(00)80525-5. [DOI] [PubMed] [Google Scholar]
- Csicsvári J, Hirase H, Mamiya A, Buzsáki G. Ensemble patterns of hippocampal CA3-CA1 neurons during sharp wave-associated population events. Neuron. 2000;28:585–594. doi: 10.1016/s0896-6273(00)00135-5. [DOI] [PubMed] [Google Scholar]
- Dzhala VI, Staley KJ. Transition from interictal to ictal activity in limbic networks in vitro. J Neurosci. 2003;23:7873–7880. doi: 10.1523/JNEUROSCI.23-21-07873.2003. [DOI] [PMC free article] [PubMed] [Google Scholar]
- Fricker D, Verheugen JA, Miles R. Cell-attached measurements of the firing threshold of rat hippocampal neurones. J Physiol. 1999;517:791–804. doi: 10.1111/j.1469-7793.1999.0791s.x. [DOI] [PMC free article] [PubMed] [Google Scholar]
- Geneser-Jensen FA. Distribution of acetyl cholinesterase in the hippocampal region of the guinea pig. II. Subiculum and hippocampus. Z Zellforsch Mikrosk Anat. 1972;124:546–560. doi: 10.1007/BF00335257. [DOI] [PubMed] [Google Scholar]
- Ginsberg SD, Che S. Expression profile analysis within the human hippocampus: comparison of CA1 and CA3 pyramidal neurons. J Comp Neurol. 2005;487:107–118. doi: 10.1002/cne.20535. [DOI] [PubMed] [Google Scholar]
- Gomez-Di Cesare CM, Smith KL, Rice FL, Swann JW. Axonal remodeling during postnatal maturation of CA3 hippocampal pyramidal neurons. J Comp Neurol. 1997;384:165–180. [PubMed] [Google Scholar]
- Gulyás AI, Miles R, Sík A, Tóth K, Tamamaki N, Freund TF. Hippocampal pyramidal cells excite inhibitory neurons through a single release site. Nature. 1993;366:683–687. doi: 10.1038/366683a0. [DOI] [PubMed] [Google Scholar]
- Ishizuka N, Cowan WM, Amaral DG. A quantitative analysis of the dendritic organization of pyramidal cells in the rat hippocampus. J Comp Neurol. 1995;362:17–45. doi: 10.1002/cne.903620103. [DOI] [PubMed] [Google Scholar]
- Ishizuka N, Weber J, Amaral DG. Organization of intrahippocampal projections originating from CA3 pyramidal cells in the rat. J Comp Neurol. 1990;295:580–623. doi: 10.1002/cne.902950407. [DOI] [PubMed] [Google Scholar]
- Jalife J. Mutual entrainment and electrical coupling as mechanisms for synchronous firing of rabbit sino-atrial pace-maker cells. J Physiol. 1984;356:221–243. doi: 10.1113/jphysiol.1984.sp015461. [DOI] [PMC free article] [PubMed] [Google Scholar]
- Kiehn O, Butt SJ. Physiological, anatomical and genetic identification of CPG neurons in the developing mammalian spinal cord. Prog Neurobiol. 2003;70:347–361. doi: 10.1016/s0301-0082(03)00091-1. [DOI] [PubMed] [Google Scholar]
- Kodama I, Boyett MR. Regional differences in the electrical activity of the rabbit sinus node. Pflugers Arch. 1985;404:214–226. doi: 10.1007/BF00581242. [DOI] [PubMed] [Google Scholar]
- Korn SJ, Giacchino JL, Chamberlin NL, Dingledine R. Epileptiform burst activity induced by potassium in the hippocampus and its regulation by GABA-mediated inhibition. J Neurophysiol. 1987;57:325–340. doi: 10.1152/jn.1987.57.1.325. [DOI] [PubMed] [Google Scholar]
- Koshiya N, Smith JC. Neuronal pacemaker for breathing visualized in vitro. Nature. 1999;400:360–363. doi: 10.1038/22540. [DOI] [PubMed] [Google Scholar]
- Li XG, Somogyi P, Ylinen A, Buzsáki G. The hippocampal CA3 network: an in vivo intracellular labeling study. J Comp Neurol. 1994;339:181–208. doi: 10.1002/cne.903390204. [DOI] [PubMed] [Google Scholar]
- Liao D, Hessler NA, Malinow R. Activation of postsynaptically silent synapses during pairing-induced LTP in CA1 region of hippocampal slice. Nature. 1995;375:400–404. doi: 10.1038/375400a0. [DOI] [PubMed] [Google Scholar]
- Lorente De No R. Studies on the structure of the cerebral cortex – II. Continuation of the study of the ammonic system. J Psychol Neurol. 1934;46:113–177. [Google Scholar]
- Lübke J, Roth A, Feldmeyer D, Sakmann B. Morphometric analysis of the columnar innervation domain of neurons connecting layer 4 and layer 2/3 of juvenile rat barrel cortex. Cereb Cortex. 2003;13:1051–1063. doi: 10.1093/cercor/13.10.1051. [DOI] [PubMed] [Google Scholar]
- Magarinos AM, McEwen BS. Stress-induced atrophy of apical dendrites of hippocampal CA3c neurons: involvement of glucocorticoid secretion and excitatory amino acid receptors. Neuroscience. 1995;69:89–98. doi: 10.1016/0306-4522(95)00259-l. [DOI] [PubMed] [Google Scholar]
- Maglóczky Z, Acsády L, Freund TF. Principal cells are the postsynaptic targets of supramammillary afferents in the hippocampus of the rat. Hippocampus. 1994;4:322–334. doi: 10.1002/hipo.450040316. [DOI] [PubMed] [Google Scholar]
- Mainen ZF, Sejnowski TJ. Influence of dendritic structure on firing pattern in model neocortical neurons. Nature. 1996;382:363–366. doi: 10.1038/382363a0. [DOI] [PubMed] [Google Scholar]
- Masukawa LM, Benardo LS, Prince DA. Variations in electrophysiological properties of hippocampal neurons in different subfields. Brain Res. 1982;242:341–344. doi: 10.1016/0006-8993(82)90320-1. [DOI] [PubMed] [Google Scholar]
- McCormick DA, Contreras D. On the cellular and network bases of epileptic seizures. Annu Rev Physiol. 2001;63:815–846. doi: 10.1146/annurev.physiol.63.1.815. [DOI] [PubMed] [Google Scholar]
- Menendez De La Prida L, Gal B. Synaptic contributions to focal and widespread spatiotemporal dynamics in the isolated rat subiculum in vitro. J Neurosci. 2004;24:5525–5536. doi: 10.1523/JNEUROSCI.0309-04.2004. [DOI] [PMC free article] [PubMed] [Google Scholar]
- Menendez De La Prida LM, Huberfeld G, Cohen I, Miles R. Threshold behavior in the initiation of hippocampal population bursts. Neuron. 2006;49:131–142. doi: 10.1016/j.neuron.2005.10.034. [DOI] [PubMed] [Google Scholar]
- Metz AE, Jarsky T, Martina M, Spruston N. R-type calcium channels contribute to afterdepolarization and bursting in hippocampal CA1 pyramidal neurons. J Neurosci. 2005;25:5763–5773. doi: 10.1523/JNEUROSCI.0624-05.2005. [DOI] [PMC free article] [PubMed] [Google Scholar]
- Miles R, Wong RK. Single neurones can initiate synchronized population discharge in the hippocampus. Nature. 1983;306:371–373. doi: 10.1038/306371a0. [DOI] [PubMed] [Google Scholar]
- Miles R, Wong RK. Excitatory synaptic interactions between CA3 neurones in the guinea-pig hippocampus. J Physiol. 1986;373:397–418. doi: 10.1113/jphysiol.1986.sp016055. [DOI] [PMC free article] [PubMed] [Google Scholar]
- Miles R, Wong RK, Traub RD. Synchronized afterdischarges in the hippocampus: contribution of local synaptic interactions. Neuroscience. 1984;12:1179–1189. doi: 10.1016/0306-4522(84)90012-5. [DOI] [PubMed] [Google Scholar]
- Mitterdorfer J, Bean BP. Potassium currents during the action potential of hippocampal CA3 neurons. J Neurosci. 2002;22:10106–10115. doi: 10.1523/JNEUROSCI.22-23-10106.2002. [DOI] [PMC free article] [PubMed] [Google Scholar]
- Montgomery JM, Pavlidis P, Madison DV. Pair recordings reveal all-silent synaptic connections and the postsynaptic expression of long-term potentiation. Neuron. 2001;29:691–701. doi: 10.1016/s0896-6273(01)00244-6. [DOI] [PubMed] [Google Scholar]
- Pascual M, Pozas E, Soriano E. Role of class 3 semaphorins in the development and maturation of the septohippocampal pathway. Hippocampus. 2005;15:184–202. doi: 10.1002/hipo.20040. [DOI] [PubMed] [Google Scholar]
- Payne JA, Stevenson TJ, Donaldson LF. Molecular characterization of a putative K-Cl cotransporter in rat brain. A neuronal-specific isoform. J Biol Chem. 1996;271:16245–16252. doi: 10.1074/jbc.271.27.16245. [DOI] [PubMed] [Google Scholar]
- Petsche H, Stumpf C, Gogolak G. The significance of the rabbit's septum as a relay station between the midbrain and the hippocampus. I. The control of hippocampus arousal activity by the septum cells. Electroencephalogr Clin Neurophysiol. 1962;14:202–211. doi: 10.1016/0013-4694(62)90030-5. [DOI] [PubMed] [Google Scholar]
- Schwartzkroin PA, Prince DA. Penicillin-induced epileptiform activity in the hippocampal in vitro prepatation. Ann Neurol. 1977;1:463–469. doi: 10.1002/ana.410010510. [DOI] [PubMed] [Google Scholar]
- Shepherd GM, Harris KM. Three-dimensional structure and composition of CA3→CA1 axons in rat hippocampal slices: implications for presynaptic connectivity and compartmentalization. J Neurosci. 1998;18:8300–8310. doi: 10.1523/JNEUROSCI.18-20-08300.1998. [DOI] [PMC free article] [PubMed] [Google Scholar]
- Shepherd GM, Stepanyants A, Bureau I, Chklovskii D, Svoboda K. Geometric and functional organization of cortical circuits. Nat Neurosci. 2005;8:782–790. doi: 10.1038/nn1447. [DOI] [PubMed] [Google Scholar]
- Sík A, Tamamaki N, Freund TF. Complete axon arborization of a single CA3 pyramidal cell in the rat hippocampus, and its relationship with postsynaptic parvalbumin-containing interneurons. Eur J Neurosci. 1993;5:1719–1728. doi: 10.1111/j.1460-9568.1993.tb00239.x. [DOI] [PubMed] [Google Scholar]
- Sorra KE, Harris KM. Occurrence and three-dimensional structure of multiple synapses between individual radiatum axons and their target pyramidal cells in hippocampal area CA1. J Neurosci. 1993;13:3736–3748. doi: 10.1523/JNEUROSCI.13-09-03736.1993. [DOI] [PMC free article] [PubMed] [Google Scholar]
- Stewart M, Fox SE. Do septal neurons pace the hippocampal theta rhythm. Trends Neurosci. 1990;13:163–168. doi: 10.1016/0166-2236(90)90040-h. [DOI] [PubMed] [Google Scholar]
- Tóth K, Freund TF, Miles R. Disinhibition of rat hippocampal pyramidal cells by GABAergic afferents from the septum. J Physiol. 1997;500:463–474. doi: 10.1113/jphysiol.1997.sp022033. [DOI] [PMC free article] [PubMed] [Google Scholar]
- Turner DA, Li XG, Pyapali GK, Ylinen A, Buzsáki G. Morphometric and electrical properties of reconstructed hippocampal CA3 neurons recorded in vivo. J Comp Neurol. 1995;356:580–594. doi: 10.1002/cne.903560408. [DOI] [PubMed] [Google Scholar]
- Wilson MA, McNaughton BL. Reactivation of hippocampal ensemble memories during sleep. Science. 1994;265:676–679. doi: 10.1126/science.8036517. [DOI] [PubMed] [Google Scholar]
- Wittner L, Henze DA, Záborszky L, Buzsáki G. Hippocampal CA3 pyramidal cells selectively innervate aspiny interneurons. Eur J Neurosci. 2006;24:1286–1298. doi: 10.1111/j.1460-9568.2006.04992.x. [DOI] [PubMed] [Google Scholar]
- Wong RK, Prince DA. Afterpotential generation in hippocampal pyramidal cells. J Neurophysiol. 1981;45:86–97. doi: 10.1152/jn.1981.45.1.86. [DOI] [PubMed] [Google Scholar]
- Wong RK, Traub RD. Synchronized burst discharge in disinhibited hippocampal slice. I. Initiation in CA2-CA3 region. J Neurophysiol. 1983;49:442–458. doi: 10.1152/jn.1983.49.2.442. [DOI] [PubMed] [Google Scholar]
- Yue C, Yaari Y. KCNQ/M channels control spike afterdepolarization and burst generation in hippocampal neurons. J Neurosci. 2004;24:4614–4624. doi: 10.1523/JNEUROSCI.0765-04.2004. [DOI] [PMC free article] [PubMed] [Google Scholar]