Abstract
A variety of intracellular signaling pathways can modulate the properties of voltage-gated ion channels. Some of them are well characterized. However, the diffusible second messenger mediating suppression of M current via G protein-coupled receptors has not been identified. In superior cervical ganglion neurons, we find that the signaling pathways underlying M current inhibition by B2 bradykinin and M1 muscarinic receptors respond very differently to inhibitors. The bradykinin pathway was suppressed by the phospholipase C inhibitor U-73122, by blocking the IP3 receptor with pentosan polysulfate or heparin, and by buffering intracellular calcium, and it was occluded by allowing IP3 to diffuse into the cytoplasm via a patch pipette. By contrast, the muscarinic pathway was not disrupted by any of these treatments. The addition of bradykinin was accompanied by a [Ca2+]i rise with a similar onset and time to peak as the inhibition of M current. The M current inhibition and the rise of [Ca2+]i were blocked by depletion of Ca2+ internal stores by thapsigargin. We conclude that bradykinin receptors inhibit M current of sympathetic neurons by activating phospholipase C and releasing Ca2+ from IP3-sensitive Ca2+ stores, whereas muscarinic receptors do not use the phospholipase C pathway to inhibit M current channels.
Modulation of ion channels by G protein-coupled receptors is a major mechanism for the regulation of neuronal excitability (1). Many G protein-coupled receptors, including M1 muscarinic and various peptide receptors, inhibit both the M-type K+ current and the N-type Ca2+ current via diffusible second messengers (2–4). Because these receptors typically are linked to phospholipase C (PLC) and the hydrolysis of phosphoinositides (5), it might be supposed that elevations of diacylglycerol, inositol 1,4,5-trisphosphate (IP3), or [Ca2+]i underlie the modulation of the M channel and the N-type Ca2+ channel. However, the diffusible messenger(s) for muscarinic action does not appear to be one of those generated by PLC. Evidence for this conclusion in various cells includes: (i) pharmacological activation or block of protein kinase C does not occlude modulation of M current (6, 7); (ii) injection of IP3 does not always result in suppression of M current (8, 9); and (iii) muscarinic modulation of M current is not accompanied by a measurable [Ca2+]i rise in rat sympathetic neurons and occurs even when the cytoplasm contains 20 mM of a Ca2+ buffer (6, 10). Therefore, none of these messengers has been identified as mediating the muscarinic effects (11, 12). Similar conclusions are reached for the modulation of M current by peptides in frog and rat sympathetic neurons (3, 4, 13–15).
Bradykinin (BK) recently has been found to depress M current in superior cervical sympathetic ganglion (SCG) neurons by acting on B2 bradykinin receptors (16). At a supracellular level, it increases norepinephrine outflow from electrically stimulated SCG cultures (17) and raises cardiac contractility when sympathetic neurons are present (18). The suppression of M current in SCG neurons by agonists acting on B2 bradykinin or M1 muscarinic receptors is reduced by injection of antibodies against the GTP-binding protein Gαq/11 (16, 19). Because the search for the second messenger underlying M current inhibition has emphasized the muscarinic pathway, little is known about the signaling pathway activated by B2 bradykinin receptors in SCG neurons. In many cell types, BK receptors are strongly linked to the Gαq/PLC pathway (5, 20), so here we ask whether BK uses the PLC pathway to inhibit M channels. The same experiments allow us to reinvestigate the role of the PLC pathway in muscarinic modulation of M current. We find that the BK pathway, but not the muscarinic one, uses Ca2+ release from IP3-sensitive intracellular stores to suppress M current, and therefore we identify the physiological intracellular message for one form of M current modulation in an adult neuron.
METHODS
Cell Culture.
Experiments were done on SCG neurons taken from 5- to 6-week-old male rats and cultured for 1 day (Sprague–Dawley). Rats were quickly anesthetized with CO2 and decapitated. Neurons were dissociated and suspended twice in DMEM supplemented with 10% heat-inactivated horse serum. Cells were plated on 4 × 4-mm glass coverslips (coated with poly-l-lysine) and incubated at 37°C (5% CO2). Fresh culture medium containing nerve growth factor (50 ng/ml) was added to the cells 2 hr after plating.
Current Recording and Perfusion.
Whole-cell recording (21) was done by using patch pipettes with resistances of 1–3 MΩ. The series resistance of 3–7 MΩ was sometimes partially compensated. Voltage command steps were generated and M current records were sampled at 5 kHz by computer. The M current was activated by holding the membrane potential at −25 mV and deactivated by command pulses (500 ms) from −25 mV to −60 mV every 4 s. Membrane voltages were corrected for a −2 mV [0.1 mM 1,2-bis(O-aminophenoxy)ethane-N,N,N′,N′-tetraacetic acid (BAPTA)] or −4 mV (20 mM BAPTA) junction potential. The M current amplitude was measured from deactivation current records as the difference between the average of a 10-ms segment, taken 20–30 ms into the hyperpolarizing step and the average during the last 50 ms of that step. The M current amplitudes from the last five records were averaged for the control and test conditions, respectively, and percent inhibition of M current was calculated as [1 − (current test/current control)] × 100%.
For experiments requiring cell dialysis with a test molecule from a patch pipette, we waited for dialysis to occur before beginning the recordings. The waiting period was calculated from the molecular weight of the substance, the capacitance of the cell, and the series resistance of the pipette (22). To avoid systematic bias, control and experimental measurements were alternated within each set of experiments. Statistics are given as mean ± SEM, and sample means were compared by a paired Student’s t test.
SCG cells were superfused at 2.8 ml/min in a 50-μl recording chamber with the appropriate external solution. Solution changes were accomplished in <10 s. BK (50–100 nM) was applied at 80–100 s to attain its maximal effect, but it was applied only once per cell because recovery was very slow. In some experiments concerning the kinetics of BK-induced M current inhibition and in all [Ca2+]i measurements, we used a fast solution exchange (within 1 s) system (2). Experiments were done at 25°C.
Ca2+ Microphotometry.
[Ca2+]i in a single cell was ratiometrically recorded with the Ca2+-sensitive dye indo-1. The excitation wavelength was 365 nm (100-W mercury lamp), and fluorescence signals were recorded at 405 and 500 nm, using two photon-counting photomultiplier tubes. For simultaneous recording of [Ca2+]i and M current, SCG neurons were loaded with 100 μM indo-1-free acid for 3 min from the whole-cell pipette. When only [Ca2+]i was recorded, the neurons were incubated instead for 20 min with 1 μM membrane-permeant indo-1 AM. Fluorescence signals were corrected for background. Ratios were converted to [Ca2+]i by using the equation [Ca2+]i = K* (R − Rmin)/(Rmax − R), where R is the 405/500-nm fluorescence ratio and Rmin and Rmax are the ratios of Ca2+-free and Ca2+-bound dye, respectively (23). For neurons loaded with indo-1 AM, Rmin, Rmax, and K* were measured on cells perfused with NaCl-based external solution containing ionomycin (5 μM) plus 50 mM EGTA or 20 mM Ca2+, or 20 mM Ca2+ and 15 mM EGTA. The calculated free [Ca2+] in the 20 mM EGTA and 15 mM CaCl2 solution was 251 nM. Values for Rmin, Rmax, and K* were 0.45, 2.58, and 1050 nM, respectively (n = 13–14 cells for each measurements). For cells loaded with indo-1 via the pipette, Rmin, Rmax, and K* were measured on cells perfused with KCl-based internal solution containing 50 mM EGTA or 20 mM Ca2+, or 20 mM Ca2+ and 15 mM EGTA. Their values were 0.41, 4.95, and 2,030 nM, respectively (n = 4–5 cells for each).
Solutions and Materials.
Neurons were superfused with an external Ringer’s solution having the following composition: 160 mM NaCl/2.5 mM KCl/5 mM CaCl2/1 mM MgCl2/10 mM Hepes/8 mM glucose/0.5 μM tetrodotoxin. The pH was adjusted to 7.4 with NaOH. In some experiments we used a 0 Ca2+ Ringer’s solution (no Ca added, 6 MgCl2, 100 μM EGTA). The composition of the standard internal solution was 175 mM KCl/5 mM MgCl2/5 mM Hepes/0.1 mM BAPTA/3 mM K2ATP/0.1 mM NaGTP/0.08 mM leupeptin, pH 7.4. High BAPTA internal solution was composed of 115 mM KCl/5 mM MgCl2/5 mM Hepes/20 mM K4-BAPTA/3 mM K2ATP/0.1 mM NaGTP/0.08 mM leupeptin, pH 7.4.
Reagents were obtained as follows: BK (Peninsula Laboratories); oxotremorine methiodide (oxo-M), d-myo-inositol-1,4,5-trisphosphate (Na salt), U-73122, and U-73343 (Research Biochemicals); Hepes, pentosan polysulfate (PPS), heparin, and Na-GTP (Sigma); BAPTA, indo-1, and indo-1 AM (Molecular Probes); leupeptin and K2-ATP (Boehringer Mannheim); DMEM, nerve growth factor (2.5 S), and heat-inactivated horse serum (GIBCO/BRL); and phorbol 12-myristate 13-acetate and thapsigargin (Calbiochem). Stock solutions of PPS (5 mg/ml) and heparin (10 mg/ml) were prepared in water. A 1-mM stock solution of IP3 was prepared by using the 0.1-mM BAPTA internal solution. Thapsigargin (5 mM), U-73122 (2 mM), and U-73343 (2 mM) were dissolved in dimethyl sulfoxide. Stock solutions were aliquoted and stored at −20°C.
RESULTS
Buffering Intracellular Calcium Suppresses Modulation of M Current by BK.
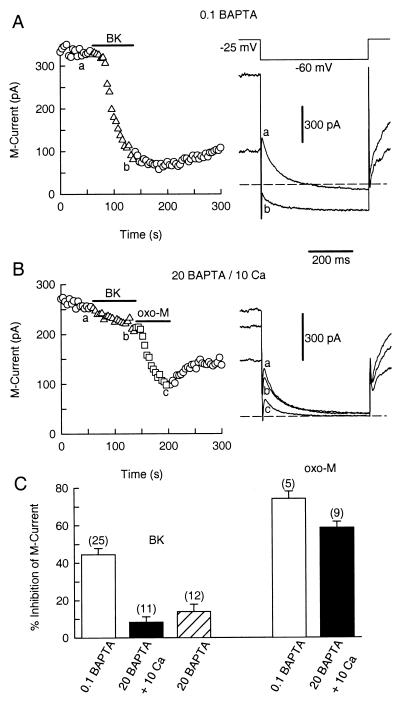
In sympathetic neurons, muscarinic suppression of M current is quite sensitive to lowering the basal level of [Ca2+]i below 100 nM but is much less sensitive to strongly buffering [Ca2+]i at its normal resting level (10, 24). Our first hypothesis was that BK suppresses M current in the same fashion as muscarinic agonists. Therefore, we tested the sensitivity of the BK pathway to the Ca2+ buffer, BAPTA. Fig. 1A shows that BK (50 nM) strongly suppresses M current in a cell dialyzed with the standard internal solution containing 0.1 mM BAPTA. With this low concentration of BAPTA, rises in [Ca2+]i are mainly regulated by the endogenous buffer capacity of the cell (10). The mean M current inhibition using this standard internal solution was 44.4 ± 3.4% (n = 25, Fig. 1C). In contrast, with a pipette solution containing 20 mM BAPTA (no added Ca), the mean inhibition was only 10.3 ± 1.3% (n = 12), after 9 min dialysis (Fig. 1C). To identify whether the lowered [Ca2+] level (<20 nM free Ca2+; see ref. 10) or the high buffer capacity for Ca2+ was important for this block, we tested modulation of M current by using 20 mM BAPTA with 10 mM added Ca in the pipette solution (143 nM free Ca2+; see ref. 10). The BK-mediated inhibition of M current was still reduced (triangles in Fig. 1B; 8.2 ± 2.9%, n = 11, Fig. 1C) even though with the same internal solution, the M1 muscarinic agonist oxo-M inhibited M current strongly (squares in Fig. 1B). The mean inhibition of M current by oxo-M (10 μM) was 74.1 ± 3.8% (n = 5) with 0.1 mM BAPTA and 58.6 ± 3.2% (n = 9) with 20 mM BAPTA/10 mM Ca (Fig. 1C) (see also ref. 10).
Figure 1.
Intracellular BAPTA blocks modulation of M current by BK. Symbols represent the amplitude of M current deactivation measured every 4 s. BK and oxo-M were applied as indicated by the horizontal bars. (A) BK elicits a strong inhibition of M current (triangles) in a neuron dialyzed with 0.1 mM BAPTA. Voltage protocol and M current recording for the control (a) and during BK exposure (b) are shown on the right. Dashed line is the zero current level. (B) BK (triangles), but not oxo-M (squares), fails to inhibit M current in a neuron dialyzed with a 20 mM BAPTA/10 mM Ca2+ pipette solution. M current records from the control condition (a), with BK (b) and oxo-M (c) shown on the right. (C) Bar plot of the mean suppression (±SEM) of M current by BK (50 nM) and oxo-M (10 μM) with different internal solutions. The number of cells tested for each condition is in parentheses. M current records in the high 20 mM BAPTA pipette solutions were taken 9 min after breakthrough of the patch membrane.
The effectiveness of the BAPTA dialysis could be estimated by using the method of Pusch and Neher (22). In these experiments the mean cell capacitance and series resistance were 45.0 ± 7.1 pF and 6.6 ± 0.7 MΩ. Using these numbers and the molecular weight of BAPTA, the estimated value for its time constant of dialysis was 618 s. Therefore, intracellular BAPTA should have reached 12 mM after 9 min of dialysis.
BK Simultaneously Raises [Ca2+]i and Inhibits M Current.
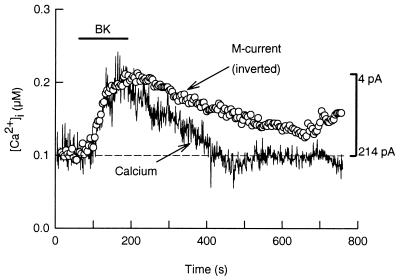
Because BAPTA can suppress BK modulation of M current regardless of the resting level of [Ca2+]i, a rise in [Ca2+]i may be the signal coupling BK receptors to M channel inhibition. Therefore, we measured [Ca2+]i and M current simultaneously. For these experiments, the Ca2+-sensitive dye indo-1 was included in the pipette solution. Fig. 2 shows that BK raises spatially averaged [Ca2+]i from 105 to 218 nM with a similar latency (≈20 s) and time to peak (≈95 s) as for the inhibition of M current. After washout of BK, M current recovers more slowly than the Ca2+ transient. When [Ca2+]i was measured in undialyzed cells with the membrane-permeant dye indo-1 AM, BK (100 nM) increased [Ca2+]i from 87 ± 7.9 nM to 161 ± 12.2 nM (n = 11) with a latency and time to peak of 14.6 ± 1.4 s and 102 ± 9 s, respectively (n = 11). Similarly, when BK was applied via a fast perfusion system, M current was inhibited with a latency and time to peak of 20 ± 4 s and 95 ± 5 s (n = 4), respectively. In conclusion, the onset of M current inhibition paralleled the [Ca2+]i rise.
Figure 2.
BK raises [Ca2+]i to inhibit M current. Simultaneous recordings of [Ca2+]i and M current were done in a neuron loaded with indo-1 dye through the patch pipette (0.1 mM BAPTA/0.1 mM indo-1). In this neuron, BK raised [Ca2+]i (continuous trace) from 105 nM to 218 nM. The dashed line is the basal [Ca2+]i level. For comparison, the M current data (circles) were inverted (vertical bar) and aligned to match the amplitude of the [Ca2+]i signal.
The PLC Inhibitor U-73122 Blocks BK Modulation of M Current.
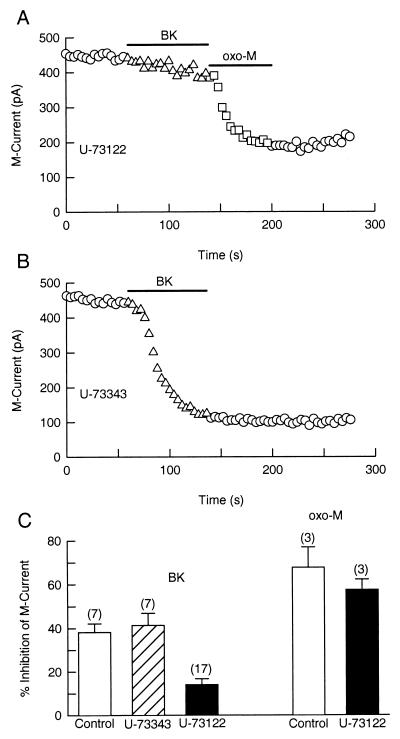
If BK action depends on a rise of [Ca2+]i, then it is likely to require activation of PLC. We tested this hypothesis by using U-73122 and U-73343, a PLC inhibitor and its inactive analogue. In dorsal root ganglion neurons, a 20-min treatment with 1 μM U-73122 blocks BK-induced Ca2+ transients (25). For our experiments, SCG neurons were preincubated with the blocker for 30 min before a gigaseal was formed. There was no significant difference between M current density in control cells (4.66 ± 0.69 pA/pF) and in neurons treated with U-73122 (4.17 ± 0.47 pA/pF). Fig. 3A shows that U-73122 (1 μM) blocks modulation of M current by BK (triangles) but not by oxo-M (squares) in the same cell. As a control, the inactive analogue U-73343 had no effect on the BK pathway (Fig. 3B). Fig. 3C summarizes measurements on several cells. The BK-mediated inhibition of M current was significantly lower in cells treated with U-73122 (14.0 ± 2.7%, n = 17) than in control cells (38.2 ± 3.9%, n = 7) or in cells treated with the inactive compound U-73343 (41.3 ± 5.5%, n = 7). In contrast, the muscarinic modulation of M current was not blocked by the PLC inhibitor. Oxo-M (5 μM) reduced M current by 67.7 ± 9.2% (n = 3) in control cells and by 57.5 ± 4.7% (n = 3) in cells treated with U-73122 (Fig. 3C).
Figure 3.
Suppression of M current by BK is attenuated by the PLC inhibitor U-73122. Cells were incubated for 30 min with U-73122 (1 μM) or U-73343 (1 μM). BK (100 nM) and oxo-M (5 μM) were applied as indicated by the horizontal bars. (A) U-73122 prevents M current suppression by BK (triangles) but not by oxo-M (squares). (B) The inactive analog U-73343 does not block modulation of M current by BK. (C) Mean (±SEM) inhibition of M current by BK or by oxo-M in control cells (open bars) and in neurons treated with U-73343 (dashed bar) or U-73122 (solid bars).
IP3 Receptor Antagonists Block Modulation of M Current by BK.
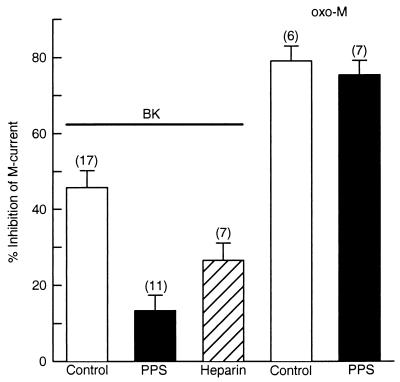
Because the PLC inhibitor blocked modulation of M current by BK, we reasoned that BK would use IP3 receptors in this intracellular signaling pathway. Therefore, we tested whether IP3 receptor antagonists block M current modulation by BK. We first used PPS, a polyanionic synthetic polymer of β-d-xylopiranose (molecular mass, 3 kDa), which inhibits IP3 binding in rat liver microsomes with a half-maximal inhibitory concentration (IC50) of 6.9 μg/ml (26). Neurons were dialyzed with 100 μg/ml PPS, and M current recording was started 14 min after achieving whole-cell configuration. Fig. 4 shows that PPS attenuates BK inhibition of M current from 45.7 ± 4.5% (n = 17) to 13.3 ± 4.0% (n = 11). Another IP3 receptor antagonist, heparin (6 kDa, 200 μg/ml), was less effective than PPS to block the BK pathway (26.5 ± 4.5%, n = 7). In these experiments, series resistance and cell capacitance were 4.3 ± 0.57 MΩ and 70.1 ± 8.1 pF, respectively, and the estimated time constant for dialysis PPS was 60 min. Thus, the PPS concentration should have reached 21 μg/ml after 14 min of dialysis, about three times the IC50 (6.9 μg/ml) for inhibition of IP3 binding but not enough to activate ryanodine receptors (EC50 = 162 μg/ml, see ref. 27).
Figure 4.
Antagonists of the IP3 receptor selectively disrupt the BK pathway. Neurons were dialyzed with PPS or heparin for 14 min before M current recording. Mean (±SEM) inhibition of M current by BK (100 nM) and oxo-M (10 μM) in control cells (open bars) and in neurons dialyzed with PPS (solid bars) or heparin (dashed bar). PPS (100 μg/ml) disrupts M current inhibition by BK but not by oxo-M. Heparin (200 μg/ml) was less effective than PPS to block the BK-activated pathway.
In contrast, the same PPS treatments did not block the modulation of M current by oxo-M (Fig. 4). In control cells oxo-M reduced M current by 79.1 ± 3.9% (n = 6) and in cells dialyzed with PPS, by 75.4 ± 3.7% (n = 7).
IP3 Occludes Modulation of M Current by BK.
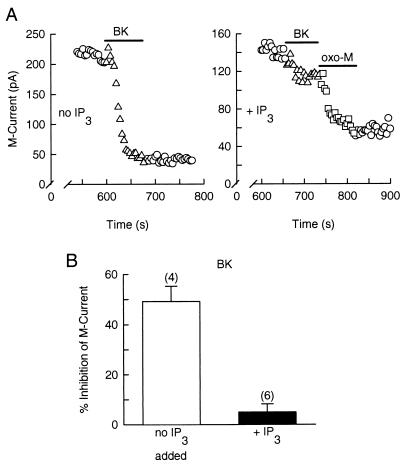
IP3 was added to the recording pipette to further assess whether it can be the second messenger for inhibition of M current by BK. As neurons were dialyzed with IP3 (100 μM), M current became continuously smaller, and 10 min after breakthrough of the patch, the M current density was only 1.44 ± 0.37 pA/pF (cell capacitance = 71.4 ± 7.1 pF, n = 6). After the same period, the M current density for control cells was 2.92 ± 0.18 pA/pF (cell capacitance = 60.2 ± 8.3 pF, n = 4), a statistically significant difference (P < 0.05). The reduction in M current density was 51%, indicating that IP3 is almost as effective as BK in inhibiting M current. Furthermore, the ability of BK to inhibit M current was greatly attenuated in neurons dialyzed with IP3, as compared with the control response (Fig. 5A). In control cells, BK reduced M current by 49.2 ± 6.0% (n = 4) and in IP3-dialyzed neurons, it reduced M current only by 5.0 ± 3.2% (n = 6) (Fig. 5B). By contrast, IP3 did not occlude the inhibition of M current by oxo-M (squares in Fig. 5A).
Figure 5.
IP3 occludes the inhibitory action of BK on M current. M current records were taken 10 min after breakthrough of the patch membrane. (A Left) In a control cell, BK suppresses M current. (A Right) In a neuron dialyzed with IP3 (100 μM), BK does not inhibit M current well (triangles), whereas oxo-M does (squares). (B) Mean inhibition (±SEM) of M current by BK in control (open bar) and IP3-loaded cells (solid bar).
To assess the role of protein kinase C (PKC) on BK modulation of M current, we used the PKC activator phorbol-12-myristate, 13-acetate (PMA). PMA (100–500 nM) itself reduced M current by 10.7 ± 3.7% (n = 5) but this did not occlude the further action of BK (51.1 ± 9.7%, n = 5, control cells, and 40.8 ± 11.2%, n = 6, PMA-treated cells). Likewise, inhibition of M current was not blocked by 30-min pretreatment with the kinase inhibitor staurosporin (400 nM, n = 4, not shown). Thus, PKC appears not to mediate the M channel inhibition by BK receptors.
Depletion of Internal Ca2+ Stores Blocks Modulation of M Current by BK.
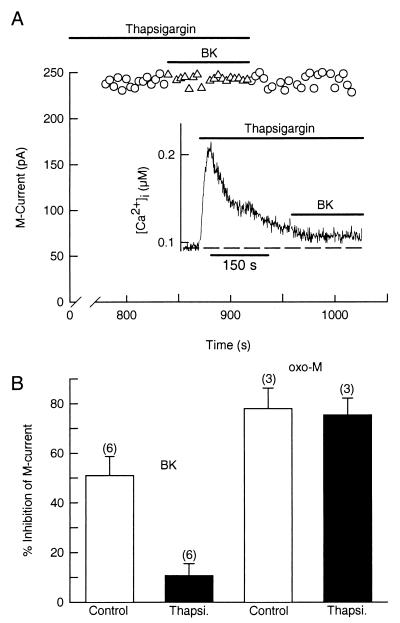
Because BK receptors seem to be using the IP3 pathway to depress the M current, we wanted to verify the importance of intracellular Ca2+ stores. We used the sarcoplasmic–endoplasmic reticulum Ca2+ pump inhibitor thapsigargin to deplete the Ca2+ stores. As expected, thapsigargin (5 μM) transiently increased [Ca2+]i from 68 ± 9 nM to 268 ± 35 nM (n = 4) and then blocked the rise of Ca2+ evoked by BK (Fig. 6A Inset). In patch-clamp experiments, treatment with thapsigargin (10–15 min) also blocked the ability of BK to depress M current (symbols in Fig. 6A). Thus, whereas BK had a strong inhibitory effect on M current in control cells (50.9 ± 7.7%, n = 6), it had only a weak action (10.7 ± 4.7%, n = 6) in cells depleted of their internal Ca2+ stores (Fig. 6B). Thapsigargin had no effect on the action of oxo-M on M current (control, 78.0 ± 8.2%, n = 3; thapsigargin, 75.4 ± 6.8%, n = 3) (Fig. 6B).
Figure 6.
Thapsigargin prevents the BK-evoked increase of [Ca2+]i and suppression of M current. (A) In a cell treated with thapsigargin (5 μM) for 13 min, BK does not inhibit M current. (Inset) Thapsigargin transiently raises [Ca2+]i from 92 to 210 nM and blocks a further rise of [Ca2+]i by BK (data from a different cell). (B) Mean (±SEM) M current inhibition by BK (100 nM) or oxo-M (10 μM) in control cells (open bars) and in neurons treated with thapsigargin (Thapsi., solid bars).
A BK-activated influx of extracellular Ca2+ is not needed for M current inhibition. In three experiments, BK inhibited M current in a Ca2+-free SCG Ringer’s solution as strongly (46.5 ± 3.4%) as in the standard SCG Ringer’s solution. This result confirms that M current inhibition by BK is mediated by Ca2+ release from internal stores.
DISCUSSION
We have demonstrated a clear role for PLC and a rise in [Ca2+]i in coupling BK receptor activation to M current inhibition: (i) BAPTA blocked the suppression of M current by BK regardless of the basal buffered level of [Ca2+]i, (ii) BK raised [Ca2+]i and inhibited M current with similar kinetics, (iii) M current suppression was disrupted by inhibition of PLC and by block of IP3 receptors, (iv) M current was depressed by IP3 and further modulation by BK was occluded, and (v) depletion of intracellular Ca2+ stores blocked both the rise of [Ca2+]i and the inhibition of the M current.
Selyanko and Brown (28) showed that Ca2+ inhibits M channel unitary activity in inside-out excised patches with an IC50 of around 100 nM and with a maximum effect at 1,000 nM. In whole-cell experiments with Ca2+ buffers and caged Ca2+, others find biphasic actions with Ca2+ reducing M current amplitude only when [Ca2+]i is increased to >200 nM (24, 29). In our experiments, BK raised mean whole-cell [Ca2+]i from 87 nM to only 161 nM. However, it is quite possible that there are local gradients of Ca2+ release and that the rise of [Ca2+]i in the proximity to the M channels is larger than the Ca2+ transients sensed by global fluorescence microphotometry. The kinetic similarity of the onset of M current inhibition and the rise of [Ca2+]i could mean that Ca2+ is the final messenger for the BK action, but a contribution of other Ca2+-dependent intermediaries seems likely because in our work M current remained partially inhibited even after return of global [Ca2+]i to its resting level. The involvement of additional diffusible Ca2+-dependent molecules mediating M channel modulation also was implied in previous work with excised patches, where Ca2+ sometimes (16/44 patches) failed to reduce M channel activity or its inhibitory action was desensitized (28). In bullfrog sympathetic neurons, dialysis of CaN420, a Ca2+-independent form of calcineurin, inhibits macroscopic M current and reduces single M channel activity (30). Hence, Ca2+-dependent activation of calcineurin could contribute to M current inhibition upon BK receptor stimulation in SCG neurons.
All of our evidence suggests that BK receptors use the PLC/IP3 pathway to inhibit M channels. It is known that BK also releases arachidonic acid via activation of the Ca2+-dependent enzyme phospholipase A2 (31); however, we do not think that arachidonic acid is the principal player here because arachidonic acid increases M current (32, 33). We clearly found that IP3 reduced M current density and then occluded BK action. Previously, Brown et al. (8) did not find an effect of IP3 in SCG neurons. The main experimental difference was that they used an internal solution buffered to pH 6.7 to reduce M current rundown, whereas we used an internal pH of 7.4, a level that may favor IP3 binding to its receptor (34).
The strong evidence presented here in favor of Ca2+ as the messenger for the effect of BK on M current provides equally strong evidence that Ca2+ is not the messenger for the muscarinic effect in sympathetic neurons, in agreement with the conclusions of Pfaffinger et al. (14), Beech et al. (10), and Marrion et al. (29). Indeed, we can now argue more securely that even the action of PLC is not needed for the muscarinic effect (see also ref. 6). The identity of the second messenger underlying the muscarinic inhibition of M channels thus remains unclear (12). Kirkwood et al. (35) proposed that Ca2+ is the second messenger for M current inhibition, because in their experiments a 20-mM internal BAPTA buffer (measured free [Ca2+]i = 120 nM) reversibly disrupted M current modulation by muscarine in bullfrog sympathetic neurons. On the other hand, in SCG neurons others have found no Ca2+ rise with muscarinic agonists (10, 36), and either no effect of BAPTA (6, 14, 29) or disruption of M channel inhibition only when [Ca2+]i is held low (10, 24). We continue to believe that a certain level of Ca2+ is necessary and permissive for M current inhibition by muscarinic receptors, but that Ca2+ does not carry the signal. This permissive role of Ca2+ may be because of some Ca2+-sensitive step in the signaling pathway coupling the muscarinic receptors to M channels or as result of a particular functional state of the M channels, which are sensitive to the basal level of [Ca2+]i (24, 28, 29).
There remains another interesting paradox. Muscarinic and BK suppression of M current both are found to be disrupted by antibodies against Gαq/11 (16, 19), yet they use quite different signaling pathways. It is inescapable that something is different about the population of heterotrimeric Gq family isoforms and the effectors they couple to between BK and muscarinic receptors in the SCG neuron. Apparently, only the BK receptors couple effectively to PLC and rises in [Ca2+]i, whereas the muscarinic receptors, which have a stronger effect on M current, elicit no Ca2+ response in SCG neurons and couple to a U-73122-insensitive effector not activated by BK receptors that reduces M current in a few seconds and reversibly—the classical modulation of M current. The identity of this effector remains elusive as does the answer to the puzzle of how two receptors acting through Gq in the same cell couple to quite different signaling systems.
Acknowledgments
We thank Drs. K. Mackie, M. S. Shapiro, E. J. Kaftan, and K.-T. Kim for reading the manuscript and D. Anderson and L. Miller for technical assistance. This work was supported by National Institutes of Health Grants NS-08174 and AR-17803, and the W. M. Keck Foundation. H.C. is a Pew Latin American Fellow in Biomedical Sciences.
ABBREVIATIONS
- BAPTA
1,2-bis(O-aminophenoxy)ethane-N,N,N′,N′-tetraacetic acid
- BK
bradykinin
- [Ca2+]i
intracellular free Ca2+ concentration
- oxo-M
oxotremorine methiodide
- PLC
phospholipase C
- PPS
pentosan polysulfate
- SCG
superior cervical sympathetic ganglion
References
- 1.Hille B. Trends Neurosci. 1994;17:531–536. doi: 10.1016/0166-2236(94)90157-0. [DOI] [PubMed] [Google Scholar]
- 2.Bernheim L, Beech D J, Hille B. Neuron. 1991;6:859–867. doi: 10.1016/0896-6273(91)90226-p. [DOI] [PubMed] [Google Scholar]
- 3.Shapiro M S, Wollmuth L P, Hille B. Neuron. 1994;12:1319–1329. doi: 10.1016/0896-6273(94)90447-2. [DOI] [PubMed] [Google Scholar]
- 4.Lewis D L, Ikeda S R. Neuroendocrinology. 1997;66:235–245. doi: 10.1159/000127244. [DOI] [PubMed] [Google Scholar]
- 5.Lee S B, Rhee S G. Curr Opin Cell Biol. 1995;7:183–189. doi: 10.1016/0955-0674(95)80026-3. [DOI] [PubMed] [Google Scholar]
- 6.Robbins J, Marsh S J, Brown D A. J Physiol. 1993;469:153–178. doi: 10.1113/jphysiol.1993.sp019809. [DOI] [PMC free article] [PubMed] [Google Scholar]
- 7.Marrion N V. Pflügers Arch. 1994;426:296–303. doi: 10.1007/BF00374785. [DOI] [PubMed] [Google Scholar]
- 8.Brown D A, Marrion N V, Smart T G. J Physiol. 1989;413:469–488. doi: 10.1113/jphysiol.1989.sp017664. [DOI] [PMC free article] [PubMed] [Google Scholar]
- 9.Dutar P, Nicoll R A. J Neurosci. 1988;8:4214–4224. doi: 10.1523/JNEUROSCI.08-11-04214.1988. [DOI] [PMC free article] [PubMed] [Google Scholar]
- 10.Beech D J, Bernheim L, Mathie A, Hille B. Proc Natl Acad Sci USA. 1991;88:652–656. doi: 10.1073/pnas.88.2.652. [DOI] [PMC free article] [PubMed] [Google Scholar]
- 11.Hille B, Beech D J, Bernheim L, Mathie A, Shapiro M S, Wollmuth L P. Life Sci. 1995;56:989–992. doi: 10.1016/0024-3205(95)00038-8. [DOI] [PubMed] [Google Scholar]
- 12.Marrion N V. Annu Rev Physiol. 1997;59:483–504. doi: 10.1146/annurev.physiol.59.1.483. [DOI] [PubMed] [Google Scholar]
- 13.Bosma M M, Hille B. Proc Natl Acad Sci USA. 1989;86:2943–2947. doi: 10.1073/pnas.86.8.2943. [DOI] [PMC free article] [PubMed] [Google Scholar]
- 14.Pfaffinger P J, Leibowitz M D, Subers E M, Nathanson N M, Almers W, Hille B. Neuron. 1988;1:477–484. doi: 10.1016/0896-6273(88)90178-x. [DOI] [PubMed] [Google Scholar]
- 15.Shapiro M S, Zhou J, Hille B. J Neurophysiol. 1996;76:311–320. doi: 10.1152/jn.1996.76.1.311. [DOI] [PubMed] [Google Scholar]
- 16.Jones S, Brown D A, Milligan G, Willer E, Buckley N J, Caulfield M P. Neuron. 1995;14:399–405. doi: 10.1016/0896-6273(95)90295-3. [DOI] [PubMed] [Google Scholar]
- 17.Boehm S, Huck S. Br J Pharmacol. 1997;122:455–462. doi: 10.1038/sj.bjp.0701404. [DOI] [PMC free article] [PubMed] [Google Scholar]
- 18.Minshall R D, Yelamanchi V P, Djokovic A, Miletich D J, Erdös E G, Rabito S F, Vogel S M. Circ Res. 1994;74:441–447. doi: 10.1161/01.res.74.3.441. [DOI] [PubMed] [Google Scholar]
- 19.Caulfield M P, Jones S, Vallis Y, Buckley N J, Kim G-D, Milligan G, Brown D A. J Physiol. 1994;477:415–422. doi: 10.1113/jphysiol.1994.sp020203. [DOI] [PMC free article] [PubMed] [Google Scholar]
- 20.Gutowsky S, Smrcka A, Nowak L, Wu D, Simon M, Sternweis P C. J Biol Chem. 1991;266:20519–20524. [PubMed] [Google Scholar]
- 21.Hamill O P, Marty A, Neher E, Sakmann B, Sigworth F J. Pflügers Arch. 1981;391:85–100. doi: 10.1007/BF00656997. [DOI] [PubMed] [Google Scholar]
- 22.Pusch M, Neher E. Pflügers Arch. 1988;411:204–211. doi: 10.1007/BF00582316. [DOI] [PubMed] [Google Scholar]
- 23.Grynkiewicz G, Poenie M, Tsien R Y. J Biol Chem. 1985;260:3440–3450. [PubMed] [Google Scholar]
- 24.Yu S P, O’Malley D M, Adams P R. J Neurosci. 1994;14:3487–3499. doi: 10.1523/JNEUROSCI.14-06-03487.1994. [DOI] [PMC free article] [PubMed] [Google Scholar]
- 25.Jin W, Lo T-M, Loh H H, Thayer S A. Brain Res. 1994;642:237–243. doi: 10.1016/0006-8993(94)90927-x. [DOI] [PubMed] [Google Scholar]
- 26.Tones M A, Bootman M D, Higgins B F, Lane D A, Pay G F, Lindahl U. FEBS Lett. 1989;252:105–108. doi: 10.1016/0014-5793(89)80898-1. [DOI] [PubMed] [Google Scholar]
- 27.Bezprozvanny I B, Ondrias K, Kaftan E, Stoyanovsky D A, Ehrlich B E. Mol Biol Cell. 1993;4:347–352. doi: 10.1091/mbc.4.3.347. [DOI] [PMC free article] [PubMed] [Google Scholar]
- 28.Selyanko A A, Brown D A. Neuron. 1996;16:151–162. doi: 10.1016/s0896-6273(00)80032-x. [DOI] [PubMed] [Google Scholar]
- 29.Marrion N V, Zucker R S, Marsh S J, Adams P R. Neuron. 1991;6:533–545. doi: 10.1016/0896-6273(91)90056-6. [DOI] [PubMed] [Google Scholar]
- 30.Marrion N V. Neuron. 1996;16:163–173. doi: 10.1016/s0896-6273(00)80033-1. [DOI] [PubMed] [Google Scholar]
- 31.Kaya H, Patton G M, Hong S L. J Biol Chem. 1989;264:4972–4977. [PubMed] [Google Scholar]
- 32.Bosma M M, Bernheim L, Leibowitz M D, Pfaffinger P J, Hille B. In: G Proteins and Signal Transduction. Nathanson N M, Harden T K, editors. New York: The Rockefeller Univ. Press; 1990. pp. 43–59. [Google Scholar]
- 33.Yu S P. J Physiol. 1995;487:797–811. doi: 10.1113/jphysiol.1995.sp020919. [DOI] [PMC free article] [PubMed] [Google Scholar]
- 34.Worley P F, Baraban J M, Supattapone S, Wilson V S, Snyder S H. J Biol Chem. 1987;262:12132–12136. [PubMed] [Google Scholar]
- 35.Kirkwood A, Simmons M A, Mather R J, Lisman J. Neuron. 1991;6:1009–1014. doi: 10.1016/0896-6273(91)90240-z. [DOI] [PubMed] [Google Scholar]
- 36.Wanke E, Ferroni A, Malgaroli A, Ambrosini A, Pozzan T, Meldolesi J. Proc Natl Acad Sci USA. 1987;84:4313–4317. doi: 10.1073/pnas.84.12.4313. [DOI] [PMC free article] [PubMed] [Google Scholar]


