

Abstract
We sought to determine whether lipolysis, fatty acid (FA) mobilization, and plasma FA oxidation would remain elevated for hours following isoenergetic exercise bouts of different intensities. Ten men and eight women received a primed-continuous infusion of [1,1,2,3,3-2H5]glycerol and continuous infusion of [1-13C]palmitate to measure glycerol and plasma FA kinetics. On Day 1 (D1), participants were studied under one of three different conditions, assigned in random order: (1) before, during and 3 h after 90 min of exercise at 45% (E45), (2) before, during and 3 h after 60 min of exercise at 65%
 (E65), and (3) in a time-matched sedentary control trial (C). For each condition, participants were studied by indirect calorimetry the following morning as well (D2). Rate of appearance (Ra) of glycerol (RaGL) increased above C during exercise in men and women (P < 0.05), was higher in E45 than E65 in men (P < 0.05), and was not different between exercise intensities in women. During 3 h of postexercise recovery, RaGL remained significantly elevated in men (P < 0.05), but not women. FA Ra (RaFA) increased during exercise in men and women and was higher in E45 than E65 (P < 0.05), and remained elevated during 3 h of postexercise recovery in both sexes (P < 0.05), but with a greater relative increase in men than women (P < 0.05). Plasma FA oxidation (Rox) increased during exercise with no difference between intensities, and it remained elevated during 3 h of postexercise recovery in both sexes (P < 0.05). Total lipid oxidation (Lox) was elevated in both sexes (P < 0.05), but more in men during 3 h of postexercise recovery on D1 (P < 0.05) and remained elevated on D2 in men (P < 0.05), but not in women. There were no differences between E45 and E65 for postexercise energy substrate turnover or oxidation in men and women as energy expenditure of exercise (EEE) was matched between bouts. We conclude that the impact of exercise upon lipid metabolism persists into recovery, but that women depend more on lipid during exercise whereas, during recovery, lipid metabolism is accentuated to a greater extent in men.
During sustained exercise of moderate intensity, the rates of lipolysis (glycerol production) and fatty acid (FA) mobilization (FA production) increase in men (Friedlander et al. 1999; Friedlander et al. 2007) and women (Friedlander et al. 1998; Jacobs et al. 2005), although FA mobilization and lipid oxidation decline if the exercise intensity is increased to a particularly high exertion level (Romijn et al. 1993, 2000; Brooks & Mercier, 1994; Brooks, 1997, 1998). During moderate-intensity exercise, elevated lipid oxidation is supported not only by the increased rate of FA mobilization, but also by a change in the relative partitioning of plasma FA toward oxidation rather than storage (Friedlander et al. 1998, 2007; Jacobs et al. 2005; Boon et al. 2007). However, for individuals following Institute of Medicine recommendations (IOM, 2002) or Department of Health and Human Services physical activity guidelines (DHHS & USDA 2005), the duration of activity (30–90 min) would represent a small fraction of the total time in daily life, and the resting metabolic rate would still make up the major portion of daily total energy expenditure (TEE). As well, alterations in fat metabolism during moderate- to hard-intensity exercise are modest compared to the relatively larger increments in skeletal muscle glycogen utilization and blood glucose disposal (Brooks & Trimmer, 1996; Brooks, 1998).
Exercise acutely leads to an altered resting metabolism, and the postexercise time period is therefore important in the management of adiposity (Weststrate et al. 1990; Broeder et al. 1991; Phelain et al. 1997; Horton et al. 1998; Kuo et al. 2005). Each individual bout of exercise can potentially lead to elevated lipid oxidation for hours following cessation of the exercise session. For effects upon energy substrate metabolism, the postexercise time period may be as important as the time spent during the activity. Therefore, to fully understand differences between exercise intensities and differences between men and women, the postexercise recovery period should be considered. The energy expenditure of exercise (EEE) rapidly leads to a state of negative energy balance, and therefore, comparisons with the metabolic response to short-term fasting may be appropriate as each is a means to achieving negative energy balance. It has been shown that the increase in fat oxidation that occurs during a fast of several days is accompanied by increased lipolysis (Wolfe et al. 1987; Klein et al. 1989; Carlson et al. 1994) and FA mobilization (Wolfe et al. 1987; Klein et al. 1989; Romijn et al. 1991; Carlson et al. 1994; Webber et al. 1994). Even in short-term fasting, lipolysis increases over the duration of just a single day in the postabsorptive state (Mittendorfer et al. 2001), and therefore drift in lipid metabolism across the day should be considered in studies of postexercise metabolism. In their study of diurnal variation of lipolysis, Mittendorfer et al. (2001) showed that in studies of postexercise recovery, postexercise substrate kinetics need to be compared to time-matched resting control trials rather than to the pre-exercise data obtained hours earlier in the day.
As of yet, studies of energy substrate kinetics with tracers during the postexercise recovery period are minimal. Magkos et al. (2006, 2007 reported that FA mobilization was elevated in men the day after a bout of exercise. Monitoring male study participants for 2 h immediately following moderate-intensity, long-duration exercise, Wolfe et al. (1990) reported that glycerol flux was elevated above pre-exercise rest, but Van Hall et al. (2002) later reported that glycerol flux was not elevated above pre-exercise rest during the 3 h measurement period following 1 h of intense exercise. In both Wolfe et al. (1990) and Van Hall et al. (2002), FA flux was significantly elevated above pre-exercise rest following exercise bouts, but subsequently Boon et al. (2007) reported that plasma FA flux was not significantly different from pre-exercise values over 2 h of recovery in men. We reasoned that disagreement among findings of different studies might be attributable to the absence of time-matched resting control trials. Furthermore, we were concerned that the aforementioned studies did not obtain data on women.
With an interest in assessing viability of exercise as a means to alter pathways of lipid mobilization and FA partitioning, we sought to assess the extent of alterations in lipid mobilization and oxidation during exercise and the subsequent postexercise recovery period. Therefore, utilizing stable isotope tracer methodology, we studied the effects of prior exercise bouts upon lipolysis and FA kinetics during 3 h of postexercise recovery immediately following cessation of two isoenergetic exercise bouts of different intensities and compared results to those of a sedentary condition. We hypothesized that lipolysis, FA mobilization, and plasma FA oxidation would be elevated during 3 h of postexercise recovery in men and women. We also hypothesized that total lipid oxidation would remain elevated the day following isoenergetic bouts of moderate and hard exercise.
Methods
Study participants
Twenty healthy, moderately active, non-smoking, weight-stable volunteers (10 men and 10 women) were recruited from the University of California, Berkeley campus and surrounding community by posted notice and email. Potential study participants underwent subsequent screening tests if they were disease-free as determined by physical examination and health history questionnaire, were not taking medications known to affect energy metabolism, had a body mass index (BMI) of less than 28, were neither sedentary individuals nor elite athletes, and had normal lung function as determined by 1 s forced expiratory volume of greater than or equal to 70% of vital capacity. Female study participants reported regular menstrual cycles (24–32 days) and were not taking oral contraceptives or other forms of exogenous ovarian hormones. We sought to study women in the early follicular phase of the menstrual cycle in order to standardize conditions between trials. Therefore, study participants were studied between days 3 and 8 of their menstrual cycles, and the cycle phase was later considered to be confirmed if oestradiol was less than 50 pg ml−1 and progesterone was less than 1 ng ml−1 (Suh et al. 2002) in serum collected the morning of tracer infusion trials. In two women, serum oestradiol concentrations were greater than 50 pg ml−1, and so these participants were removed from the analysis. Therefore, the number of study female participants included in the final analysis was reduced to eight. The procedures and risks were thoroughly explained to the study participants, and their written, informed consent was obtained. The University of California, Berkeley Committee for the Protection of Human Subjects approved the study protocol (CPHS no. 2004-6-103).
Screening tests
Study participants underwent two progressive exercise tests to assess  before beginning the study, and an additional
  assessment was carried out upon completion of the study in order to confirm that study participants' fitness levels had not changed over the course of experimentation. Exercise was performed on a leg-cycle ergometer (Monark Ergometric 839E, Vansbro, Sweden). A continual progressive protocol was used to determine
  with an increase in power output at 3 min intervals until volitional exhaustion. Body composition was assessed by experienced personnel using a seven-site skinfold measurement (Jackson & Pollock, 1978; Jackson et al. 1980) before enrolling study participants and again at completion of the study in order to confirm that study participants' body composition had not changed over the course of experimentation. In previous investigations, we (Friedlander et al. 1998, 1999) found the skinfold and hydrostatic weighing methods to provide similar results on the study population of interest. Dietary energy and macronutrient intake was monitored at the beginning, middle, and end of the study by separate 3 day diet records; analysis was performed with Diet Analysis Plus, version 6.1 (ESHA Research, Salem, OR, USA).
Experimental design
With at least 1 week between trials for men and 1 month between trials for women, participants were studied under each of three conditions, each on separate occasions, assigned in a random order. Men and women were studied with tracer infusion, blood and breath sampling, and indirect calorimetry on Day 1 (D1) (1) before, during, and 3 h after ∼90 min of exercise at 45% (E45), (2) before, during, and 3 h after ∼60 min of exercise at 65%
 (E65), and (3) during a time-matched resting condition (C), and additionally were studied by indirect calorimetry the morning following each of these three occasions (D2). A schematic diagram of the study design is shown in Fig. 1. After catheterization, study participants lay semisupine quietly reading or watching movies. After exercise, study participants dismounted the ergometer and sat in a chair where they remained for 30 min and were then transferred to an examination table where they remained semisupine for the remaining 2.5 h of postexercise recovery. Water was consumed ad libitum during recovery but study participants consumed no other beverages and no food until the 3 h postexercise measurement period ended. Study participants were transported in a wheelchair for trips to the toilet. After spending the remainder of D1 outside of the laboratory and consuming standardized diets provided to subjects (vide infra), study participants returned to the laboratory on the following morning for an additional measurement. Duration of the first randomly assigned exercise trial, either 45% or 65%
 , was set at 90 or 60 min, respectively. The appropriate duration for the subsequent exercise trial at the remaining exercise condition was predicted with the goal of matching exercise energy expenditure (EEE) between exercise bouts using oxygen consumption
  and respiratory exchange ratio (RER) data from the
  assessments. Study participants rested the day prior to D1, and also were asked to abstain from exercise beyond that of the study protocol on D1, as they were to return to the laboratory the following day (D2) for an additional measurement.
Figure 1.
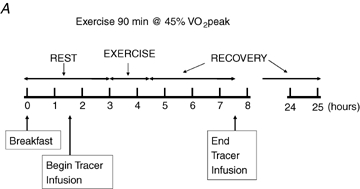
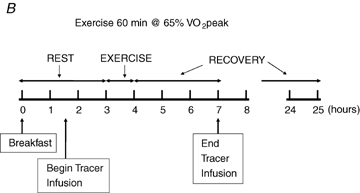
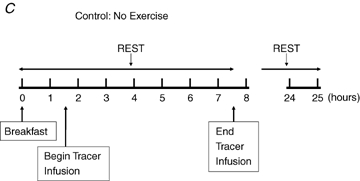
Experimental design Each study participant completed three different experimental trials in randomised order, one involving moderate-intensity exercise (A), one involving hard-intensity exercise (B), and one with no exercise (C).  , relative exercise intensity expressed as a percentage of peak O2 consumption. Hours, time elapsed since study participant arrived on Day 1. Hours 24–25 are Day 2.
Experimental protocol
For D1 and D2, study participants were instructed to consume solely their standardized diet and water ad libitum and to abstain from structured physical exercise sessions (beyond that carried out as part of the study protocol), but to continue typical activities of daily living, and were fed for a physical activity level (PAL) of 1.5 according to the current dietary reference intake guidelines of the Institute of Medicine for daily estimated energy requirement (EER) (IOM, 2002). Dietary energy intake was individualized for each study participant (men, 2788 ± 44 kcal day−1; women, 2129 ± 49 kcal day−1) and macronutrient composition was made similar between individuals for carbohydrate (men, 49.8 ± 0.3%; women, 50.1 ± 0.2%), lipid (men, 32.0 ± 0.3%; women, 32.3 ± 0.4%), and protein (men, 18.2 ± 0.3%; women, 17.6 ± 0.2%). On the day of tracer infusion trials (D1), study participants arrived at the laboratory at 07.00 h overnight fasted and ate a standardized breakfast of moderate/low glycaemic index (men: 450 kcal, 67% carbohydrate, 22% fat, 11% protein; women: 345 kcal, 65% carbohydrate, 26% fat, 9% protein). We chose to feed our study participants standardized breakfasts 3 h before exercise in order to mimic typical non-laboratory conditions.
On the morning of tracer infusion trials, a catheter was placed in a hand vein in order to collect arterialized blood using the heated hand vein technique. In a previous study in our laboratory (Horning et al. 1998), blood was simultaneously drawn from the radial artery and from a heated hand vein, and there were no differences between blood sampling sites for glucose, glycerol and palmitate isotopic enrichments. After collection of background blood and breath samples, a catheter was placed in a contralateral arm vein for continuous infusion of stable isotope tracers. Tracers were purchased from Cambridge Isotope Laboratories (Andover, MA, USA) and subsequently prepared in 0.9% sterile saline and tested for sterility and pyrogenicity at the University of California, San Francisco, School of Pharmacy. A continuous infusion of [1-13C]palmitate (bound to 5% human albumin) and primed-continuous infusion of [1,1,2,3,3-2H5]glycerol and [6,6,-2H2]glucose was started at 08.30 h. Glucose kinetics will be reported elsewhere. To correct for CO2 retention, for each condition separate trials were conducted using primed-continuous infusion of NaH13CO3 and those results are reported separately (Henderson et al. 2007). A [1,1,2,3,3-2H5]glycerol priming dose of 72 mg in men and 58 mg in women was given immediately prior to continuous infusion of [1,1,2,3,3-2H5]glycerol at a rate of 0.40 mg min−1 in men and 0.32 mg min−1 in women. The infusion rate of [1-13C]palmitate was 0.76 mg min−1 in men and 0.57 mg min−1 in women. Glycerol tracer infusion rate was increased 2-fold above rest at 45% and 3-fold above rest at 65%
 and the infusion rate for [1-13C]palmitate was increased 2-fold at both exercise intensities. For all tracers, infusion rates were immediately set back to initial resting rates at completion of exercise bouts for assessment of substrate kinetics during 3 h of postexercise recovery. On the morning of tracer infusion trials, prior to beginning infusion, aliquots of infusates were collected for analysis of concentration and IE in order to input more accurate infusion rates into the calculation of rate of appearance (Ra). At each blood sampling time point pulmonary gas exchange was determined for assessment of metabolic rate and an aliquot of expired breath was collected in evacuated Exetainer tubes for subsequent determination of 13CO2 isotopic enrichment (IE) by isotope ratio mass spectrometry (IRMS) that was performed by Metabolic Solutions (Nashua, NH, USA). At each sampling time point, heart rate was recorded from an electrocardiograph (Quinton Q750, Seattle, WA, USA) and blood pressure was measured by auscultation.
Study participants ate their standardized lunch in the laboratory before leaving on D1 and they took with them a standardized dinner and evening snack, and the participants were instructed to abstain from exercise outside of the laboratory during the remainder of the day. The study participants were transported by automobile to the laboratory at 07.00 h overnight fasted the morning following the tracer infusion (D2) for an additional pulmonary gas exchange determination taken from 07.30 h to 08.00 h. Two of the female study participants were unable to participate in this aspect of the study and so data from a total of 10 men and 6 women were included in the analysis of D2 substrate oxidation.
Blood sampling
Blood samples were drawn from the heated hand vein catheter on D1 before exercise (75 and 90 min after the start of tracer infusion), during exercise (45 and 60 min at 65% and 75 and 90 min at 45%
 ), and after exercise (5, 15, 30, 60, 90, 120, 150 and 180 min) for a total of 12 sampling time points. During the non-exercise trials, blood samples were drawn during 6 h of rest (75, 90, 135, 150, 165, 180, 210, 240, 270, 300, 330 and 360 min after the start of tracer infusion) for a total of 12 sampling time points. Additionally, blood was drawn before tracer infusion to obtain background IEs as well as oestradiol and progesterone concentrations in women. Blood samples for the analysis of FA concentration and palmitate IE were collected in tubes containing EDTA. After centrifugation at 3000 g for 20 min, 1 ml of plasma for FA analysis was extracted with 4 ml of 30 : 70 heptane–isopropanol containing pentadecanoic acid as internal standard and subsequently mixed with 2 ml 0.003 m sulphuric acid before storage at −20°C. Blood for glycerol concentration and IE was collected in 8% perchloric acid (PCA, 1 : 2), centrifuged at 3000 g for 20 min, and the supernatant was stored at −20°C. Blood for growth hormone concentration was collected in tubes with EDTA and aprotinin, for analysis of insulin and cortisol concentration with aprotinin, for catecholamine analysis with glutathione and EGTA, and for oestradiol and progesterone without any additive. Hormone samples were each were centrifuged at 3000 g for 20 min with subsequent storage of supernatants at −80°C.
Hormone analyses
Insulin, cortisol, oestradiol, and progesterone were determined by radioimmunoassay (Diagnostic Products Corporation, Los Angeles, CA, USA) and growth hormone by ELISA (Bio-Quant, San Diego, CA, USA). Adrenaline and noradrenaline were determined by high performance liquid chromatography (ESA Coulochem LC/EC, 5200A, Clemsford, MA, USA) with dihydroxybenzylamine (DHBA) as internal standard utilizing a modification of the extraction method of Anton & Sayre (1962) as previously described (Fattor et al. 2005).
FA analyses
FA were isolated from plasma extracts by thin layer chromatography (TLC), subsequently derivatized with 10% boron trichloride in methanol to fatty acid methyl ester (FAME) derivatives, dried under N2 gas, and reconstituted in heptane. Samples were then analysed by gas chromatography/mass spectrometry (GC/MS; GC model 6890 Series and MS model 5973N, Agilent Technologies) using an Agilent DB-225 GC column. The GC column effluent was split to the mass spectrometer for palmitate IE analysis and to a flame ionization detector (FID) for concentration of individual fatty acids. The GC injector temperature was set at 250°C; the initial oven temperature was held at 55°C for 30 s and was gradually increased by 25°C min−1 until it reached 195°C, and was then ramped at 3°C min−1 to 205°C and 8°C min−1 to 230°C. The transfer line was set at 280°C, the source temperature at 230°C, and the quadrapole temperature at 150°C. The carrier gas was helium and splitless injection was used in a constant flow mode of 2.7 ml min−1 and an average velocity of 60 cm s−1. Electron impact ionization and selective ion monitoring were performed for mass-to-charge ratios (M/Z) of 270 and 271 for endogenous palmitate and [1-13C]palmitate tracer, respectively. Selected ion abundances were compared against external standard curves for calculation of concentration and IE.
Glycerol analyses
Glycerol concentrations and IEs were determined from PCA extracts by gas chromatography/mass spectrometry (GC/MS; GC model 6890 Series and MS model 5973N, Agilent Technologies) of the triacetate derivative using an Agilent DB-225 GC column. In preparation for GC/MS, each sample was spiked with a known amount of [U-13C]glycerol as internal standard for concentration measurement, neutralized with 2 n potassium hydroxide, transferred to an ion exchange column with a mixture of cation and anion exchange resin (AG 50W-X8, 50–100 mesh H+ resin; AG 1-X8, 100–200 mesh formate resin) and eluted with deionized water. The eluent was lyophilized and subsequently derivatized with a 2 : 1 mixture of acetic anhydride/pyridine. The reagent was evaporated under N2 and the samples were reconstituted in ethyl acetate for GC/MS analysis. The GC injector temperature was set at 250°C; the initial oven temperature was 110°C and was gradually increased by 35°C until it reached a final temperature of 240°C. The transfer line was set at 280°C, the source temperature at 250°C, and the quadrapole temperature at 106°C. The carrier gas was helium and splitless injection was used in constant pressure mode of 20 p.s.i. and an average velocity of 55 cm s−1. Methane was used for chemical ionization and selective ion monitoring was performed for mass-to-charge ratios (M/Z) of 159, 162, and 164 for endogenous glycerol, [U-13C3]glycerol internal standard, and [1,1,2,3,3-5H2]glycerol tracer, respectively. Selected ion abundances were compared against external standard curves for calculation of concentration and IE.
Calculations
Palmitate and glycerol rates of appearance (Ra), disappearance (Rd), and metabolic clearance rate (MCR) were calculated using the equations of Steele (1959) as modified for use with stable isotopes (Wolfe, 1992) and these equations are reported below for convenience of the reader. Total FA concentration was calculated as the sum of the molar concentrations of the individual plasma FA concentrations that were measured by GC/FID, and palmitate kinetics were extrapolated to total FA kinetics by dividing by the percentage of FA made up by palmitate (expressed as a decimal). The percentage of FA Rd disposed of via oxidation (%Rdox) was calculated as the percentage of infused [1-13C]palmitate recovered as expired 13CO2, corrected for bicarbonate retention. Plasma FA oxidation was calculated as the product of FA Rd and %Rdox.
where F represents the tracer infusion rate, V is the estimated volume of distribution (40 ml kg−1 for palmitate and 270 ml kg−1 for glycerol), C1 and C2 are concentrations at sampling times t1 and t2, respectively, and IE1 and IE2 are isotopic enrichments at sampling times t1 and t2, respectively,  is the isotopic enrichment of expired breath 13CO2, and k is the bicarbonate retention factor (Henderson et al. 2007). Each of the male subjects and all but one of the female subjects participated in the study to derive bicarbonate correction factors, and therefore individualized corrections were used at each time point for each study participant, and the average female k for each time point was used for the subject who did not also participate in the bicarbonate study. We chose to use bicarbonate correction factors, as opposed to acetate correction factors, based upon a previous comparison between the two methods of adjusting tracer-derived oxidation rates (Trimmer et al. 2001). Because use of acetate correction factors can expand substrate oxidation rates to values beyond theoretical limits (i.e. Rox > Rd), the bicarbonate correction represents a more conservative approach to estimating plasma FA oxidation during physical activity. Isotopic enrichments were corrected for background enrichments in blood and breath samples collected before tracer infusion and these equations are in units of moles percent excess (MPE) divided by 100 to express as a decimal. Lipolysis was represented by glycerol Ra (RaGL) and the mobilization of FA into plasma was represented by FA Ra (RaFA).
Rate of energy expenditure (EE), carbohydrate oxidation (CHOox), and total lipid oxidation (Lox) were calculated from pulmonary gas exchange (Frayn, 1983). Assuming that all of Lox was from triacylglycerol (TAG), utilizing a TAG molecular weight of 860 g mol−1 and 3 fatty acids per TAG in calculations, lipid oxidation was expressed in units of μmol fatty acids per unit time. Tracer-derived FA Rox was considered to be plasma FA oxidation, and the remaining portion of Lox that was not accounted for by FA Rox was quantified as well and considered to be nonplasma FA sources or ‘other FA.’ In the substrate oxidation calculations, we utilized nonprotein RQ values for each time point that we derived from RER under the assumption that the percentage of resting metabolic rate fuelled by protein would be equal to the percentage of the standardized diet that was comprised by protein and that protein oxidation would not change in the transition from rest to exercise.
Statistical analyses
Data are presented as mean ± standard error of the mean. Comparisons between trials and across time points were made within each sex by analysis of variance with repeated measures with post hoc comparisons using Fisher's protected least significant difference test. The initial rest samples, 75 and 90 min time points, were collected under similar conditions in each of the three trials, and as results were not significantly different between trials for these time points, data for these time points are presented with the three trials pooled. Average postexercise values for variables were calculated using time points from 30 min postexercise to 180 min postexercise and the average corresponding values in C were the average of 180 min to 360 min after the start of tracer infusion which corresponded to the postexercise time-of-day. Selected planned comparisons between men and women were made by Student's unpaired t test, including comparison of the average values from the final 180 min of C, comparisons of average exercise values for a given intensity, and comparison of the average percentage elevation of postexercise recovery above C if both sexes showed elevation above C after exercise. Statistical analyses were performed using SPSS Graduate Pack 11.0 software. Statistical significance was set at α= 0.05.
Results
Characteristics of study participants
There were no significant differences between men and women regarding age, BMI, exercise habits, or  per unit fat free mass (Table 1). In both men and women,
  and body composition did not vary significantly between pre- and poststudy measurements. The habitual exercise of approximately 7 h per week was predominantly described as a moderate exertion level by both the men and women (more intense than walking and less intense than competitive sporting competition). Height, weight, and
  (l min−1 and ml kg−1 min−1) were significantly larger in men than in women (P < 0.05). Body fat percentage was significantly greater in women than in men (P < 0.05). Habitual dietary energy intake and macronutrient composition, as determined by multiple 3-day diet records, did not vary significantly between the three separate assessments and therefore averaged values are reported. Habitual dietary energy intake was significantly larger in men than women (men, 2537 ± 118 kcal day−1; women, 1854 ± 48 kcal day−1, P < 0.05). Habitual dietary macronutrient composition was not significantly different between sexes for carbohydrate (men, 53.2 ± 1.9%; women, 53.5 ± 1.6%), lipid (men, 30.5 ± 1.6%; women, 29.3 ± 1.3%), and protein (men, 16.3 ± 0.9%; women, 17.2 ± 0.8%).
Table 1.
Characteristics of study participants
| Men | Women | |
|---|---|---|
| Age (years) | 24.5 ± 1.1 | 25.4 ± 2.0 |
| Height (cm) | 178.5 ± 1.6* | 162.0 ± 2.2 |
| Weight (kg) | 73.1 ± 2.4* | 58.3 ± 1.9 |
| BMI (kg m−2) | 22.9 ± 1.6 | 22.2 ± 0.4 |
| Body fat (%) | 10.4 ± 1.2* | 22.2 ± 1.0 |
 (l min−1) (l min−1) |
4.1 ± 0.2* | 2.8 ± 0.2 |
 (ml kg−1 min−1) (ml kg−1 min−1) |
56.6 ± 2.0* | 48.9 ± 2.6 |
 (ml kg FFM−1 min−1) (ml kg FFM−1 min−1) |
63.0 ± 2.2 | 62.7 ± 3.2 |
| Exercise (h week−1) | 6.9 ± 0.9 | 7.0 ± 1.0 |
Values are means ±s.e.m. Men, n = 10; women, n = 8.  , peak O2 consumption; BMI, body mass index.
Significantly different between men and women, P < 0.05.
Characteristics of exercise bouts
Exercise sessions are described in Table 2. Exercise energy expenditures (EEE) were significantly greater in men than women (P < 0.05). EEE was calculated by subtracting the resting energy expenditure, calculated from the C trial, from the energy expenditure of the exercise sessions. Within men and within women, the EEE was matched between exercise trials in that there was no significant difference between the EEE for E45 and E65. There were no significant sex-related differences in heart rate response to either exercise intensity, although, as expected, heart rate was significantly higher (P < 0.05) at 65% than at 45%
 . As physical fitness (
 per unit fat free mass) was similar between men and women,
  was not significantly different between sexes during exercise when expressed per unit fat free mass (FFM) in either E45 or E65 (Table 2).
Table 2.
Characteristics of exercise bouts
45%
|
65%
|
|||
|---|---|---|---|---|
| Men | Women | Men | Women | |
%
|
46.7 ± 0.4† | 45.1 ± 0.8† | 66.1 ± 1.1 | 65.0 ± 0.5 |
 (l min−1) (l min−1) |
1.93 ± 0.11*† | 1.28 ± 0.08† | 2.72 ± 0.17* | 1.85 ± 0.12 |
 (ml kg−1 min−1) (ml kg−1 min−1) |
26.2 ± 0.9*† | 22.0 ± 1.3† | 36.9 ± 1.3* | 31.8 ± 1.7 |
 (ml kg FFM−1min−1) (ml kg FFM−1min−1) |
29.3 ± 1.0† | 28.3 ± 1.5† | 41.3 ± 1.5 | 40.8 ± 2.0 |
| Duration (min) | 89.4 ± 0.5† | 90.6 ± 0.8† | 60.5 ± 0.3 | 61.3 ± 0.6 |
| EEE (kcal) | 693.2 ± 40.3* | 444.7 ± 31.9 | 703.6 ± 41.5* | 440.3 ± 51.4 |
| Heart rate (bpm) | 125.4 ± 2.4† | 119.4 ± 4.6† | 159.2 ± 2.5 | 149.6 ± 5.0 |
Values are means ±s.e.m. Men, n = 10; women, n = 8.% , relative exercise intensity expressed as a percentage of peak O2 consumption; FFM, fat free mass; EEE, energy expenditure of exercise, adjusted by subtracting resting energy expenditure.
Significantly different between men and women, P < 0.05.
Significantly different from 65% trial, P < 0.05.
Metabolic rate
In men and women,  , and RER did not change significantly from 30 min postexercise to 150 min later at which point the D1 measurement period ended. Therefore, recovery time points from 30 min to 180 min postexercise were averaged for calculation of postexercise metabolic rate (Table 3). In the postexercise recovery period in women, the average energy expenditure in E45 and E65 was not significantly elevated above C on D1 or on the following morning (D2), and in fact did not even show a tendency toward elevation above C. Conversely, men showed a statistically significant elevation in energy expenditure that was an average elevation of 9% above C in both the E45 and E65 during the postexercise recovery period on D1 (P < 0.05), and on D2 the average elevation in men was 5% and approached statistical significance (P = 0.07). RER values in the context of energy substrate partitioning are addressed below, but in addressing energy expenditure values, it is important to note that since RER was altered after exercise and also across the day in C, the energy equivalent per unit of oxygen consumption would have changed slightly, and, therefore, we report energy expenditure in actual units of energy (kcal) rather than using oxygen consumption alone as a surrogate for metabolic rate during postexercise recovery. Nonetheless, the pattern of change in
  was qualitatively similar to the pattern of changes in EE that we report.
Table 3.
Metabolic rate and respiratory exchange ratio
| Men | Women | ||||
|---|---|---|---|---|---|
| Time | Trial | EE | RER | EE | RER |
| Pre-exercise | pooled | 1.45 ± 0.05 | 0.87 ± 0.01 | 1.17 ± 0.02 | 0.86 ± 0.01 |
| Exercise | 45% | 9.37 ± 0.54†‡* | 0.87 ± 0.01†‡ | 6.15 ± 0.38‡* | 0.83 ± 0.01‡ |
| 65% | 13.45 ± 0.83†* | 0.93 ± 0.01†* | 9.03 ± 0.57* | 0.89 ± 0.01* | |
| Recovery, day 1 | Con | 1.41 ± 0.06† | 0.81 ± 0.01 | 1.14 ± 0.04 | 0.80 ± 0.01 |
| 45% | 1.52 ± 0.06* | 0.78 ± 0.005* | 1.13 ± 0.02 | 0.78 ± 0.005* | |
| 65% | 1.53 ± 0.05* | 0.78 ± 0.01* | 1.13 ± 0.02 | 0.78 ± 0.01* | |
| Recovery, day 2 | Con | 1.29 ± 0.04† | 0.86 ± 0.01 | 1.11 ± 0.10 | 0.83 ± 0.01 |
| 45% | 1.36 ± 0.06 | 0.82 ± 0.01* | 1.09 ± 0.05 | 0.82 ± 0.005 | |
| 65% | 1.35 ± 0.05 | 0.84 ± 0.01 | 1.04 ± 0.04 | 0.82 ± 0.01 | |
Values are means ±s.e.m. Men, n = 10 for days 1 and 2. Women, n = 8 for day 1 and n = 6 for day 2. Con, Control trial; 45%, 45% trial; 65%, 65%
 trial. Recovery, day 1; average from 30 min postexercise to 180 min postexercise. Recovery, day 2; the next day following exercise bouts, ∼21 h after exercise. EE, rate of energy expenditure in kcal min−1; RER, respiratory exchange ratio.
Significantly different from corresponding time points in Control trial, P < 0.05. Exercise and Recovery Con were compared between men and women
significant difference, P < 0.05.
Significantly different from corresponding time points in 65% trial, P < 0.05.
Hormones
Over the course of the C trial, insulin decreased significantly in both sexes (P < 0.05), cortisol decreased significantly in men (P < 0.05), and growth hormone increased significantly in men (P < 0.05). The significant differences between sexes and trials are noted in Table 4. Of the hormones reported, the only finding of a significant postexercise elevation above C was the response of noradrenaline in the men in both E45 and E65 trials (P < 0.05).
Table 4.
Plasma hormone concentrations
| Time | Trial | Adrenaline (pg ml−1) | Noradr (pg ml−1) | Insulin (μIU ml−1) | hGH (ng ml−1) | Cortisol (μg dl−1) |
|---|---|---|---|---|---|---|
| Men | ||||||
| Pre-exercise | pooled | 61 ± 9 | 179 ± 10 | 5.5 ± 0.7 | 2.3 ± 0.5 | 13.5 ± 0.6 |
| Exercise | 45% | 199 ± 22* | 514 ± 36‡* | 2.4 ± 0.3 | 21.8 ± 2.1†* | 14.7 ± 1.6 |
| 65% | 295 ± 76†* | 1621 ± 303* | 2.5 ± 0.3 | 24.2 ± 2.8†* | 17.5 ± 1.6* | |
| Recovery | Con | 50 ± 7 | 160 ± 9† | 2.9 ± 0.2 | 5.9 ± 1.2 | 10.0 ± 0.7 |
| 45% | 62 ± 5 | 187 ± 12* | 2.8 ± 0.4 | 6.0 ± 1.4 | 10.1 ± 0.8 | |
| 65% | 58 ± 5 | 212 ± 18* | 2.9 ± 0.4 | 4.8 ± 0.6 | 10.8 ± 0.7 | |
| Women | ||||||
| Pre-exercise | pooled | 33 ± 5 | 141 ± 9 | 6.7 ± 1.3 | 6.4 ± 1.6 | 9.4 ± 1.0 |
| Exercise | 45% | 105 ± 33‡ | 476 ± 61‡* | 3.4 ± 0.4 | 8.3 ± 2.0 | 13.6 ± 8.4* |
| 65% | 164 ± 35* | 1175 ± 136* | 3.0 ± 0.3 | 9.9 ± 2.2 | 14.5 ± 1.7* | |
| Recovery | Con | 33 ± 6 | 128 ± 9 | 3.4 ± 0.4 | 3.9 ± 0.5 | 7.8 ± 1.0 |
| 45% | 31 ± 5 | 146 ± 16 | 3.1 ± 0.4 | 2.4 ± 0.3 | 8.4 ± 0.6 | |
| 65% | 37 ± 8 | 146 ± 16 | 3.3 ± 0.4 | 2.1 ± 0.2 | 9.0 ± 0.6 | |
Values are means ±s.e.m. Men, n = 10. Women, n = 8. Con, Control trial; 45%, 45% trial; 65%, 65%
 trial. Recovery, average from 30 min postexercise to 180 min postexercise. Noradr, noradrenaline. hGH, human growth hormone.
Significantly different from corresponding time points in Control trial, P < 0.05. Exercise and Recovery Con were compared between men and women
significant difference, P < 0.05.
Significantly different from corresponding time points in 65% trial, P < 0.05.
Metabolite concentrations
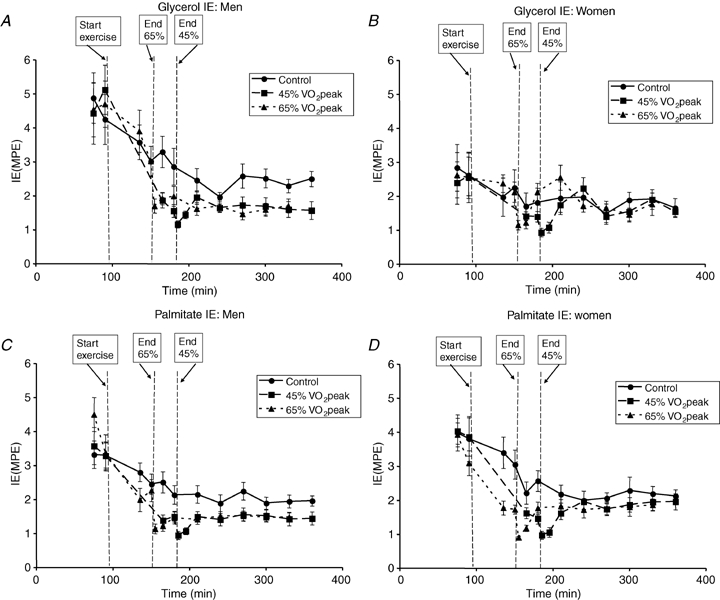
The blood glycerol concentration ([glycerol]) did not change significantly from the initial time points through the C trial in men (Fig. 2A) or women (Fig. 2B). The average [glycerol] was higher in women than men during C (P < 0.05), but was not significantly different during exercise bouts between sexes, although the tendency for women to have higher [glycerol] during exercise approached statistical significance during exercise in E65 (P = 0.07). In men, unlike in women, [glycerol] tended to be elevated above C during postexercise recovery and reached statistical significance as noted in Fig. 2A. Plasma FA concentration ([FA]) in men (Fig. 2C) and women (Fig. 2D) increased throughout the day in the C trial and was significantly elevated at time points corresponding to postexercise recovery in comparison to pre-exercise time points (P < 0.05). [FA] was not significantly different between men and women in C or during exercise in E45 or E65. While both men and women showed a significant increase in [FA] immediately after cessation of exercise bouts at 5 and 15 min postexercise, [FA] remained significantly elevated above C in men (P < 0.05) at every subsequent time point (Fig. 2C), but only remained significantly elevated at one single time point in E65 in women (Fig. 2D). Averaged from 30 to 180 min postexercise, the percentage elevation of [FA] in men was 70 ± 12% in E45 and 66 ± 10% in E65, which was significantly greater (P < 0.05) than in women in which the average elevation above C was not statistically significant.
Figure 2.
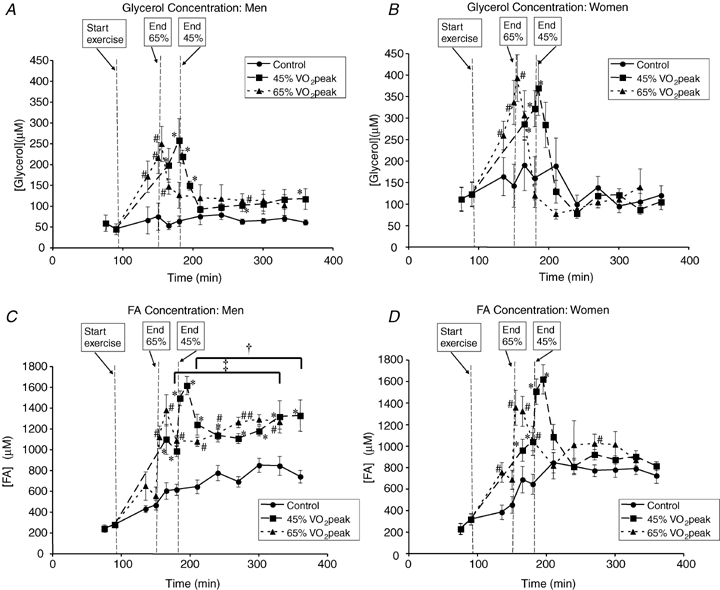
Metabolite concentrations A and B, blood glycerol concentration in men (A) and women (B). C and D, plasma FA concentration in men (C) and women (D). Values are means ±s.e.m. Men, n = 10; women, n = 8. Time (min), duration elapsed since beginning tracer infusion. *45% trial significantly different from corresponding time points in Control trial, P < 0.05. #65%
 trial significantly different from corresponding time points in Control trial, P < 0.05. †Average postexercise (30 min to 180 min postexercise) in 45%
 trial significantly different from corresponding average in Control trial, P < 0.05. ‡Average postexercise (30 min to 180 min postexercise) in 65%
 trial significantly different from corresponding average in Control trial, P < 0.05.
Metabolite kinetics
Blood [1,1,2,3,3-2H5]glycerol and plasma [1-13C]palmitate IEs are shown in Fig. 3. During the C trial, RaGL (lipolysis) increased significantly in men (P < 0.05), but not women, from the pre-exercise time period to the values corresponding to postexercise recovery; however, RaGL remained lower in men (Fig. 4A) than women (Fig. 4B) during the C trial (P < 0.05). Although RaGL was not significantly different between men and women during exercise in E45 (men, 9.5 ± 1.8 μmol kg−1 FFM min−1; women 11.7 ± 1.7 μmol kg−1 FFM min−1), RaGL was significantly higher in women than men during exercise in E65 (men, 7.2 ± 1.1 μmol kg−1 FFM min−1; women, 12.1 ± 2.4 μmol kg−1 FFM min−1, P < 0.05). RaGL returned immediately to C values in women after exercise, but the average RaGL was significantly elevated above C in men (P < 0.05) by 52 ± 16% in E45 and by 61 ± 28% in E65 and continued to rise over the 3 h recovery period in E45 without reaching a plateau. In men and in women, there was no effect of exercise intensity upon RaGL during or after exercise.
Figure 3.
Tracer isotopic enrichments A and B, blood [1,1,2,3,3-2H5]glycerol isotopic enrichment in men (A) and women (B). C and D, plasma [1-13C]palmitate isotopic enrichment in men (C) and women (D). Values are means ±s.e.m. Men, n = 10; women, n = 8. Time (min), duration elapsed since beginning tracer infusion. IE, isotopic enrichment. MPE, moles percent excess.
Figure 4.
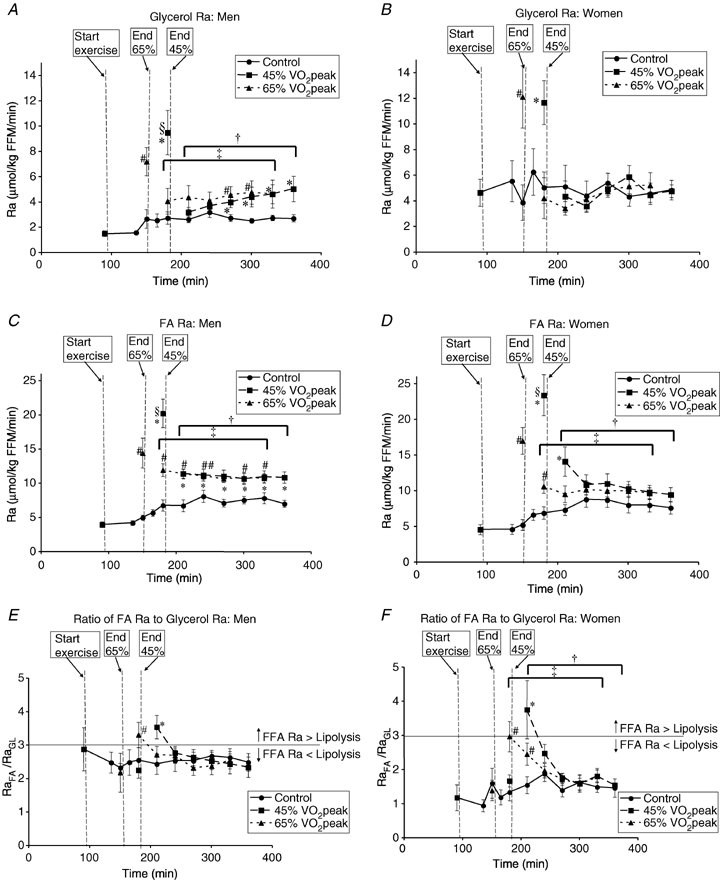
Metabolite kinetics A and B, glycerol Ra in men (A) and women (B). C and D, FA Ra in men (C) and women (D). E and F, ratio of glycerol Ra to FA Ra in men (E) and women (F). Values are means ±s.e.m. Men, n = 10; women, n = 8. Time (min), duration elapsed since beginning tracer infusion. Ra, rate of appearance. FFM, fat free mass. *45% trial significantly different from corresponding time points in Control trial, P < 0.05. #65%
 trial significantly different from corresponding time points in Control trial, P < 0.05. §45%
 trial significantly different from corresponding time points in 65%
 trial, P < 0.05. †Average postexercise (30 min to 180 min postexercise) in 45%
 trial significantly different from corresponding average in Control trial, P < 0.05. ‡Average postexercise (30 min to 180 min postexercise) in 65%
 trial significantly different from corresponding average in Control trial, P < 0.05.
In the C trial, RaFA in men (Fig. 4C) and women (Fig. 4D) increased significantly from the pre-exercise time points to the time points corresponding to postexercise recovery (P < 0.05) with no significant difference between men and women in C. During exercise, RaFA increased above C and was higher at 45% than at 65%
 in both men and women (P < 0.05), with no significant difference between sexes during exercise. Within both men and women, after exercise there was no significant difference between exercise trials with both showing the average postexercise RaFA as being significantly higher than the corresponding C value (P < 0.05). However, at individual time points, RaFA was only significantly elevated (P < 0.05) above corresponding time points in C at 30 min postexercise in women but was significantly elevated at every postexercise time point in men. Furthermore, the average postexercise RaFA was elevated above C to a relatively greater extent in men than in women following exercise at 45%
 (men, 54 ± 9%; women, 38 ± 8%, P < 0.05) and exercise at 65%
 (men, 56 ± 8%; women, 31 ± 11%, P < 0.05).
The ratio of FA Ra to glycerol Ra (RaFA/RaGL) was significantly higher in men (Fig. 4E) than women (Fig. 4F) in the C trial (P < 0.05). The ratio was not significantly different from C during exercise at either intensity in either sex. Furthermore, there were no differences between exercise intensities during exercise or recovery. In men, RaFA/RaGL was significantly higher than C at 30 min postexercise in both exercise trials (P < 0.05). In women, RaFA/RaGL was significantly higher than C at 30 min postexercise in the E45 and was significantly higher than C at 30 and 60 min postexercise in E65 (P < 0.05). The average postexercise RaFA/RaGL was not significantly different from C during postexercise recovery in men (C, 2.6 ± 0.2; E45, 2.7 ± 0.2; E65, 2.7 ± 0.2), but the average RaFA/RaGL was significantly elevated in women (P < 0.05) during postexercise recovery (C, 1.5 ± 0.1; E45, 2.2 ± 0.2; E65, 2.1 ± 0.2).
In comparison to RaFA, FA disposal (RdFA) results showed a similar pattern of relationships between exercise trials and sexes. Therefore, RdFA are not reported, but the percentage of RdFA that was oxidized (%Rdox), as derived from breath 13CO2 excretion, is reported to express the relative partitioning of FA disposal between storage and oxidation. The percentage of RdFA that was oxidized (%Rdox) significantly increased across the C trial (P < 0.05) from the pre-exercise time points (men, 11 ± 0.4%; women, 10 ± 0.9%) to the end of the trial (men, 34 ± 1%; women, 32 ± 2%) and average %Rdox in the C trial was not significantly different between men and women. The %Rdox increased during exercise in E45 (men, 85 ± 3%; women, 78 ± 3%) and E65 (men, 107 ± 4%; women 94 ± 6%), was significantly higher during exercise than C (P < 0.05), and in men and women %Rdox at 65% was significantly higher than that at 45%
 (P < 0.05) and was not significantly different from 100% during exercise in E65. Following cessation of exercise, %Rdox returned rapidly to C values and was not different from C by 30 min postexercise (in both sexes following exercise at either intensity) but increased transiently, but significantly above C (P < 0.05) in the 65%
 trial by approximately 10% Rdox in both sexes and then subsequently returned to C values for the remainder of the trial. The average postexercise %Rdox values for men were 29 ± 1%, 30 ± 1%, and 32 ± 1% in the C, E45 and E65 trials, respectively. The average postexercise %Rdox values for women were 27 ± 1%, 31 ± 2%, and 29 ± 1% in the C, E45 and E65 trials, respectively.
FA Rox increased significantly in men (Fig. 5A) and women (Fig. 5B) in the C trial from the pre-exercise time point to the time points corresponding to postexercise recovery (P < 0.05), which accounted for the drift in Lox because oxidation of non-plasma FA sources did not change significantly (Fig. 5). With no sex difference during exercise and also no effect of exercise intensity, FA Rox was elevated significantly above C during exercise in both men and women (P < 0.05), although the tracer-derived plasma FA oxidation measurement did not account for all of Lox and ‘other FA’ oxidation also increased (P < 0.05). The average FA Rox was significantly elevated above C in men during the postexercise period (Fig. 5A) by 64 ± 10% and 73 ± 8% in E45 and E65, respectively (P < 0.05). After exercise in women, the average FA Rox was elevated above C (Fig. 5B) by 58 ± 13% and 42 ± 16% in E45 and E65, respectively (P < 0.05). The relative elevation of FA Rox above C was not different between men and women. Oxidation of ‘other FA’, the portion of Lox not accounted for by the tracer-derived measurement, was not significantly different during recovery after exercise from during the C trial.
Figure 5.
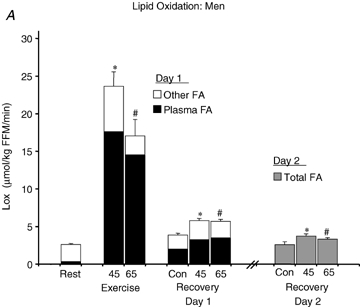
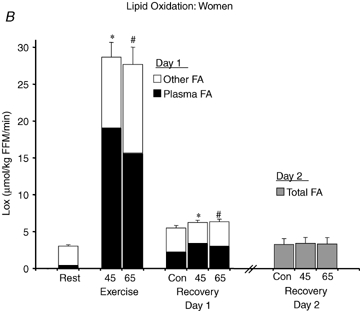
Lipid oxidation A and B, FA oxidation rate in men (A) and women (B). FA oxidation by a combination of tracer-derived measurement and indirect calorimetry on Day 1, and solely by indirect calorimetry on Day 2. Values are means ±s.e.m. Men, n = 10 for Days 1 and 2. Women, n = 8 for Day 1 and n = 6 for Day 2. Con, Control trial; 45, 45% trial; 65, 65%
 trial. Recovery, day 1; average from 30 min postexercise to 180 min postexercise. Recovery, Day 2; the next day following exercise bouts. *Total Lox in 45%
 trial significantly different from corresponding time points in Control trial, P < 0.05. #Total Lox in 65%
 trial significantly different from corresponding time points in Control trial, P < 0.05. Other FA oxidation was significantly elevated above Control during exercise at either intensity in both sexes (P < 0.05), but not during postexercise recovery. Plasma FA oxidation was elevated above Control during exercise and recovery for both exercise intensities.
FA MCR increased above corresponding values in C (men, 10.2 ± 0.6 ml kg−1 FFM min−1; women, 10.3 ± 0.6 ml kg−1 FFM min−1) during exercise at 45% (men, 21.2 ± 1.9 ml kg−1 FFM min−1; women, 22.2 ± 1.8 ml kg−1 FFM min−1, P < 0.05) and 65%
 (men, 27.2 ± 1.8 ml kg−1 FFM min−1; women, 27.0 ± 2.7 ml kg−1 FFM min−1, P < 0.05), and in men MCR at 65%
 was significantly greater than that at 45%
 (P < 0.05). There were no sex-related differences in MCR in the C trial or during exercise. During recovery, MCR returned rapidly in men to C levels by 30 min postexercise (the first postexercise kinetic data time point), and in women MCR returned more slowly, declining to C values by 60 min postexercise in E45 and by 90 min postexercise in E65.
Energy substrate oxidation
In men and women, RER (Table 3) decreased significantly across time in the C trial (P < 0.05). Accordingly, Lox increased (Fig. 5) and CHOox decreased significantly in the C trial (P < 0.05). During exercise, CHOox increased significantly above C in E45 (men, 19.3 ± 0.8 mg kg−1 FFM min−1; women, 14.4 ± 1.2 mg kg−1 FFM min−1, P < 0.05) and at 65% (men, 39.1 ± 1.3; women, 30.8 ± 2.4 mg kg−1 FFM min−1, P < 0.05). Although Lox was not significantly different between intensities during exercise (Fig. 5), CHOox was significantly higher during exercise at 65%
 than 45%
 in both sexes (P < 0.05), and men had a higher percentage of energy derived from CHO and a higher absolute rate per unit FFM than women at both exercise intensities (P < 0.05). As would be predicted from the RER data (Table 3), compared to men, women derived a larger percentage of energy from fat during exercise at 45%
 (men, 42 ± 3%; women, 55 ± 2%, P < 0.05) and 65%
 (men, 21 ± 2%; women, 36 ± 3%, P < 0.05) and both men and women derived a larger percentage of energy during exercise from fat during moderate-intensity (45%
 ) exercise than hard-intensity exercise (65%
 ).
).
In men and women, the average CHOox was significantly lower during 3 h of postexercise recovery than in C (P < 0.05) with no difference between E45 and E65, and the average Lox during recovery (Fig. 5) was significantly elevated above the C trial in both sexes (P < 0.05) with the relative elevation above C being greater in men than women in the E45 (men, 52 ± 10%; women, 16 ± 8%, P < 0.05) and E65 (men, 49 ± 8%; women, 17 ± 6%, P < 0.05). On D2, RER (Table 3) in men remained significantly lower than C in E45 (P < 0.05) and approached but did not reach a significantly lower value than C in E65 (P = 0.06). In men, with depressed RER values in combination with a tendency for metabolic rate to be higher on D2 (P = 0.07), Lox (Fig. 5) remained significantly higher than C (P < 0.05) in both exercise trials. Although CHOox values tended to be slightly lower than C in men, CHOox was not significantly depressed on D2. In women on D2 there were no significant changes in energy substrate oxidation.
Discussion
We provide data describing whole body lipolysis, FA mobilization, and partitioning of FA between storage and oxidation in men and women at rest, during exercise, and during the postexercise recovery period. We discuss these results in the context of modulation of lipolysis and FA mobilization by a prior exercise bout. Additionally, we attempt to resolve an apparent paradox regarding the sex difference in substrate oxidation during exercise, and we also discuss association between energy expenditure and lipid metabolism. The effects of exercise upon metabolism extend for hours after cessation of activity, and including the postexercise recovery period in the measurement of total effects of an exercise bout upon metabolism leads to enhanced understanding of energy substrate kinetics.
Interpretation of glycerol and FA production
As both glycerol and FA are liberated when triacylglycerol is hydrolysed, in our effort to rigorously evaluate lipid mobilization and metabolism during exercise and postexercise recovery, we have measured the kinetics of both glycerol and FA, rather than simply choosing one of the two metabolites. The relationship between the rate of systemic glycerol production (RaGL) and FA production (RaFA) is modulated by physiological variables such as nutritional state (Coppack et al. 1999; Jensen, 1999) and exercise intensity (Romijn et al. 1993; Friedlander et al. 1998, 1999). Although the ratio between RaFA and RaGL can vary under different conditions, the ratio typically remains below a value of 3. When lipolysis occurs, 3 FA and 1 glycerol are liberated from the complete hydrolysis of a TAG molecule. Therefore, if RaFA and RaGL were to reflect the rate of lipolysis to similar extents to one another, then the ratio between their Ras would be 3. That the ratio is typically below 3 is supportive of the notion that RaGL reflects the true whole body lipolytic rate more closely than does RaFA, which represents the resultant of lipolysis and other processes such as recycling via re-esterification. In line with this assumption of tissue FA recycling in a depot not reflected in the systemic RaFA, it has been shown that adipose tissue, the main lipid depot in the body, does not utilize free glycerol in vivo (Coppack et al. 1999) whereas FA can be re-esterified. With relevance to estimation of lipolysis with a glycerol tracer, it has been proposed that hepatic fractional extraction of glycerol might be relatively greater than fractional extraction of FA under certain physiological conditions (Jensen, 1999), and although there is still a measurable glycerol release from the splanchnic bed (Landau et al. 1996; Jensen, 1999), a concern is that lipolysis from within the splanchnic bed, and within the portion of abdominal adipose tissue draining into the splanchnic bed, would not be completely reflected in systemic RaGL. Also relevant to the issue of the use of glycerol tracer to estimate lipolysis are recent findings that intramuscular glycerol, and hence triacylglycerol, turnover occurs in working human muscle (Wallis et al. 2007). However, compared to use of a FA tracer, tracer-measured glycerol production still remains a more complete measure of lipolysis in muscle (Coppack et al. 1999; Jensen, 1999), adipose tissue (Coppack et al. 1999) and the organism as a whole (Romijn et al. 1993; Friedlander et al. 1998, 1999; Casazza et al. 2004; Jacobs et al. 2005) during conditions in which substrate kinetics are in a relatively steady state. Therefore, we consider measurement of RaGL to be the best strategy for measuring systemic lipolysis and we use glycerol Ra to represent the whole body lipolytic rate.
The early postexercise recovery period, being a time of changing metabolic rate and changing metabolite pool sizes, actually does represent an exception to the general observation that RaFA is typically less than or equal to 3 times RaGL. Arteriovenous sampling across adipose tissue in vivo (Hodgetts et al. 1991; Bülow et al. 2006) has shown a transient elevation of the ratio of FA to glycerol release, which can be larger than 3 for a brief period after exercise. This finding of adipose FA mobilization exceeding lipolysis in adipose tissue has been interpreted to mean that fatty acids accumulate in adipose tissue during exercise because lipolysis is high relative to limited transport capacity and accessibility to available binding sites on albumin (Hodgetts et al. 1991). Although this phenomenon is most pronounced in the early postexercise period, we consider it a possibility that temporal dissociation between lipolysis and FA mobilization might continue to some extent during the postexercise recovery period. This dissociation would make comparison between glycerol and FA kinetics important, but it would challenge the validity of calculating TAG/FA cycling/reesterification during the postexercise recovery period, a time when the intracellular FA pool sizes might be changing. Although the analysis of the FA/glycerol production ratio might be open to interpretation, it has in fact been shown that the rate of lipolysis does increase to a greater extent than adipose blood flow in men and women during exercise (Bülow et al. 2006).
Lipolysis and FA mobilization after exercise
Since lipolysis provides the substrate for FA mobilization, lipolysis and FA mobilization would reasonably be expected to follow similar qualitative patterns of change in response to a physiological stimulus. However, FA mobilization could also be affected by a change in intracellular handling of FA at the sites of lipolysis. Both lipolysis (Fig. 4A) and FA mobilization (Fig. 4C) were elevated in the postexercise recovery period in men, and plasma FA oxidation was also increased (Fig. 5A), leading to an elevation of total lipid oxidation after exercise. Hence, these data can be interpreted to describe a coordinated sequence of events initiated by lipolysis, leading directly to increased mobilization of FA, and subsequently to increased oxidation of FA. Women, on the other hand, showed elevated FA mobilization (Fig. 4D), subsequent oxidation of those FA (Fig. 5B), but no measurable change in lipolysis (Fig. 4B) during recovery. Notably, during postexercise recovery, women displayed an elevated ratio between RaFA and RaGL in comparison to the sedentary condition (Fig. 4F), potentially indicating a temporal dissociation between lipolysis and FA release into circulation. In addition to higher lipolysis in C, women had higher lipolysis than men during exercise in the E65 trial (P < 0.05). Although a component of the sex-related difference in lipolytic rate is independent of adiposity (Mittendorfer et al. 2001, 2002), higher lipolysis in women than men during rest and exercise might still be related to women having larger adipose tissue masses or regional distribution differences, and as well higher lipolysis and more adipose tissue could create the potential for a large intracellular adipose FA pool expansion during exercise, which would be dissipated out into the circulation during postexercise recovery, a time when adipose TAG synthesis would be expected to be waning (Park et al. 2002; Kump et al. 2006).
From the results obtained it is plausible that noradrenaline was involved in the elevated postexercise lipolysis in men (Kurpad et al. 1994; Quisth et al. 2005) (Table 4). It may also be that the greater growth hormone response in men than women during exercise (Table 4) could explain the elevation of lipolysis in men in recovery. Indeed, it has been proposed that growth hormone secretion during exercise could lead to elevated lipolysis in recovery, with the response of lipolysis being temporally dissociated from the rise in hormone concentration (Wee et al. 2005). Additionally, the increased FA utilization in recovery may have been related to depletion of CHO removing energy substrate competition between oxidative glycolysis and β-oxidation (Sidossis & Wolfe, 1996) or alternatively to stimulation of energy sensing pathways such as activation of AMPK in tissues such as muscle and liver (Park et al. 2002).
Sex difference in exercise substrate utilization: resolution of a paradox
In studies of energy substrate oxidation in exercising men and women, general findings have been that women derive a relatively larger proportion of energy expenditure from lipid than do men (e.g. Tarnopolsky et al. 1990; Phillips et al. 1993; Friedlander et al. 1998; Horton et al. 1998; Friedlander et al. 1999; Carter et al. 2001). Indeed, in agreement with previous investigations, in the present study we found women to derive a greater proportion of energy expenditure from lipid during exercise. From this finding, one might predict that women would be more successful than men in attaining a goal of decreased adiposity in response to an exercise training programme. Such is not the case in reality; women typically are less successful in achieving the goal of fat loss in response to exercise interventions (Ballor & Keesey, 1991; Donnelly & Smith, 2005). Therefore, ever since Tarnopolsky et al. (1990) reported the sex difference in exercise substrate oxidation, it has remained paradoxical that there is incongruence between fat oxidation during exercise and the ability to achieve negative fat balance in an exercise training programme. We believe that our present results address the issue and reconcile the apparent paradox. Although women oxidize relatively more lipid than men during exercise, there are substantial sex differences in lipid metabolism during the postexercise recovery period with differences in lipolysis (Fig. 4A and B), FA mobilization (Fig. 4C and D), and lipid oxidation (Fig. 5A and B) between sexes. The rate of lipolysis was significantly elevated above C during the postexercise recovery period in men (Fig. 4A) but not women (Fig. 4B), and FA mobilization was elevated to a greater extent in men (Fig. 4C) than women (Fig. 4D) after exercise. As well, the rate of total lipid oxidation was elevated to a relatively greater extent in men than women over 3 h of postexercise recovery. Furthermore, perhaps most importantly, lipid oxidation remained elevated even approximately 21 h after completion of exercise bouts (D2) in men but not women. Therefore, despite relatively less fat oxidation during exercise, exercise in men promotes fat mobilization and oxidation following exercise to a greater extent, and unlike women, men maintained higher fat oxidation even after consumption of meals and a night of sleep. It is likely that the sex difference that has been noted to take place during exercise with women having greater relative fat oxidation actually reverses over time in the postexercise recovery period. Reversal of sex-related differences during postexercise recovery serves as a reminder to consider the impact of exercise upon metabolism as a whole, not just during the exercise period, per se. Insight can be gained into the effects of physical activity upon energy metabolism when the impact of exercise is considered more broadly, including effects upon resting metabolism. For example, estimating total fuel mobilization during exercise from metabolite Ra and duration, the total 3 h recovery RaGL would increase the apparent total impact of exercise upon lipolysis by ∼40% in E45 and ∼110% in E65 in men, but no further increase would be measured in women during recovery; the total 3 h recovery RaFA would increase the apparent total impact of exercise upon FA mobilization beyond that measured during exercise by ∼60% in E45 and ∼120% in E65 in men, and in women by ∼30% in E45 and ∼50% in E65. Although we did not sample muscle tissue, it has been shown by others in studies comparing sexes that men have greater net utilization of skeletal muscle glycogen during exercise (Tarnopolsky et al. 1990) as well as a greater disturbance of skeletal muscle energy charge (Roepstorff et al. 2006b) whereas, alternatively, skeletal muscle in women displays a greater net utilization of intramuscular TAG during exercise (Roepstorff et al. 2006a). It is possible that the greater challenge to muscle energy charge during exercise (Roepstorff et al. 2006b) or greater glycogen depletion in men led to greater impact upon lipid metabolism after exercise, although it is also possible that energy substrate selection in non-muscle tissue was the site of elevated FA utilization in men, coupled with a coordinated increased mobilization of lipid fuel to meet demand.
Association between energy expenditure and lipid metabolism
We chose exercise intensities within the range of intensities expected to be associated with appreciable rates of lipid oxidation during activity, with metabolic rate elevated enough to have an impact upon total energy expenditure but not elevated so much that the balance of substrate utilization completely crosses over to carbohydrate (Brooks & Mercier, 1994; Brooks, 1997, 1998). Our experience is that 65% is near the maximal exercise intensity that non-athletes can reliably maintain for 1 h and therefore, while fulfilling the current recommendation of physical activity equivalent to exercise of 1 h per day (IOM, 2002), one would achieve a considerable impact upon energy expenditure. The percentage of energy from CHO was higher and percentage from lipid was lower in the 65%
 exercise than the 45%
 exercise, but the EEEs were matched.
The results regarding Lox in resting men and women (both with and without prior exercise) tend to correspond to the state of energy balance throughout the day. In both men and women, corresponding to the fall in insulin concentration across the day (Table 4) is a progressive increase in the mobilization and oxidation of plasma FA leading to increased total Lox. Therefore, as resting energy expenditure, in the absence of food intake, progressively drives energy balance toward a more negative state throughout the day in a sedentary condition, there is a progressive decrease in carbohydrate oxidation and a corresponding increasing in the mobilization and oxidation of FA. In the exercise trials, in which energy balance was relatively more negative than in the sedentary condition (∼700 kcal in men and ∼440 kcal in women), even though insulin was not lower than in the C trial after exercise, FA mobilization and plasma FA oxidation were increased. Furthermore, total EEE, and especially CHO-derived EEE, was larger in men and the increase in parameters of lipid metabolism, especially lipolysis, after exercise was also larger in men. Because the energy in carbohydrate fuel depots within the body is much less than that in the fat depots and CHO can deplete to an appreciable extent much more rapidly than can lipid, it may be understood that oxidative glycolysis slows across the C trial and more so during the postexercise recovery period, removing the inhibition of mitochondrial FA uptake and facilitating β-oxidation.
In addition to measuring metabolite kinetics with tracers, we also sought to extend our previous finding of elevated short-term (3 h) postexercise Lox (Kuo et al. 2005) by performing indirect calorimetry the morning following the exercise bouts or C period. The indirect calorimetry measurement on D2 was approximately 21 h after cessation of exercise bouts, and standardized meals were consumed following the exercise bout. Despite energy intake in the interim, lipid oxidation (Lox) remained elevated on D2 in men, although Lox was not elevated on D2 in women. Even though exercise, particularly if the intensity is challenging such as at 65% , raises CHOox more than it raises Lox during the actual activity, exercise acutely alters the state of energy balance which may be related to augmentation of Lox after exercise at rest while effects upon TEE persist.
Summary and conclusions
We have studied glycerol and FA kinetics at the level of the whole body that represents the sum of contributions from all lipid depots. The total impact of exercise upon the mobilization and utilization of lipid fuels is substantial because of altered FA metabolism in the postexercise recovery period. Furthermore, when the energy expenditures are matched between exercise bouts of different intensities, postexercise metabolism is more dependent upon the energy expenditure of exercise than on the intensity of the prior exercise. As well, lipid mobilization and metabolism are enhanced to a greater extent in men than in women during the postexercise recovery period.
Acknowledgments
We thank the study participants for their time and compliance with the protocol. We also thank Michael Ng, Steven Chang, Betty Liang, Martina Patella, Rowan Sill, Maggie Corr, Jonathan Maganus, and Zinta Zarins for providing laboratory support and Gareth Wallis for commenting on the manuscript. This work was supported by National Institute of Health grant AR0-42906 and by gifts from the Brian and Jennifer Maxwell Foundation and CytoSport, Inc.
References
- Anton AH, Sayre DF. A study of the factors affecting the aluminium oxide-trihydroxyindole procedure for the analysis of catecholamines. J Pharmacol Exp Ther. 1962;138:360–375. [PubMed] [Google Scholar]
- Ballor DL, Keesey RE. A meta-analysis of the factors affecting exercise-induced changes in body mass, fat mass, and fat-free mass in males and females. Int J Obes. 1991;15:717–726. [PubMed] [Google Scholar]
- Boon H, Blaak EE, Saris WHM, Keizer HA, Wagenmakers AJM, Van Loon LJC. Substrate source utilisation in long-term diagnosed type 2 diabetes patients at rest, and during exercise and subsequent recovery. Diabetologia. 2007;50:103–112. doi: 10.1007/s00125-006-0482-2. [DOI] [PubMed] [Google Scholar]
- Broeder CE, Brenner M, Hofman Z, Paijmans IJM, Thomas EL, Wilmore JH. The metabolic consequences of low and moderate intensity exercise with or without feeding in lean and borderline obese males. Int J Obes. 1991;15:95–104. [PubMed] [Google Scholar]
- Brooks GA. Importance of the ‘crossover’ concept in exercise metabolism. Clin Exp Pharmacol Physiol. 1997;24:889–895. doi: 10.1111/j.1440-1681.1997.tb02712.x. [DOI] [PubMed] [Google Scholar]
- Brooks GA. Mammalian fuel utilization during sustained exercise. Comp Biochem Physiol B Biochem Mol Biol. 1998;120:89–107. doi: 10.1016/s0305-0491(98)00025-x. [DOI] [PubMed] [Google Scholar]
- Brooks GA, Mercier J. The balance of carbohydrate and lipid utilization during exercise: The ‘crossover’ concept. J Appl Physiol. 1994;76:2253–2261. doi: 10.1152/jappl.1994.76.6.2253. [DOI] [PubMed] [Google Scholar]
- Brooks GA, Trimmer JK. Glucose kinetics during high-intensity exercise and the crossover concept. J Appl Physiol. 1996;80:1073–1075. doi: 10.1152/jappl.1996.80.3.1073. [DOI] [PubMed] [Google Scholar]
- Bülow J, Gjeraa K, Enevoldsen LH, Simonsen L. Lipid mobilization from human abdominal, subcutaneous adipose tissue is independent of sex during steady-state exercise. Clin Physiol Funct Imaging. 2006;26:205–211. doi: 10.1111/j.1475-097X.2006.00664.x. [DOI] [PubMed] [Google Scholar]
- Carlson MG, Snead WL, Campbell PJ. Fuel and energy metabolism in fasting humans. Am J Clin Nutr. 1994;60:29–36. doi: 10.1093/ajcn/60.1.29. [DOI] [PubMed] [Google Scholar]
- Carter SL, Rennie C, Tarnopolsky MA. Substrate utilization during endurance exercise in men and women after endurance training. Am J Physiol Endocrinol Metab. 2001;280:E898–E907. doi: 10.1152/ajpendo.2001.280.6.E898. [DOI] [PubMed] [Google Scholar]
- Casazza GA, Jacobs KA, Suh SH, Miller BF, Horning MA, Brooks GA. Menstrual cycle phase and oral contraceptive effects on triglyceride mobilization during exercise. J Appl Physiol. 2004;97:302–309. doi: 10.1152/japplphysiol.00050.2004. [DOI] [PubMed] [Google Scholar]
- Coppack SW, Persson M, Judd RL, Miles JM. Glycerol and nonesterified fatty acid metabolism in human muscle and adipose tissue in vivo. Am J Physiol Endocrinol Metab. 1999;276:E233–E240. doi: 10.1152/ajpendo.1999.276.2.E233. [DOI] [PubMed] [Google Scholar]
- DHHS; USDA. Dietary Guidelines for Americans. 6. Washington, DC: Government Printing Office; 2005. [Google Scholar]
- Donnelly JE, Smith BK. Is exercise effective for weight loss with ad libitum diet? Energy balance, compensation, and gender differences. Exerc Sport Sci Rev. 2005;33:169–174. doi: 10.1097/00003677-200510000-00004. [DOI] [PubMed] [Google Scholar]
- Fattor JA, Miller BF, Jacobs KA, Brooks GA. Catecholamine response is attenuated during moderateintensity exercise in response to the ‘lactate clamp’. Am J Physiol Endocrinol Metab. 2005;288:E143–E147. doi: 10.1152/ajpendo.00117.2004. [DOI] [PubMed] [Google Scholar]
- Frayn KN. Calculation of substrate oxidation rates in vivo from gaseous exchange. J Appl Physiol. 1983;55:628–634. doi: 10.1152/jappl.1983.55.2.628. [DOI] [PubMed] [Google Scholar]
- Friedlander AL, Casazza GA, Horning MA, Budinger TF, Brooks GA. Effects of exercise intensity and training on lipid metabolism in young women. Am J Physiol Endocrinol Metab. 1998;275:E853–E836. doi: 10.1152/ajpendo.1998.275.5.E853. [DOI] [PubMed] [Google Scholar]
- Friedlander AL, Casazza GA, Horning MA, Usaj A, Brooks GA. Endurance training increases fatty acid turnover, but no fat oxidation, in young men. J Appl Physiol. 1999;86:2097–2105. doi: 10.1152/jappl.1999.86.6.2097. [DOI] [PubMed] [Google Scholar]
- Friedlander AL, Jacobs KA, Fattor JA, Horning MA, Hagobian TA, Bauer TA, Wolfel EE, Brooks GA. Contributions of working muscle to whole body lipid metabolism are altered by exercise intensity and training. Am J Physiol Endocrinol Metab. 2007;292:E107–E116. doi: 10.1152/ajpendo.00148.2006. [DOI] [PubMed] [Google Scholar]
- Henderson GC, Fattor JA, Horning MA, Faghihnia N, Luke-Zeitoun M, Brooks GA. Retention of intravenously infused [13C]bicarbonate is transiently increased during recovery from hard exercise. J Appl Physiol. 2007 doi: 10.1152/japplphysiol.00309.2007. in press. [DOI] [PubMed] [Google Scholar]
- Hodgetts V, Coppack SW, Frayn KN, Hockaday TDR. Factors controlling fat mobilization from human subcutaneous tissue during exercise. J Appl Physiol. 1991;71:445–451. doi: 10.1152/jappl.1991.71.2.445. [DOI] [PubMed] [Google Scholar]
- Horning MA, Friedlander AL, Casazza GA, Huie MJ, Brooks GA. Arterial and ‘arterialized’ sampling sites do not change isotopic enrichment using [6,6-D-glucose] and [1,1,2,3,3-D-glycerol] FASEB J. 1998;12:A854. [Google Scholar]
- Horton TJ, Pagliassotti MJ, Hobbs K, Hill JO. Fuel metabolism in men and women during and after long-duration exercise. J Appl Physiol. 1998;85:1823–1832. doi: 10.1152/jappl.1998.85.5.1823. [DOI] [PubMed] [Google Scholar]
- IOM. Dietary Reference Intakes for Energy, Carbohydrate, Fiber, Fat, Fatty Acids, Cholesterol, Protein, and Amino Acids. Washington, DC: National Academies Press; 2002. [DOI] [PubMed] [Google Scholar]
- Jackson AS, Pollock ML. Generalized equations for prediction body density of men. Br J Nutr. 1978;40:497–504. doi: 10.1079/bjn19780152. [DOI] [PubMed] [Google Scholar]
- Jackson AS, Pollock ML, Ward A. Generalized equations for prediction body density of women. Med Sci Sports Exerc. 1980;12:175–181. [PubMed] [Google Scholar]
- Jacobs KA, Casazza GA, Suh SH, Horning MA, Brooks GA. Fatty acid reesterification but not oxidation is increased by oral contraceptive use in women. J Appl Physiol. 2005;98:1720–1732. doi: 10.1152/japplphysiol.00685.2004. [DOI] [PubMed] [Google Scholar]
- Jensen MD. Regional glycerol and free fatty acid metabolism before and after meal ingestion. Am J Physiol Endocrinol Metab. 1999;276:E863–E869. doi: 10.1152/ajpendo.1999.276.5.E863. [DOI] [PubMed] [Google Scholar]
- Klein S, Peters EJ, Holland OB, Wolfe RR. Effect of short- and long-term B-adrenergic blockade on lipolysis during fasting in humans. Am J Physiol Endocrinol Metab. 1989;257:E65–E73. doi: 10.1152/ajpendo.1989.257.1.E65. [DOI] [PubMed] [Google Scholar]
- Kump DS, Laye MJ, Booth FW. Increased mitochondrial glycerol-3-phosphase acyltransferase protein and enzyme activity in rat epididymal fat upon cessation of wheel running. Am J Physiol Endocrinol Metab. 2006;290:E480–E489. doi: 10.1152/ajpendo.00321.2005. [DOI] [PubMed] [Google Scholar]
- Kuo CC, Fattor JA, Henderson GC, Brooks GA. Lipid oxidation in fit young adults during postexercise recovery. J Appl Physiol. 2005;99:349–356. doi: 10.1152/japplphysiol.00997.2004. [DOI] [PubMed] [Google Scholar]
- Kurpad AV, Khan K, Calder AG, Elia M. Muscle and whole body metabolism after norepinephrine. Am J Physiol Endocrinol Metab. 1994;266:E877–E884. doi: 10.1152/ajpendo.1994.266.6.E877. [DOI] [PubMed] [Google Scholar]
- Landau BR, Wahren J, Previs SF, Ekberg K, Chandramouli V, Brunengraber H. Glycerol production and utilization in humans: sites and quantitation. Am J Physiol Endocrinol Metab. 1996;271:E1110–E1117. doi: 10.1152/ajpendo.1996.271.6.E1110. [DOI] [PubMed] [Google Scholar]
- Magkos F, Patterson BW, Mohammed BS, Mittendorfer B. A single 1-h bout of evening exercise increases basal FFA flux without affecting VLDL-triglyceride and VLDL-apolipoprotein B-100 kinetics in untrained men. Am J Physiol Endocrinol Metab. 2007;292:E1568–E1574. doi: 10.1152/ajpendo.00636.2006. [DOI] [PubMed] [Google Scholar]
- Magkos F, Wright DC, Patterson BW, Mohammed BS, Mittendorfer B. Lipid metabolism response to a single, prolonged bout of endurance exercise in healthy men. Am J Physiol Endocrinol Metab. 2006;290:E355–E362. doi: 10.1152/ajpendo.00259.2005. [DOI] [PubMed] [Google Scholar]
- Mittendorfer B, Horowitz JF, Klein S. Gender differences in lipid and glucose kinetics during short-term fasting. Am J Physiol Endocrinol Metab. 2001;281:E1333–E1339. doi: 10.1152/ajpendo.2001.281.6.E1333. [DOI] [PubMed] [Google Scholar]
- Mittendorfer B, Horowitz JF, Klein S. Effect of gender on lipid kinetics during endurance exercise of moderate intensity in untrained subjects. Am J Physiol Endocrinol Metab. 2002;283:E58–E65. doi: 10.1152/ajpendo.00504.2001. [DOI] [PubMed] [Google Scholar]
- Park H, Kaushik VK, Constant S, Prentki M, Przybytkowski E, Ruderman NB, Saha AK. Coordinate regulation of malonyl-CoA decarboxylase, sn-glycerol-3-phosphase acyltransferase, and acetyl-CoA carboxylase by AMP-activated protein kinase in rat tissues in response to exercise. J Biol Chem. 2002;277:32571–32577. doi: 10.1074/jbc.M201692200. [DOI] [PubMed] [Google Scholar]
- Phelain JF, Reinke E, Harris MA, Melby CL. Postexercise energy expenditure and substrate oxidation in young women resulting from exercise bouts of different intensity. J Am Coll Nutr. 1997;16:140–146. doi: 10.1080/07315724.1997.10718664. [DOI] [PubMed] [Google Scholar]
- Phillips SM, Atkinson SA, Tarnopolsky MA, MacDougall JD. Gender differences in leucine kinetics and nitrogen balance in endurance atheletes. J Appl Physiol. 1993;75:2134–2141. doi: 10.1152/jappl.1993.75.5.2134. [DOI] [PubMed] [Google Scholar]
- Quisth V, Enoksson S, Blaak EE, Hagstrom-Toft E, Arner P, Bolinder J. Major differences in noradrenaline action on lipolysis and blood flow rates in skeletal muscle and adipose tissue in vivo. Diabetologia. 2005;48:946–953. doi: 10.1007/s00125-005-1708-4. [DOI] [PubMed] [Google Scholar]
- Roepstorff C, Donsmark M, Thiele M, Vistisen B, Stewart G, Vissing K, Schjerling P, Hardie DG, Galbo H, Kiens B. Sex differences in hormone-sensitive lipase expression, activity, and phosphorylation in skeletal muscle at rest and during exercise. Am J Physiol Endocrinol Metab. 2006a;291:E1106–E1114. doi: 10.1152/ajpendo.00097.2006. [DOI] [PubMed] [Google Scholar]
- Roepstorff C, Thiele M, Hillig T, Pilegaard H, Richter EA, Wojtaszewski JFP, Kiens B. Higher skeletal muscle α2AMPK activation and lower energy charge and fat oxidation in men than in women during submaximal exercise. J Physiol. 2006b;574:125–138. doi: 10.1113/jphysiol.2006.108720. [DOI] [PMC free article] [PubMed] [Google Scholar]
- Romijn JA, Coyle EF, Sidossis LS, Gastaldelli A, Horowitz JF, Endert E, Wolfe RR. Regulation of endogenous fat and carbohydrate metabolism in relation to exercise intensity and duration. Am J Physiol Endocrinol Metab. 1993;265:E380–E391. doi: 10.1152/ajpendo.1993.265.3.E380. [DOI] [PubMed] [Google Scholar]
- Romijn JA, Coyle EF, Sidossis LS, Rosenblatt J, Wolfe RR. Substrate metabolism during different exercise intensities in endurance-trained women. J Appl Physiol. 2000;88:1707–1714. doi: 10.1152/jappl.2000.88.5.1707. [DOI] [PubMed] [Google Scholar]
- Romijn JA, Endert E, Saurwein HP. Glucose and fat metabolism during short-term starvation in cirrhosis. Gastroenterology. 1991;100:731–737. doi: 10.1016/0016-5085(91)80018-5. [DOI] [PubMed] [Google Scholar]
- Sidossis LS, Wolfe RR. Glucose and insulin-induced inhibition of fatty acid oxidation: the glucose-fatty acid cycle reversed. Am J Physiol Endocrinol Metab. 1996;270:E733–E738. doi: 10.1152/ajpendo.1996.270.4.E733. [DOI] [PubMed] [Google Scholar]
- Steele R. Influences of glucose loading and of injected insulin on hepatic glucose output. Ann N Y Acad Sci. 1959;82:420–430. doi: 10.1111/j.1749-6632.1959.tb44923.x. [DOI] [PubMed] [Google Scholar]
- Suh SH, Casazza GA, Horning MA, Miller BF, Brooks GA. Luteal and follicular glucose fluxes during rest and exercise in 3-h postabsorptive women. J Appl Physiol. 2002;93:42–50. doi: 10.1152/japplphysiol.01080.2001. [DOI] [PubMed] [Google Scholar]
- Tarnopolsky LJ, MacDougall JD, Atkinson SA, Tarnopolsky MA, Sutton JR. Gender differences in substrate for endurance exercise. J Appl Physiol. 1990;68:302–308. doi: 10.1152/jappl.1990.68.1.302. [DOI] [PubMed] [Google Scholar]
- Trimmer JK, Casazza GA, Horning MA, Brooks GA. Recovery of 13CO2 during rest and exercise after [1-13C]acetate, [2-13C]acetate, and NaH13CO3 infusions. Am J Physiol Endocrinol Metab. 2001;281:E683–E692. doi: 10.1152/ajpendo.2001.281.4.E683. [DOI] [PubMed] [Google Scholar]
- Van Hall G, Bülow J, Sacchetti M, Mulla NA, Lyngsø D, Simonsen L. Regional fat metabolism in human splanchnic and adipose tissues: the effect of exercise. J Physiol. 2002;543:1033–1046. doi: 10.1113/jphysiol.2002.022392. [DOI] [PMC free article] [PubMed] [Google Scholar]
- Wallis GA, Friedlander AL, Jacobs KA, Horning MA, Fattor JA, Wolfel EE, Lopaschuk GD, Brooks GA. Substantial working muscle glycerol turnover during two-legged cycle ergometry. Am J Physiol Endocrinol Metab. 2007 doi: 10.1152/ajpendo.00099.2007. in press. [DOI] [PubMed] [Google Scholar]
- Webber J, Taylor J, Greathead H, Dawson J, Buttery PJ, MacDonald IA. Effects of fasting on fatty acid kinetics and on the cardiovascular, thermogenic and metabolic responses to the glucose clamp. Clin Sci. 1994;87:697–706. doi: 10.1042/cs0870697. [DOI] [PubMed] [Google Scholar]
- Wee J, Charlton C, Simpson H, Jackson NC, Shojaee-Moradie F, Stolinski M, Pentecost C, Umpleby AM. GH secretion in acute exercise may result in post-exercise lipolysis. Growth Horm IGF Res. 2005;15:397–404. doi: 10.1016/j.ghir.2005.08.003. [DOI] [PubMed] [Google Scholar]
- Weststrate JA, Weys P, Poortvliet E, Deurenberg P, Hautvast JG. Lack of a systemic sustained effect of prolonged exercise bouts on resting metabolic rate in fasting subjects. Eur J Clin Nutr. 1990;44:91–97. [PubMed] [Google Scholar]
- Wolfe RR, Klein S, Carraro F, Weber J-M. Role of triglyceride-fatty acid cycle in controlling fat metabolism in humans during and after exercise. Am J Physiol Endocrinol Metab. 1990;258:E382–E389. doi: 10.1152/ajpendo.1990.258.2.E382. [DOI] [PubMed] [Google Scholar]
- Wolfe RR, Peters EJ, Klein S, Holland OB, Rosenblatt J, Gary H., Jr Effect of short-term fasting on lipolytic responsiveness in normal and obese human subjects. Am J Physiol Endocrinol Metab. 1987;252:E189–E196. doi: 10.1152/ajpendo.1987.252.2.E189. [DOI] [PubMed] [Google Scholar]
- Wolfe RR. Radioactive and Stable Isotope Tracers in Biomedicine: Principles and Practice of Kinetic Analysis. New York: Wiley-Liss; 1992. [Google Scholar]