

Abstract
With one billion people overweight worldwide, the need to identify risk factors and treatments for obesity is urgent. The present study determined whether rats genetically prone to diet-induced obesity (DIO) show preexisting differences in meal microstructure and are sensitive to central anorectic effects of corticotropin-releasing factor type 2 (CRF2) receptor stimulation. Male, selectively bred DIO rats and their diet resistant (DR) counterparts (n = 9/genotype) were weaned onto low-fat chow and compared as young adults for spontaneous or intracerebroventricular urocortin 2 administration-induced (0, 0.3, 1, 3 μg) differences in ingestion. DIO rats were hyperphagic selectively at the dark cycle onset, showing shorter latencies to initiate feeding, faster returns to eating following meal completion, and a lower satiety ratio than DR rats. At other times, DIO rats had briefer postmeal intervals, but ate smaller and briefer meals, resulting in normal intake. DIO rats also ate faster than DR rats. Urocortin 2 was less potent in DIO rats, ineffective at the 0.3 μg dose, but produced CRF2 antagonist-reversible anorexia at higher doses. Though heavier, chow-maintained DIO rats were proportionately as or more lean than DR rats. Thus, DIO rats showed signs of a preexisting, heritable deficit in the maintenance of postmeal satiety and a reduced sensitivity to anorectic CRF2 agonist stimulation. The meal patterns of DIO rats temporally resemble human ‘snacking’ behaviour, which predicts adult obesity. Because central CRF2 stimulation retains full anorectic efficacy at higher doses in the DIO model, manipulating this neuropeptidergic system might yield new therapeutic approaches for diet-induced obesity.
One billion people worldwide are now overweight or obese (Ogden et al. 2006). Genetic factors moderate susceptibility to obesity (Comuzzie & Allison, 1998), perhaps by altering the regulatory influence of neuropeptides (Adan, 2002) and peripheral feedback hormones (Drazen & Woods, 2003) on energy balance. Obese individuals are resistant to the weight-loss promoting properties of many molecules (Mann et al. 1988; Halaas et al. 1997; Niederau et al. 1997). While such resistance states can develop after obesity, central resistance to some anorexigens also is present before the onset of obesity in rats genetically prone to diet-induced obesity (Levin et al. 2003; Levin et al. 2004; Clegg et al. 2005; Irani et al. 2007). Such rats, and their counterpart diet resistant (DR) genotype, were selectively bred based on differential weight gain when fed a high-fat/high-energy diet and model the polygenic, heritable differences in vulnerability to diet-induced obesity seen in humans (Levin et al. 1997; Levin & Dunn-Meynell, 2002; Ricci & Levin, 2003). DIO rats fail to reduce intake adequately in response to high-energy diets, unlike DR rats, leading to obesity (Levin et al. 2003). However, when maintained on low-fat chow diets, DIO-prone rats do not become obese, showing normal feed efficiency, normal or marginally increased food intake (Ricci & Levin, 2003), and normal adiposity as compared to DR rats. Therefore, the preobese DIO rat may be a useful model for identifying preexisting, genetic differences in sensitivity to anorexigens, variations that may increase risk for hyperphagia and obesity. Conversely, anorectics that do retain efficacy in obesity-prone DIO rats might hold greater preventative/therapeutic potential than those that do not.
In outbred rats, intracerebroventricular (i.c.v.) infusion of corticotropin-releasing factor (CRF)/urocortin (Ucn) family peptides suppresses food intake and promotes negative energy balance through two G-protein coupled receptor subtypes (CRF1 and CRF2) (Richard et al. 2002; Zorrilla et al. 2003; Fekete & Zorrilla, 2007). Whereas obese animals are resistant to central leptin or insulin anorexia, chronic central infusion of subtype non-selective CRF receptor agonists reduces food intake and promotes weight loss not only in lean animals (Bradbury et al. 2000; Cullen et al. 2001), but equally or more so in animals that are obese due to leptin receptor mutation (Arase et al. 1989a; Rohner-Jeanrenaud et al. 1989; Heinrichs et al. 1996; Heinrichs et al. 2001) or ventromedial hypothalamic (VMH) lesions (Arase et al. 1989b). However, the functional sensitivity of central CRF/Ucn receptors in genetically selected DIO and DR rats, a polygenic model of obesity-proneness, is unknown.
The anorectic effectiveness of CRF2 receptors in obesity-prone rats is of particular interest. Central infusion of CRF1 agonists (CRF itself or Ucn 1) acutely suppresses feeding, but with accompanying anxiety-like and aversive states. In contrast, i.c.v. infusion of type 2 urocortins (Ucn 2, Ucn 3), preferential CRF2 agonists, can suppress intake with delayed onset (∼2–3 h) at doses that do not elicit malaise- or anxiety-like behaviour (Zorrilla et al. 2003). The codistribution of Ucns and CRF2 receptors in hypothalamic nuclei (e.g. VMH, arcuate) and the nucleus of the solitary tract (Fekete & Zorrilla, 2007), sites where local Ucn infusion suppresses food intake (Daniels et al. 2004; Fekete et al. 2007), suggests that Ucn–CRF2 systems control food intake. Perhaps accordingly, CRF2 knock-out (KO) mice eat more corn syrup-sweetened chow (Tabarin et al. submitted) and high-fat diet (Bale et al. 2003) than wild-type mice. Decreased CRF2 mRNA expression is present in the VMH of several animal models that display increased appetite and low central leptin or insulin signalling (Richard et al. 1996; Makino et al. 1998; Huang et al. 2006a), each of which is a characteristic of DIO rats. These results, in contrast to the reviewed efficacy of non-selective CRF receptor agonists in obesity models, suggest that DIO rats might show reduced potency or efficacy of central CRF2 anorectic action.
The present studies aimed to (1) identify intrinsic differences in the quantity or microstructure of chow and water intake between genetically selected DR and DIO rats; (2) compare the potency, efficacy, time course and microstructure mechanism of anorectic action of central administration of Ucn 2 between chow-maintained, genetically selected DR and DIO rats, and (3) determine whether observed anorectic effects of Ucn 2 were mediated by CRF2 receptors. Though Ucn 2 is a preferential CRF2 agonist, it might also act as direct CRF1 agonist at pharmacological doses (Hoare et al. 2005) or as an indirect CRF1 agonist due to its nanomolar affinity for the rodent CRF-binding protein (Jahn et al. 2004). It was hypothesized that DIO rats would show similar or only subtly greater spontaneous chow intake than DR rats. It was further hypothesized that i.c.v. Ucn 2 would retain anorectic efficacy in DIO rats, making them eat smaller and briefer meals more slowly (Inoue et al. 2003), but with diminished dose-potency as compared to DR rats. Finally, the anorectic effects of Ucn 2 were predicted to be reversed by cotreatment with astressin2-B (A2-B), a selective CRF2 antagonist (Rivier et al. 2002).
Methods
Subjects
The study used DIO and DR rats obtained from Charles River (Kingston, NY, USA). After the conclusion of these studies, Charles River discontinued these lines, but representatives of the founding colony are maintained by Dr Barry Levin (University of Medicine and Dentistry of New Jersey, Newark, NJ, USA) or available through the Rat Resource and Research Center (http://www.nrrrc.missouri.edu; RRRC:0044, Strain name: SDDIO/Rrrc).
Male DIO and DR rats (n = 9/genotype) were obtained at 24 days of age and group-housed on arrival in a 12 h: 12 h reverse-lighting cycle in a humidity- (60%) and temperature-controlled (22°C) vivarium. The rats had access to Harlan Teklad LM-485 Diet 7012 chow (65% of kcal from carbohydrate, 13% from fat, and 21% from protein; metabolizable energy = 3.41 kcal g−1; Harlan, Indianapolis, IN, USA) and water ad libitum for 3 weeks prior to the onset of microstructure training. After arrival, animals were left undisturbed for 1 week to acclimate to the vivarium, after which their food, water and body weights were recorded twice weekly. Experimental procedures adhered to the National Institutes of Health Guide for the Care and Use of Laboratory Animals (NIH Publication number 85-23, revised 1996) and the Principles of laboratory animal care (http://www.nap.edu/readingroom/bookslabrats) and were approved by the Institutional Animal Care and Use Committee of The Scripps Research Institute.
Drugs
Rat Ucn 2 (rUcn 2), A2-B (cyclo(31–34)[d-Phe11,His12, Nle17,CαMeLeu13,39,Glu31,Lys17,34]Ac-sauvagine8–40) and angiotensin II were synthesized by solid-phase methodology, characterized as previously described (Reyes et al. 2001; Rivier et al. 2002) and generously provided by Dr. Jean Rivier (The Salk Institute, La Jolla, CA, USA). Ucn 2 and A2-B were freshly dissolved in sterile water singly or as a cocktail (antagonist-reversal experiment) and then diluted with phosphate-buffered saline (PBS) to attain the desired concentrations in a final vehicle of 0.5 × PBS (pH 7.4). Angiotensin II was dissolved in 1 × PBS (pH 7.4).
Intracranial surgery and injection procedures
Rats were implanted with an i.c.v. guide cannula at 51–52 days of age, after having resided for 5–6 days in the microstructure enclosures (see below). Cannulae were directed at the third ventricle because type 2 urocortins suppress food intake in part via hypothalamic sites of action (Fekete et al. 2007). For cannulation, anaesthetized (isoflurane, 2–3% in oxygen) subjects were secured in a stereotaxic frame (David Kopf Instruments, Tujunga, CA, USA). Using sterile technique, a straight, stainless steel, 24-gauge guide cannula (Plastics One, Inc., Roanoke, VA, USA) was lowered above the third ventricle, terminating 3 mm above the final injection site, and anchored to the skull. The cannula was placed 0.8 mm posterior to bregma on the midline, terminating 3.5 mm below the outer surface of the skull with the interaural bar set at flat skull (dorsal/ventral: bregma = lamda). Coordinates (Wren et al. 2002) were based on the atlas of Paxinos & Watson (1986). A dummy stylet (Plastics One) maintained patency. After surgery, rats were returned to their microstructure enclosures, where they were allowed 1 week to recover, during which they were handled daily.
For testing, drug solutions or vehicle (2 μl) were injected manually over 1 min with a Hamilton microsyringe linked by PE 20 tubing to a 31-gauge stainless steel injector projecting 3 mm beyond the tip of the guide cannula. Injectors were left in place for 1 min for diffusion. Rats were maintained in familiar holding cages during the pretreatment interval and then returned to their enclosures, with monitoring of nose-pokes beginning immediately. Cannula placement and tissue integrity were functionally verified at the conclusion of all testing as a positive dipsogenic response (> 5 ml of water intake within 30 min) to i.c.v. angiotensin II (100 ng/2 μl).
Microstructural analysis of ingestion
Apparatus
To study the microstructure of ingestion, rats were individually housed in Plexiglas test cages (22 × 22 × 35 cm) equipped for this purpose (Zorrilla et al. 2005a; Cottone et al. 2007). Rats obtained individual chow pellets (45 mg precision 5TUM: carbohydrate 65.5% (kcal), fat 10.4%, protein 24.1%, 3.70 kcal g−1; Test Diet/Purina Mills, Inc., Richmond, IN, USA) from a trough replenished by an automated dispenser (Medical Associates, St Albans VT, USA). This diet consisted of Purina 5001 chow supplemented with binding agents, including 15% (w/w) corn syrup, to facilitate their compacting into precision pellets. The acquisition by rats of a pellet was detected by photobeams that were broken (0.5 s duration) when the animals displaced a freely swinging door to access the pellet in the trough. An additional pellet was not delivered until the door returned to a neutral position and a 3.25 s timeout period had elapsed to prevent duplicate pellet deliveries (timeout based on É. Fekete and E. P. Zorrilla, unpublished observations of interpellet intervals), allowing the study of feeding with pellet-to-pellet resolution. Water delivery (0.1 ml) into a reservoir was governed by a response-contingent solenoid (W. W. Grainger, Lincolnshire, IL, USA) activated by nose-poke interruption (0.5 s) of photobeams monitoring a separate hole, with a 1 s timeout period to prevent duplicate deliveries. Responses were recorded by an IBM PC-compatible microcomputer with 10 ms resolution.
Behavioural testing
Beginning from 47 days of age, rats lived in the microstructure enclosures continuously except for brief periods (30–60 min) immediately prior to the dark cycle onset, during which they were removed for apparatus maintenance. The dark cycle and test sessions began at 1000 h. Data collection began at 77 days of age, once animals had fully recovered from surgery and food intake had re-stabilized (< 15% variation for initial 12 h food intake across 3 consecutive days). One feeder broke during the analysis of DIO versus DR responses to Ucn 2 dose–response effects, resulting in one fewer DIO animal being tested during this period. Once the feeder was repaired, a previously trained DIO animal was re-stabilized and included for the antagonist-reversal study.
Baseline measures of differences in DIO versus DR food intakes and meal microstructure were calculated from consecutive test days during which rats (n = 9/genotype) were 77 and 78 days of age. Student's paired t tests showed no differences in any of the dependent measures across those two days, so measures from the two baseline days were averaged to obtain a more reliable estimate of ingestion (Zorrilla et al. 2005a).
To determine the effects of acute Ucn 2 infusion on ingestion, the same rats then received Ucn 2 (0, 0.3, 1, or 3 μg, i.c.v.) 10 min before testing. Doses, chosen per previous studies (Inoue et al. 2003; Zorrilla et al. 2004), were given within-subject in a balanced Latin square design with one intervening treatment-free day beginning from 79 days of age. Food and water intake were monitored as nose-poke responses for 23 h.
To determine the ability of A2-B to block the anorectic effects of Ucn 2, the same rats were then tested in a balanced Latin square design receiving each of the following single injection ‘cocktails’ (2 μl) with one intervening treatment-free day: vehicle, Ucn 2 (1 μg), A2-B (4 μg), and A2-B + Ucn 2. The Ucn 2 dose was chosen to reduce food intake reliably, but submaximally and comparably, in DIO and DR rats. The dose of A2-B was chosen based on previous work (Fekete et al. 2007), resulting in a ∼4: 1 antagonist: agonist molar ratio. Treatments were given 15 min before testing beginning at 111 days of age.
Meal pattern analysis
Microstructure analysis used a meal definition that recognizes the existence of prandial drinking within meals (Zorrilla et al. 2005a). For this, ln (loge) transformed frequency histograms of the duration of consecutive (uninterrupted by drinking) interfeeding intervals were constructed from nocturnal baseline data of DIO and DR rats (n = 3375 and 3907 interfeeding intervals, respectively) (Tolkamp & Kyriazakis, 1999). For both genotypes, this analysis revealed two distinct frequency distributions, with the much larger, faster distribution representing intrameal intervals and the slower distribution representing between-meal intervals. A value that lay between both distributions for both DIO and DR genotypes (300 s between feeding or drinking events) was defined as the threshold intermeal interval. Meals were defined to contain a minimum of 0.09 g of food (2 pellets), and descriptive statistics of average nocturnal and diurnal meal structure were then calculated separately. Parameters included the number of meals; the average size and duration of meals; the average intermeal interval; and the satiety ratio. Overall meal duration was calculated as the total interval from the first to last response of a meal, and duration of eating (or drinking) within the meal was calculated as the sum of the durations of bursts of eating (or drinking) where each burst's duration was defined as the interval from the first to last of consecutive responses for food (or water). Thus, transitions between eating and drinking were included in total meal duration, but not in the duration of eating or drinking. Meal sizes for eating and drinking were calculated separately as the average number of food or water-directed responses during meals. The intermeal interval was defined as the interval from the last response of a meal to the first response of the next meal. The satiety ratio (average intermeal interval/average meal size) represents the amount of postprandial non-eating time per unit food intake.
Within-meal microstructure analysis
To identify differences between DR versus DIO rats in the rate and regularity of eating within meals and to evaluate potential effects of Ucn 2 on the frequency and/or duration of pausing between pellets, analysis of the ln-transformed duration of consecutive (uninterrupted by drinking) within-meal interfeeding intervals (IFIs) was performed (Cottone et al. 2007). The mean, standard deviation, kurtosis and histogram entropy of the ln-transformed duration of each subject's consecutive interfeeding intervals was individually determined and then averaged across subjects. The normalized frequency histogram entropy (H) is a measure of categorical variability in the rate of ingestion (Shannon & Weaver, 1949) (contrasted from standard deviation, a measure of continuous variability) and was computed as follows:
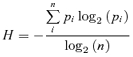 |
H is scaled between 0 and 1, with the denominator determined by the number of possible bins in the histogram (n) and the numerator a function of the proportion of observations that fall within a given histogram bin (pi). Minimal (H = 0) entropy occurs when all observations occur within a single histogram bin, whereas maximal entropy (H = 1) occurs when each histogram bin has an equal probability, or a flat uniform joint density distribution. For entropy analysis, histograms were constructed from log-transformed IFI that fell from e1.66 to e5.66 s (∼5.3–287.2 s), with a bin width of e0.2.
Significant increases in the standard deviation (a measure of continuous variability, reflected in the horizontal spread of the histogram) or histogram entropy (a measure of categorical variability, reflected in an increasing number of populated histogram bins, each with more similar event frequencies), would indicate a decreased regularity of intake. Conversely, a decrease in the kurtosis of the interpellet interval distribution (a measure of the distribution's ‘peakedness’, reflected in a flatter top and taller tails of the distribution), would be consistent with a decreased regularity of pellet-to-pellet feeding within meals.
Fat pad and body composition analysis
Two days following completion of the antagonist-reversal study, animals were killed at 121 days of age, and their frozen carcasses were shipped to the University of Alabama–Birmingham for chemical analysis of body composition. Carcasses were thawed (room temperature) and weighed to determine freezing-related water loss. Gastrointestinal tracts were removed to determine eviscerated weight. Inguinal (subcutaneous) and gonadal (intra-abdominal/visceral) fat pads were dissected, weighed, and returned to the carcass for composition analysis. Total body water, fat mass, and fat-free dry mass (FFDM) were determined using the method of Harris & Martin (1984).
Statistical analysis
To compare the time course of ingestion of DIO and DR rats, split-plot analyses of variance (ANOVAs) were performed on the incremental average nocturnal and diurnal intake of food during 1 h time bins from the two baseline days, with Genotype a between-subjects factor and Time a within-subject factor. Student's t test was used to identify genotype differences in the meal microstructure of food intake within the dark or light cycles, but Welch's t test was used to compare the latency to initiate the first meal due to significant heterogeneity of variance between genotypes. Based on results of time-course analyses, an additional split-plot ANOVA was performed to identify time-dependent genotype differences in meal microstructure between the early (0–2 h) versus late (2–12 h) parts of the dark phase, with Genotype a between-subjects factor and Time a within-subject factor.
To compare the time course of Ucn 2 anorexia between DIO and DR genotypes, a three-way repeated-measures (Dose and Time) ANOVA was performed on the incremental intake of food during 1 h time bins, with Genotype as a between-subject factor. Microstructure and interpellet interval frequency histogram measures were analysed by split-plot ANOVA with Dose a within-subject factor, and Genotype a between-subjects factor. Linear contrasts were performed to determine whether Ucn 2 treatment exerted a log-linear, dose–response effect on measures of ingestion. Secondary analyses compared the effects of Ucn 2 within the 0–2 and 2–7 h time bins because anorectic effects of type 2 urocortins are reportedly delayed by 2–3 h in outbred rats (Inoue et al. 2003; Ohata & Shibasaki, 2004; Fekete et al. 2007) and because of observed DIO/DR genotype differences in the time course of spontaneous ingestion. For similar reasons, in the antagonist reversal study, two-way (Agonist and Antagonist) repeated-measures ANOVAs were performed on the cumulative 2 h and 7 h intakes of each genotype. In all analyses, intermeal interval durations were transformed to logarithmic values to account for the ln-normal time scale of postmeal intervals (Tolkamp & Kyriazakis, 1999; Zorrilla et al. 2005a).
Genotype differences in body weight across the study period were analysed by a two-way ANOVA, with Age as a within-subject factor and Genotype as a between-subjects factor. The primary analysis of fat pad and whole carcass fat values involved analysis of covariance (ANCOVA) of the absolute tissue and fat mass weights, respectively, using body weight as a covariate. To allow comparison with other work, fat pad mass and whole carcass fat also were expressed as a percentage of body weight and analysed by Student's t test. However, as has been shown (Vickers, 2001; Senn, 2006), ANCOVA has several statistical properties that make it preferred to ratio/percentage-based normalization.
For post hoc interpretation of effects having more than two levels, Student–Newman–Keuls pairwise comparisons were used. Student's paired t test was used for within-subject factors having only two levels. The software packages used were Systat 11.0 (SPSS, Chicago, IL, USA), Excel 2003 11.0 (Microsoft, Redmond, WA, USA), SigmaPlot 9.0 (Systat Software, Inc., Point Richmond, CA, USA), and InStat 3.0 (GraphPad, San Diego, CA, USA).
Results
Spontaneous food intake in chow-fed DR and DIO rats
Time course of ingestion
Time course analysis of incremental 12 h nocturnal food intake revealed no main effect of Genotype [F1,16 = 0.54, P = 0.479], but a significant Hour × Genotype interaction [F11,165 = 2.58, P < 0.005]. Compared to their DR counterparts, DIO rats ate significantly more during the first 2 h of the dark cycle but compensated during subsequent hours, such that cumulative 12 h nocturnal food intake did not differ reliably between genotypes (Fig. 1). No genotype-related differences in incremental or cumulative food intake were evident during the light cycle (Fig. 1), and cumulative 23 h intake was equivalent between genotypes (not shown). Cumulative chow intake also did not differ reliably between genotypes after food intake was normalized for metabolic demands of different body weights per Kleiber's power function (Kleiber & Rogers, 1961) (DR versus DIO mean ± s.e.m. dark cycle: 47.2 ± 3.2 versus 42.5 ± 1.3; light cycle: 13.0 ± 1.5 versus 12.1 ± 1.2; 23 h period: 60.2 ± 3.8 versus 54.6 ± 1.2 kcal/kg0.75), consistent with previous findings (Ricci & Levin, 2003).
Figure 1. Cumulative nocturnal (left panel) and diurnal (right) food intake of non-deprived genetically selected diet-induced obesity-resistant (DR) and susceptible (DIO) male rats (n = 8–9/genotype).

Data represent the mean ± s.e.m. from the average of two consecutive 23 h sampling periods measured at 77–78 days of age. The symbol denotes a significant genotype difference, *P < 0.05 (between-subject Student's t test).
As shown in Table 1, genotypes were similar not only in the total quantity of food consumed within meals, but also in the total duration of eating. However, while DIO and DR rats drank similar quantities of water within meals, DIO rats took approximately two times longer to do so within the dark, but not light, phase, leading to an increased time spent drinking across the 23 h observation period (Table 1).
Table 1.
Baseline differences in prandial intake of genetically selected DR and DIO rats
| Parameter | Dark phase | Light phase | 23 h | |||
|---|---|---|---|---|---|---|
| DR | DIO | DR | DIO | DR | DIO | |
| Feeding | ||||||
| Intake (g) | 19.4 ± 1.1 | 20.1 ± 0.6 | 4.5 ± 0.5 | 4.4 ± 0.5 | 24.0 ± 1.3 | 24.5 ± 0.9 |
| Duration (min) | 85.4 ± 8.8 | 77.0 ± 6.9 | 21.6 ± 3.4 | 16.9 ± 1.6 | 106.9 ± 11.8 | 93.9 ± 7.4 |
| Drinking | ||||||
| Intake (ml) | 19.5 ± 2.3 | 21.2 ± 2.0 | 4.7 ± 1.0 | 3.1 ± 0.5 | 24.2 ± 3.3 | 25.0 ± 2.2 |
| Duration (min) | 35.5 ± 4.1 | 72.0 ± 10.0** | 10.7 ± 1.5 | 9.2 ± 1.3 | 46.3 ± 4.2 | 81.2 ± 10.2** |
Spontaneous prandial feeding and drinking of genetically selected diet-induced obesity-resistant (DR) and susceptible (DIO) rats. Data express the mean ± s.e.m. quantity or duration of food and water intake within meals of male DR (n = 9) and DIO (n = 8) rats during the dark cycle, light cycle or 23 h period and were calculated from the average of two consecutive 23 h sampling periods measured at 77–78 days of age.
P < 0.01 compared to DR rats (Student's t test).
Meal microstructure: genotype differences
As shown in Fig. 2, DIO rats ate more, but smaller and briefer, meals than did DR rats during both the dark and light cycles. DIO rats also initiated their first meal of the dark cycle earlier than did DR rats (mean ± s.e.m. 5.9 ± 1.8 versus 17.3 ± 4.4 min, Welch's t(10) = 2.37, P < 0.05). The decreased feeding latency, briefer post-meal intervals and increased meal frequency (Fig. 2) of DIO rats collectively suggest an increased probability of initiating meal-taking or decreased maintenance of post-meal satiety.
Figure 2. Spontaneous meal microstructure differences between genetically selected diet-induced obesity-resistant (DR) and susceptible (DIO) male rats.

Data represent the mean (+s.e.m.) average meal size for food, meal frequency, average intermeal interval, and average meal duration for food during the dark (left panels) and light (right) phases and were calculated from the average of two consecutive 23 h sampling periods measured at 77–78 days of age (n = 8–9 rats/genotype). Note ln scale of y-axis for intermeal interval duration, reflecting their time scale. Symbols denote significant genotype differences, *P < 0.05, **P < 0.01 (between-subjects Student's t test).
To explore why DIO rats ate more than DR rats early, but not later, in the dark cycle, separate meal pattern analyses were performed on the 0–2 h versus 2–12 h time intervals. As shown in Fig. 3, DIO rats only ate meals smaller and briefer than those of DR rats later in the dark cycle (2–12 h) (Time × Genotype interactions: meal size, F1,15 = 8.2, P < 0.05; meal duration, F1,15 = 5.0, P < 0.05). In contrast, intermeal intervals of DIO rats were briefer across both time periods (Genotype: F1,15 = 18.8, P < 0.001, no Time × Genotype interaction). Thus, within the first 2 h of the dark cycle, DIO rats initiated (latency) and re-initiated (intermeal interval) feeding earlier than did DR rats, but ate meals of normal size and duration, resulting in hyperphagia and a reduced satiety ratio (Fig. 3). In subsequent hours (2–12 h), DIO rats continued to initiate meals more frequently, but reduced the size and duration of their meals more than did DR rats, resulting in comparable intakes.
Figure 3. Meal microstructure differences between genetically selected diet-induced obesity-resistant (DR) and susceptible (DIO) rats within early and later portions of the dark cycle.

Data represent the mean +s.e.m. of average meal size and meal duration for food and intermeal interval duration during 0–2 h versus 2–12 h time intervals of the dark cycle and were calculated from the average of two consecutive 23 h sampling periods measured at 77–78 days of age (n = 8–9 male rats/genotype). Note ln scale of y-axis for intermeal interval duration, reflecting their time scale. Symbols denote significant differences: **P < 0.01 and ***P < 0.001 from the DR genotypes; #P < 0.05, ##P < 0.01 and ###P < 0.001 from the genotype's respective 0–2 h condition (Student's t test).
DIO rats ate faster within nocturnal and diurnal meals, evident as briefer mean ln-transformed interpellet intervals (Table 2). DIO rats also showed disproportionately more regular rates of fast, sustained eating within nocturnal meals than did DR rats, evident as a greater kurtosis of interpellet intervals (Table 2). Figure 4 illustrates the faster eating rate of DIO rats as a leftward shift and their more regular eating rate as an increased ‘peakedness’ (greater kurtosis, narrowed, taller distribution, with flattened tails) of the DIO genotype's relative frequency distribution of interfeeding intervals as compared to DR rats.
Table 2.
Baseline differences in the rate and regularity of food pellet consumption within meals in DR and DIO rats
| Dark phase | Light phase | |||
|---|---|---|---|---|
| Statistical parameter for inter–pellet interval | DR | DIO | DR | DIO |
| Mean | 2.44 (11.47) ± 0.07 | 2.27 (9.68) ± 0.07* | 2.52 (12.43) ± 0.06 | 2.36 (10.59) ± 0.07* |
| Standard deviation | 0.38 ± 0.01 | 0.42 ± 0.02 | 0.37 ± 0.03 | 0.36 ± 0.01 |
| Kurtosis | 8.35 ± 1.41 | 14.31 ± 2.86* | 5.32 ± 1.41 | 6.90 ± 2.04 |
| Entropy | 0.31 ± 0.01 | 0.30 ± 0.01 | 0.39 ± 0.01 | 0.38 ± 0.01 |
Rate and regularity of eating within meals in genetically selected diet-induced obesity-resistant (DR) and susceptible (DIO) rats. Statistical parameters (expressed as mean ± s.e.m.) describe the log-normal distribution of consecutive, nocturnal, within-meal interfeeding intervals (IFIs) of male DR and DIO rats (n = 8–9 genotype) studied on two consecutive days at 77–78 days of age. Parameters were calculated from the ln-transformed duration of interfeeding intervals. Therefore, the mean and s.e.m. are expressed in ln (s) units; the parenthetical value for the ‘Mean’ parameter represents the back-transformed average (s) to facilitate interpretation. For entropy analysis, histograms were constructed from log-transformed IFI that fell from e1.66 to e5.66 s (∼5.26–287.15 s), with a bin width of e0.2. Asterisks denote significant differences:
P < 0.05 compared to DR rats (Student's t test).
Figure 4. Relative frequency histogram of the ln-transformed duration of consecutive, within-meal interfeeding intervals (IFIs) in male genetically selected diet-induced obesity-resistant (DR) (top panel) and susceptible (DIO) rats (middle panel) during the dark cycle. The bottom panel overlays the summary Gaussian fits of each genotype's relative frequency histogram.

The frequency histogram shows consecutive interfeeding intervals that were between e1 and e4 s in duration (2.7–54.6) with a bin width of e0.1. This time scale focuses on the intervals of sustained eating, as represented in the peak. The tail that extends to the right of the distribution putatively represents within-meal pauses. Data represent consecutive nocturnal interfeeding intervals measured during two 12 h sampling intervals in 77- to 78-day-old genetically selected DR and DIO rats (n = 8–9 male rats/genotype). Note ln-scale of x-axis.
Ucn 2 anorexia in chow-fed DR and DIO rats
Effects of Ucn 2 on food intake: time course
Figure 5 shows that injection of Ucn 2 into the third ventricle reduced nocturnal food intake of both DIO and DR rats (Dose: F3,45 = 10.88, P < 0.001) with similar anorexia observed in both genotypes at the 3 μg dose. Thus, Ucn 2 retained central anorectic efficacy in DIO rats. However, Ucn 2 may have been slightly less potent in DIO rats than in DR rats; the 0.3 μg dose significantly reduced food intake in DR rats, but not in DIO rats (Fig. 5), resulting in a trend (P = 0.08) for a Dose × Genotype interaction. Cumulative Ucn 2 anorexia was maintained through the end of the dark (Fig. 4) and light cycles (not shown), with no compensation or rebound of intakes. The onset of significant Ucn 2 cumulative anorexia occurred earlier in DIO rats than DR rats (second versus third postinjection hours, respectively; Fig. 5). For both genotypes, incremental anorexia was greatest during the first 7 h of the observation period (Fig. 5, inset). Cumulative anorexia also most reliably differed, per inferential analyses, after 7 h, so microstructure analyses were limited to this period. Similar to untreated conditions, vehicle-treated DIO rats over-ate during the first 2 h of the dark cycle as compared to DR rats (+ 31%).
Figure 5. Dose-dependent effects of third ventricle Ucn 2 administration on the mean (+s.e.m.) cumulative nocturnal food intake of genetically selected diet-induced obesity-resistant (DR) (left panel) and susceptible (DIO) (right) rats.

Adult male rats (n = 8–9/genotype) were pretreated (−10 min) with Ucn 2 in a balanced Latin square design with test sessions beginning at the onset of the dark cycle. Insets depicts the mean of the cumulative difference from vehicle condition. Scale in insets differs from that of main panel. Letters denote significant differences of the vehicle condition from (a) 0.3 μg, (b) 1 μg, (c) 3 μg doses (P < 0.05, within-subjects Newman–Keuls test).
Table 3 shows that Ucn 2 reduced the quantity (Dose: F3,45 = 9.15, P < 0.001) and duration (Dose: F3,45 = 7.86, P < 0.001) of 7 h food intake in both genotypes. However, whereas Ucn 2 treatment in DIO rats already reduced these measures in a log-linear dose–responsive fashion by 2 h post-treatment, this was not the case for DR rats. Ucn 2 treatment also dose-dependently reduced the quantity (Dose: F3.45 > 7.35; P < 0.001) and duration of drinking within meals (Dose: F3,45 = 9.20, P < 0.001) (Table 3).
Table 3.
Effects of i.c.v Ucn 2 on 7 h prandial intake in genetically selected DIO and DR rats
| Parameter | 0–2 h | 2–7 h | 0–7 h | |||
|---|---|---|---|---|---|---|
| DR | DIO | DR | DIO | DR | DIO | |
| Feeding | ||||||
| Intake (g) | ||||||
| ANOVA | — | — | ## | # | # | ## |
| Linear contrast | — | † | †† | †† | †† | — |
| 0 μg | 4.6 ± 0.6 | 6.4 ± 0.9 | 6.8 ± 0.5 | 5.0 ± 0.5 | 11.4 ± 0.9 | 11.4 ± 0.6 |
| 0.3 μg | 5.1 ± 0.7 | 3.7 ± 0.7 | 3.7 ± 0.7** | 4.2 ± 0.6 | 8.8 ± 0.8 | 10.3 ± 1.3 |
| 1 μg | 3.8 ± 0.6 | 3.7 ± 0.8 | 3.7 ± 0.8** | 3.8 ± 0.6 | 7.5 ± 0.8* | 7.9 ± 1.2* |
| 3 μg | 3.6 ± 0.3 | 3.6 ± 0.9 | 3.6 ± 0.9* | 2.7 ± 0.5* | 7.2 ± 1.1* | 7.1 ± 1.1* |
| Duration (min) | ||||||
| ANOVA | — | — | ## | — | # | # |
| Linear contrast | — | † | †† | — | †† | — |
| 0 μg | 20.0 ± 2.6 | 25.0 ± 3.1 | 30.7 ± 2.4 | 20.2 ± 3.5 | 50.7 ± 3.9 | 45.1 ± 3.7 |
| 0.3 μg | 23.0 ± 2.5 | 23.6 ± 2.6 | 19.1 ± 4.4** | 15.6 ± 2.7 | 42.1 ± 4.7 | 39.2 ± 3.8 |
| 1 μg | 18.0 ± 3.5 | 17.1 ± 3.8 | 18.4 ± 4.0* | 16.9 ± 2.5 | 36.4 ± 5.4* | 34.0 ± 3.5 |
| 3 μg | 17.3 ± 1.4 | 17.4 ± 4.5 | 16.7 ± 3.7** | 14.0 ± 1.9 | 34.1 ± 4.1* | 31.4 ± 3.8* |
| Drinking | ||||||
| Intake (ml) | ||||||
| ANOVA | # | — | ## | # | ## | # |
| Linear contrast | †† | — | ††† | †† | ††† | †† |
| 0 μg | 3.9 ± 1.2 | 4.8 ± 0.6 | 11.6 ± 2.2 | 10.1 ± 1.0 | 7.7 ± 1.3 | 5.3 ± 0.7 |
| 0.3 μg | 3.4 ± 1.0 | 4.8 ± 0.9 | 8.1 ± 1.8* | 9.7 ± 1.3 | 4.7 ± 1.2 | 4.9 ± 0.9 |
| 1 μg | 2.2 ± 0.7 | 3.3 ± 1.0 | 5.5 ± 1.4** | 6.5 ± 1.7 | 3.3 ± 1.0** | 3.2 ± 1.1 |
| 3 μg | 1.0 ± 0.2* | 3.6 ± 1.4 | 3.9 ± 1.0** | 5.6 ± 1.5 | 2.9 ± 0.8** | 2.0 ± 0.7 |
| Duration (min) | ||||||
| ANOVA | — | # | # | — | ## | ## |
| Linear contrast | † | † | †† | † | †† | †† |
| 0 μg | 7.8 ± 2.0 | 11.4 ± 2.3 | 11.8 ± 2.0 | 15.3 ± 2.6 | 19.6 ± 3.5 | 26.7 ± 3.7 |
| 0.3 μg | 5.9 ± 1.6 | 15.7 ± 2.6 | 6.8 ± 1.7* | 10.5 ± 1.9 | 12.7 ± 2.6 | 26.2 ± 3.1 |
| 1 μg | 5.9 ± 1.4 | 8.0 ± 1.8 | 5.6 ± 1.8* | 8.1 ± 3.0 | 11.5 ± 1.8 | 16.1 ± 2.7 |
| 3 μg | 2.7 ± 1.0 | 6.7 ± 3.2 | 4.7 ± 1.2* | 5.1 ± 2.2 | 7.4 ± 1.8** | 11.8 ± 3.1* |
Effect of third ventricle Ucn 2 treatment on nocturnal prandial ingestion of genetically selected diet-induced obesity-resistant (DR) and susceptible (DIO) rats. Data express the mean ± s.e.m. quantity or duration of food and water intake within meals of adult male DR (n = 9) and DIO (n = 8) rats during the first 7 h of the dark cycle following Ucn 2 pretreatment. Subjects were pretreated (−10 min) with Ucn 2 in a balanced Latin square design with test sessions beginning at the onset of the dark cycle. Symbols denote significant differences:
P < 0.05
P < 0.01 from the respective vehicle condition (within-subject Newman–Keuls test)
P < 0.05
P < 0.01 denote a significant main effect of Ucn 2 (ANOVA)
P < 0.05
P < 0.01
P < 0.001 denote a significant log-linear, dose-dependent effect of Ucn 2 (Linear contrast ANOVA).
Effects of Ucn 2 on meal microstructure in DIO and DR rats
Table 4 shows that Ucn 2 treatment decreased 7 h food intake by reducing how much food was eaten in a meal (Dose: F3,45 = 9.34, P < 0.001), rather than by reducing the frequency of meal-taking or increasing the time that passed between meals. Ucn 2 infusion also made rats eat briefer meals (Dose: F3,45 = 5.82, P < 0.01). Ucn 2′s greater initial (0–2 h) anorectic effect in DIO versus DR rats occurred because, during the first 2 h, the peptide reduced meal size more effectively in DIO rats than in DR rats (linear contrast Dose*Genotype interaction, F1,15 = 4.44, P = 0.05). Ucn 2 altered microstructure similarly in both genotypes during the subsequent 2–7 h time period (Table 3). Consistent with Ucn 2′s delayed onset of anorectic action, the peptide did not affect the latency to initiate feeding (not shown). Ucn 2 also reduced how much (Dose: F3,45 = 11.13, P = 0.001) and for how long (Dose: F3,45 = 6.72, P = 0.01) subjects drank within a meal.
Table 4.
Effects of i.c.v. Ucn 2 on 7 h meal microstructure in genetically selected DIO and DR rats
| Parameter | 0–2 h | 2–7 h | 0–7 h | |||
|---|---|---|---|---|---|---|
| DR | DIO | DR | DIO | DR | DIO | |
| Feeding | ||||||
| Avg meal size (g) | ||||||
| ANOVA | — | # | — | — | # | ## |
| Linear contrast | — | † | † | † | †† | †† |
| 0 μg | 2.6 ± 0.3 | 3.0 ± 0.5 | 2.6 ± 0.2 | 2.1 ± 0.3 | 2.5 ± 0.1 | 2.3 ± 0.3 |
| 0.3 μg | 2.6 ± 0.4 | 3.2 ± 0.7 | 2.2 ± 0.3 | 1.8 ± 0.2 | 2.4 ± 0.2 | 2.2 ± 0.3 |
| 1 μg | 1.8 ± 0.3 | 1.7 ± 0.4 | 1.7 ± 0.3 | 1.3 ± 0.2 | 1.8 ± 0.2* | 1.5 ± 0.2* |
| 3 μg | 2.3 ± 0.4 | 1.3 ± 0.3* | 1.5 ± 0.3 | 1.1 ± 0.2 | 1.8 ± 0.2* | 1.2 ± 0.2* |
| Meal frequency (min) | ||||||
| ANOVA | — | — | — | — | — | — |
| Linear contrast | — | — | — | — | — | — |
| 0 μg | 1.9 ± 0.3 | 2.5 ± 0.4 | 2.7 ± 0.2 | 2.8 ± 0.5 | 4.6 ± 0.3 | 5.3 ± 0.5 |
| 0.3 μg | 2.1 ± 0.3 | 2.4 ± 0.4 | 1.8 ± 0.3 | 2.6 ± 0.6 | 3.9 ± 0.5 | 5.0 ± 0.6 |
| 1 μg | 2.1 ± 0.1 | 2.5 ± 0.2 | 2.3 ± 0.4 | 3.0 ± 0.4 | 4.4 ± 0.4 | 5.5 ± 0.4 |
| 3 μg | 1.8 ± 0.2 | 3.0 ± 0.5 | 2.3 ± 0.4 | 2.5 ± 0.4 | 4.1 ± 0.5 | 5.5 ± 0.7 |
| Avg intermeal interval (min) | ||||||
| ANOVA | — | — | — | — | — | — |
| Linear contrast | — | — | — | — | — | — |
| 0 μg | 43.5 + 7.8 | 22.4 + 3.5 | 102.5 + 10.9 | 70.8 + 29.0 | 83.0 + 8.2 | 63.9 + 14.2 |
| 0.3 μg | 45.4 + 11.3 | 28.6 + 7.1 | 94.8 + 15.6 | 69.5 + 27.3 | 104.4 + 22.0 | 65.8 + 14.4 |
| 1 μg | 51.5 + 4.4 | 30.5 + 6.3 | 104.8 + 22.5 | 85.6 + 16.1 | 79.1 + 9.0 | 68.8 + 3.8 |
| 3 μg | 44.8 + 5.3 | 19.6 + 2.8 | 91.8 + 25.4 | 69.2 + 19.6 | 96.3 + 21.1 | 65.1 + 14.9 |
| Avg meal duration (min) | ||||||
| ANOVA | — | — | — | — | # | — |
| Linear contrast | — | † | — | — | †† | † |
| 0 μg | 11.6 ± 1.2 | 11.3 ± 1.8 | 11.7 ± 0.8 | 8.7 ± 1.9 | 11.2 ± 0.7 | 9.2 ± 1.2 |
| 0.3 μg | 12.1 ± 1.8 | 12.3 ± 2.7 | 11.3 ± 1.9 | 6.7 ± 1.0 | 11.6 ± 1.3 | 8.2 ± 1.0 |
| 1 μg | 8.8 ± 1.8 | 7.0 ± 1.5 | 8.4 ± 1.5 | 5.9 ± 0.8 | 8.5 ± 1.3* | 6.5 ± 0.8 |
| 3 μg | 10.5 ± 0.9 | 5.2 ± 0.8 | 7.4 ± 1.6 | 6.4 ± 1.1 | 8.5 ± 0.8* | 6.1 ± 0.7 |
| Eating rate (mg s−1) | ||||||
| ANOVA | — | — | — | — | — | # |
| Linear contrast | — | — | — | — | — | †† |
| 0 μg | 3.8 ± 0.3 | 4.4 ± 0.3 | 3.8 ± 0.3 | 4.4 ± 0.4 | 3.8 ± 0.3 | 4.4 ± 0.3 |
| 0.3 μg | 3.7 ± 0.3 | 4.4 ± 0.3 | 3.5 ± 0.3 | 4.6 ± 0.3 | 3.6 ± 0.3 | 4.3 ± 0.3 |
| 1 μg | 3.7 ± 0.4 | 3.8 ± 0.4 | 3.6 ± 0.4 | 3.9 ± 0.5 | 3.7 ± 0.3 | 3.8 ± 0.4 |
| 3 μg | 3.6 ± 0.3 | 4.0 ± 0.4 | 5.5 ± 2.1 | 3.2 ± 0.6 | 3.6 ± 0.3 | 3.5 ± 0.5 |
| Drinking Avg meal size (ml) | ||||||
| ANOVA | # | — | ## | — | ### | # |
| Linear contrast | †† | † | †† | † | ††† | †† |
| 0 μg | 1.8 ± 0.5 | 2.3 ± 0.6 | 2.9 ± 0.4 | 2.3 ± 0.4 | 2.5 ± 0.4 | 2.1 ± 0.4 |
| 0.3 μg | 1.4 ± 0.5 | 2.3 ± 0.5 | 2.7 ± 0.7 | 2.1 ± 0.3 | 2.0 ± 0.5 | 2.0 ± 0.2 |
| 1 μg | 1.1 ± 0.4 | 1.4 ± 0.4 | 1.4 ± 0.4* | 1.1 ± 0.4 | 1.3 ± 0.3** | 1.2 ± 0.3 |
| 3 μg | 0.7 ± 0.2* | 0.9 ± 0.3 | 1.3 ± 0.4* | 0.9 ± 0.3 | 1.0 ± 0.2*** | 1.0 ± 0.2 |
| Avg meal duration (min) | ||||||
| ANOVA | — | # | — | — | # | # |
| Linear contrast | — | †† | † | † | † | †† |
| 0 μg | 4.0 ± 0.9 | 6.2 ± 2.0 | 4.4 ± 0.6 | 6.8 ± 1.6 | 4.2 ± 0.6 | 5.7 ± 1.5 |
| 0.3 μg | 2.5 ± 0.7 | 8.3 ± 2.7 | 4.0 ± 1.0 | 4.6 ± 0.9 | 3.2 ± 0.7 | 5.5 ± 0.7 |
| 1 μg | 2.9 ± 0.7 | 3.4 ± 0.9 | 2.3 ± 0.7 | 2.8 ± 1.0 | 2.7 ± 0.5 | 3.0 ± 0.5 |
| 3 μg | 1.8 ± 0.8 | 1.6 ± 0.6 | 2.3 ± 0.5 | 2.5 ± 1.1 | 1.8 ± 0.4 | 2.4 ± 0.7 |
| Drinking rate (μl s−1) | ||||||
| ANOVA | — | — | — | — | — | — |
| Linear contrast | — | — | — | — | — | — |
| 0 μg | 8.5 ± 1.2 | 10.5 ± 3.2 | 11.1 ± 0.6 | 6.3 ± 0.9 | 10.2 ± 0.7 | 6.8 ± 1.0 |
| 0.3 μg | 9.7 ± 1.0 | 5.6 ± 0.9 | 11.5 ± 0.4 | 7.8 ± 0.6 | 10.4 ± 1.0 | 6.3 ± 0.6 |
| 1 μg | 7.2 ± 1.8 | 9.3 ± 3.3 | 14.0 ± 3.5 | 9.0 ± 1.5 | 7.8 ± 1.5 | 5.9 ± 0.9 |
| 3 μg | 15.2 ± 4.7 | 10.2 ± 1.8 | 10.8 ± 1.7 | 12.6 ± 3.4 | 14.4 ± 4.7 | 13.8 ± 5.4 |
Effect of third ventricle Ucn 2 treatment on nocturnal meal microstructure of genetically selected diet-induced obesity-resistant (DR) and susceptible (DIO) rats. Data express the mean ± s.e.m. of several meal microstructure measures of adult male DR (n = 9) and DIO (n = 8) rats during the first 7 h of the dark cycle following central Ucn 2 pretreatment. Subjects were pretreated (−10 min) with Ucn 2 in a balanced Latin square design with test sessions beginning at the onset of the dark cycle. Avg = average. Symbols denote significant differences:
P < 0.05
P < 0.01
P < 0.001 from the respective vehicle condition (within-subject Newman–Keuls test)
P < 0.05
P < 0.01
P < 0.001 denote a significant dose effect of Ucn 2 (ANOVA)
P < 0.05
P < 0.01
P < 0.001 denote a significant log-linear, dose-dependent effect of Ucn 2 (Linear contrast ANOVA).
During meals, food less effectively maintained bursts of consistently fast eating in Ucn 2-treated subjects, which paused more often and variably between pellets (Table 5). The decreased overall rate of feeding was observed as a significant increase in the mean ln-transformed duration of interpellet intervals in within-meal microstructure analysis (F3,45 = 5.73, P < 0.01). The decreased regularity of feeding was observed as a significant increase in the standard deviation (F3,45 = 3.37, P < 0.05) and histogram entropy (F3,45 = 8.51, P < 0.001) of ln-transformed interfeeding intervals. (A higher histogram entropy means that interevent intervals were less consistently of specific durations.) As shown in Table 5, Ucn 2 was at least as effective in DIO rats as in DR rats at reducing the rate (mean) and regularity (s.d., entropy) of eating. Ucn 2 treatment did not alter the kurtosis of the log-normal distribution of interfeeding intervals. Ucn 2 also did not alter how quickly subjects drank within meals, indicating that reductions in eating rate were behaviourally specific (data not shown).
Table 5.
Effects of Ucn 2 on the rate and regularity of food pellet consumption within meals
| Statistical parameter for inter–pellet interval | DR | DIO |
|---|---|---|
| Mean | ||
| ANOVA | — | ## |
| Linear contrast | — | ††† |
| 0 μg | 2.50 (12.18) ± 0.07 | 2.34 (10.38) ± 0.07 |
| 0.3 μg | 2.54 12.68) ± 0.08 | 2.35 (10.49) ± 0.09 |
| 1 μg | 2.56 (12.94) ± 0.08 | 2.47 (11.82) ± 0.10 |
| 3 μg | 2.58 (13.20) ± 0.06 | 2.59 (13.33) ± 0.12* |
| Standard deviation | ||
| ANOVA | — | — |
| Linear contrast | — | † |
| 0 μg | 0.35 ± 0.02 | 0.42 ± 0.02 |
| 0.3 μg | 0.36 ± 0.02 | 0.41 ± 0.03 |
| 1 μg | 0.37 ± 0.02 | 0.45 ± 0.03 |
| 3 μg | 0.39 ± 0.03 | 0.56 ± 0.07 |
| Kurtosis | ||
| ANOVA | — | — |
| Linear contrast | — | — |
| 0 μg | 5.20 ± 1.88 | 9.31 ± 1.84 |
| 0.3 μg | 7.72 ± 2.62 | 10.63 ± 2.58 |
| 1 μg | 4.54 ± 1.50 | 7.27 ± 1.88 |
| 3 μg | 3.86 ± 0.79 | 5.72 ± 2.02 |
| Entropy | ||
| ANOVA | # | ## |
| Linear contrast | †† | †† |
| 0 μg | 0.34 ± 0.01 | 0.34 ± 0.01 |
| 0.3 μg | 0.37 ± 0.01 | 0.35 ± 0.02 |
| 1 μg | 0.38 ± 0.02 | 0.40 ± 0.02 |
| 3 μg | 0.40 ± 0.01* | 0.47 ± 0.05** |
Effect of third ventricle Ucn 2 treatment on the rate and regularity of eating within meals in genetically selected diet-induced obesity-resistant (DR) and susceptible (DIO) rats. Statistical parameters (expressed as mean ± s.e.m.) describe the log-normal distribution of consecutive, nocturnal, within-meal interfeeding intervals (IFIs) of adult male DR (n = 9) and DIO (n = 8) rats during the first 7 h of the dark cycle following central Ucn 2 pretreatment. Parameters were calculated from the ln-transformed duration of interfeeding interval durations. Therefore, the mean and s.e.m. are expressed in ln (s) units; the parenthetical value for the ‘Mean’ parameter represents the back-transformed average (s) to facilitate interpretation. For entropy analysis, histograms were constructed from log-transformed IFI that fell from e1.66 to e5.66 s (∼5.26–287.15 s), with a bin width of e0.2. Symbols denote significant differences:
P < 0.05
P < 0.01 from the respective vehicle condition (within-subject Newman–Keuls test)
P < 0.05
P < 0.01 denote a significant dose effect of Ucn 2 (ANOVA)
P < 0.05
P < 0.01 denote a significant log-linear, dose-dependent effect of Ucn 2 (Linear contrast ANOVA).
Ucn 2-induced anorexia is prevented by cotreatment with astressin2-B
In both genotypes, the protracted (0–7 h) anorectic effect of Ucn 2 (1 μg) (Ucn 2: F1,16 = 14.79, P < 0.001) was prevented by cotreatment with the selective CRF2 antagonist astressin2-B (4 μg) (Ucn 2 × A2–B interaction: F1,16 = 7.26, P < 0.05) at a dose which did not intrinsically alter feeding (Fig. 6, right). The early (0–2 h) suppression of food intake by Ucn 2 in DIO rats (Ucn 2: F1,8 = 6.53, P < 0.05) also was blocked by astressin2-B cotreatment (Ucn 2 × A2–B interaction: F1,8 = 8.24, P < 0.05) (Fig. 6, left).
Figure 6. Cotreatment with the selective CRF2 receptor antagonist astressin2-B prevents anorectic effects of central Ucn 2 administration in genetically selected diet-induced obesity-resistant (DR) (left panel) and susceptible (DIO) (right) rats.

Data represent mean (+s.e.m.) cumulative 2 h and 7 h food intake in adult male DR and DIO rats (n = 9/genotype) following treatment with vehicle (Veh), Ucn 2 (1 μg), astressin2-B (A2-B, 4 μg), or Ucn 2 + A2-B in a balanced Latin square design. Treatments were given as a single third ventricle injection (2 μl) 15 min before testing, which began at the dark cycle onset. Symbols denote significant differences: *P < 0.05 and **P < 0.01 from vehicle condition, #P < 0.05 and ##P < 0.01 from Ucn 2 condition (Student's t test).
Body weight, fat pad and body composition analysis
Table 6 shows the body weight progression of chow-fed DIO and DR rats across the study period as well as adiposity upon study completion. DIO rats were significantly heavier by 30 days of age and gained disproportionately more weight throughout the studies (Genotype × Age: F4,60 = 20.29, P < 0.001). However, despite being heavier than DR rats, ANCOVA that covaried for body weight differences, as well as ANOVA of fat mass expressed as a percentage of total body weight, both found that chow-fed DIO rats were not fatter than DR rats at the end of the study. In fact, ANCOVA indicated that chow-fed DIO rats had disproportionately smaller gonadal and retroperitoneal fat pads than DR rats, after covarying for body weight differences (Genotype: F1,15 = 16.02, P < 0.001 and F1,15 = 5.98, P < 0.05, gonadal and retroperitoneal, respectively) and also tended to have disproportionately less total white fad pass (P = 0.06) and whole carcass fat mass (P = 0.06) Adiposity values of both genotypes were consistent with a lean state, rather than an obese state.
Table 6.
Body weight and adiposity in chow-fed genetically selected DIO and DR rats
| Parameter | DR | DIO |
|---|---|---|
| Body weight (g) | ||
| Day 30, First measurement | 64.2 ± 1.9 | 71.4 ± 1.5* |
| Day 37 | 109.2 ± 2.9 | 119.6 ± 2.2* |
| Day 47, Training onset | 172.3 ± 3.2 | 194.7 ± 3.6*** |
| Day 77, Baseline onset | 295.1 ± 5.7 | 348.9 ± 7.2*** |
| Day 79, Dose–response onset | 301.8 ± 6.0 | 359.0 ± 7.7*** |
| Day 111, Antagonist-reversal onset | 355.3 ± 11.3 | 445.0 ± 11.1*** |
| Day 121, Study completion | 378.4 ± 7.4 | 456.4 ± 18.1** |
| Fat Pads | ||
| White fat pad (g) | ||
| Inguinal | 8.02 ± 0.54 | 7.31 ± 0.54 |
| Gonadal | 6.77 ± 0.27 | 5.03 ± 0.27** |
| Retroperitoneal | 3.96 ± 0.25 | 2.96 ± 0.25* |
| Mesenteric | 5.15 ± 0.34 | 4.54 ± 0.34 |
| Subcutaneous | 1.95 ± 0.23 | 1.54 ± 0.23 |
| Total | 25.86 ± 1.35 | 21.37 ± 1.36† |
| Brown fat pad (g) | 0.42 ± 0.06 | 0.58 ± 0.06 |
| White fat pad (% body weight) | ||
| Inguinal | 1.70 ± 0.11 | 1.91 ± 0.15 |
| Gonadal | 1.46 ± 0.05 | 1.35 ± 0.10 |
| Retroperitoneal | 0.79 ± 0.05 | 0.83 ± 0.09 |
| Mesenteric | 1.10 ± 0.05 | 1.19 ± 0.10 |
| Subcutaneous | 0.44 ± 0.03 | 0.39 ± 0.05 |
| Total | 5.49 ± 0.23 | 5.68 ± 0.45 |
| Brown fat pad (% body weight) | 0.11 ± 0.01 | 0.13 ± 0.01 |
| Whole Carcass Adiposity | ||
| Fat (g) | 37.64 ± 2.10 | 30.86 ± 2.10† |
| Fat (% body weight) | 8.84 ± 0.44 | 9.21 ± 0.79 |
Body weight and adiposity in DIO and DR rats (n = 8–9/genotype through day 77, n = 9/genotype from day 111 to study completion). Absolute (g) fat pad and whole carcass fat (g) values reflect the estimated marginal means from ANCOVA in which body weight was a covariate. Percentage (%) fat pad and whole carcass percentage (%) fat values reflect the raw, uncorrected fat pad masses expressed as a percentage of body weight. Values are means ± s.e.m.
P < 0.05
P < 0.01
P < 0.001
P = 0.06 (Student's t test).
Discussion
The major findings of the present study were as follows: (1) DIO and DR rats intrinsically differed in their feeding microstructure when studied in a pre-obese, chow-fed state; (2) the CRF2 receptor agonist rUcn 2 retained maximal anorectic efficacy in DIO rats, making them eat smaller and briefer meals more slowly; but (3) Ucn 2 showed slightly reduced anorectic potency in DIO rats than in the DR genotype, suppressing intake in the obesity-resistant, but not obesity-prone, rats at the 0.3 μg dose; and (4) Ucn 2-induced anorexia was blocked by A2-B, a selective CRF2 antagonist, supporting the hypothesized CRF2 mode of action.
Pre-existing differences in meal microstructure of genetically selected DIO and DR genotypes
Consistent with previous literature, young adult DIO rats did not show daily hyperphagia when maintained on a low-fat, chow diet (Ricci & Levin, 2003). However, meal pattern analysis found evidence that genetically selected DIO rats had a higher probability of initiating meals than DR rats. This was observed as a decreased latency to initiate feeding at the onset of the dark cycle as well as a faster resumption of eating following the completion of meals in both the light and dark phases. DIO rats also ate, but did not drink, more quickly within meals than the DR genotype, due to a behaviourally specific increase in the rate and regularity of sustained eating. Despite their greater propensity to initiate and reinitiate meals, DIO rats consumed meals of normal size and duration early in the dark cycle, resulting in a brief hyperphagia and lower satiety ratio. Importantly, chow-maintained DIO rats, while larger, were as lean or leaner than DR rats at study completion (121 days of age), consistent with previous results (Ricci & Levin, 2003). Thus, genotype differences in feeding microstructure were antecedents and not consequences of obesity.
The heritability of meal microstructure seen here is consistent with stable individual differences previously seen in outbred rats (Zorrilla et al. 2005a) and with the heritability of meal patterns in humans (de Castro, 1993a, b). One question for future study is whether DIO, DR or both genotypes deviate from the typical microstructure of their ancestral Sprague–Dawley stock. However, the briefer post-meal intervals of DIO rats versus DR rats, even in the face of normal size meals early in the dark cycle, suggests a deficit in maintaining post-meal satiety or, viewed another way, an accelerated accumulation of meal initiation potential between meals.
To our knowledge, only one published study has evaluated the microstructure of rodent feeding in relationship to vulnerability to diet-induced obesity. Farley et al. (2003) studied outbred Sprague–Dawley rats that had been maintained on a high-fat diet for 19 weeks since weaning, comparing the deciles that were most extreme in body weight gain for differences in feeding microstructure near study completion. Rats that had gained the most weight on the high-fat diet exhibited similar meal frequencies and durations, but larger meals, as compared to those rats that had gained the least weight. However, such a ‘post hoc’ model of vulnerability to obesity confounds historically different food intake, current obesity, and associated endocrine and metabolic adaptations with any pre-existing differences in meal microstructure that might prospectively predict obesity as a latent risk factor. Additional characteristics of the previous study that differ from the present one which may explain the different meal pattern findings include how meals were defined (subjectively without regard to prandial drinking), the diet used during testing (high-fat), the use of outbred stock rather than selectively bred DIO and DR rats, the greater age of subjects (28 weeks), and the absolute and relative body weights of subjects (i.e. 949 g obese rats that were 55% heavier than their controls).
That DIO rats eat many rapidly eaten meals across the day temporally resembles the human behaviour of ‘snacking’, which involves a greater frequency of food intake episodes and a failure to maintain post-meal satiety across culturally defined meal times. Similar to the pre-obese DIO model, increased meal frequency in humans during childhood is a hypothesized risk factor for later obesity (US Department of Agriculture, 1999; Nicklas et al. 2001; Francis et al. 2003; Erlanson-Albertsson & Zetterstrom, 2005). However, unlike the present study, in which DIO rats only had access to low-fat, energy-diffuse food and did not become obese, contemporary snacking in humans often involves not only increased meal frequency, but also access to and selection of energy-dense food, leading to excess daily energy intake (Zizza et al. 2001; Francis et al. 2003; Berteus Forslund et al. 2005). Perhaps the effect of increased meal-taking depends on the chosen diet (Cohn et al. 1965), with grazing on low-fat, energy-diffuse foods promoting leanness (e.g. chow-fed DIO rats, nibbling on ‘healthy’ foods), but the same intake pattern with energy-dense foods promoting obesity (e.g. high-fat fed DIO rats, snacking on ‘unhealthy’ foods).
That obesity-prone DIO rats eat many small meals throughout the days might seem to contradict suggestions that a frequent meal pattern opposes obesity (Cohn et al. 1965; Cruise & Katz, 2005; Parks & McCrory, 2005). However, several considerations are relevant here. First, the frequent meal pattern per se did not promote obesity because chow-fed DIO rats were as or more lean than DR rats. Second, DIO rats spontaneously have brief postmeal intervals and high probabilities of meal initiation, which may mean something different from when humans consciously adopt a more frequent eating pattern than one's physiology dictates. Third, the greater propensity of DIO rats to initiate meals might lead to excess daily energy intake when more palatable, less satiating high-energy/fat foods that maintain feeding are available (Warwick et al. 2003; Zizza et al. 2001; Francis et al. 2003; Berteus Forslund et al. 2005). Consistent with this hypothesis, chow-maintained DIO rats did not accommodate their meal sizes to their briefer post-meal intervals early in the dark cycle when feeding drive is high, resulting in transient hyperphagia. Future meal microstructure studies of (still lean) DIO rats acutely switched to high-fat diets and experimental scheduling of meal initiation opportunities may address these considerations.
Although the mechanisms responsible for these genotype differences in meal patterning remain speculative, impaired leptin signalling might be involved. Central resistance to leptin administration is present before the onset of obesity in DIO rats (Levin et al. 2003; Levin et al. 2004; Clegg et al. 2005; Irani et al. 2007), and acute central leptin administration reduces meal frequency and prolongs the postmeal interval in Wistar rats (Zorrilla et al. 2005b). Clinical findings also indicate that leptin facilitates postmeal satiety (Montague et al. 1997; Farooqi et al. 1999; Chapelot et al. 2000; Westerterp-Plantenga et al. 2001). Interestingly, obese humans that ‘snack’ more between meals are more likely to carry allelic variations in the genes that encode leptin or its receptor as compared to those without increased meal-taking behaviour (de Krom et al. 2007). Thus, the role of central leptin resistance in the increased meal frequency and reduced maintenance of satiety following meal completion in DIO rats merits further study.
Anorectic effects of Ucn 2 in genetically selected DIO and DR genotypes
Ucn 2 retained its maximal anorectic efficacy in DIO rats, reducing the quantity and duration of eating and drinking within meals. Ucn 2 also dose-dependently reduced the rate and regularity of eating within meals, with food less effectively maintaining bursts of sustained eating. Meal frequency and postprandial durations were not changed by drug treatments. The meal microstructure effects of third ventricle rat Ucn 2 administration observed here in both DIO and DR rats reproduce and extend upon those previously reported following lateral ventricle administration of human Ucn 2 in Wistar rats (Inoue et al. 2003).
Although Ucn 2 retained maximal anorectic efficacy in DIO rats, the peptide tended to be slightly less potent in the DIO than DR genotype. CRF2 mRNA expression in the VMH, where local CRF2 agonist infusion suppresses feeding (Fekete et al. 2007), is reduced in several animal models characterized by low leptin signalling, hyperphagia and weight gain. These include streptozotocin-induced diabetic rats and genetically obese (fa/fa) Zucker rats (Richard et al. 1996; Huang et al. 2006a) and 48 h fasted rats, the latter demonstrating that CRF2 down-regulation is not simply a consequence of obesity (Makino et al. 1998). Conversely, leptin treatment induces VMH CRF2 mRNA expression (Nishiyama et al. 1999; Huang et al. 2006b). Perhaps the leptin resistance of DIO rats leads to fewer VMH CRF2 receptors and thereby a reduced potency of Ucn 2. Other CRF2-expressing brain regions where local Ucn administration suppresses feeding, including the paraventricular nucleus of the hypothalamus, nucleus of the solitary tract, dorsal raphe and lateral septum (Fekete & Zorrilla, 2007), also merit further study.
As reported previously (Ohata et al. 2002; Inoue et al. 2003), Ucn 2 exhibited a delayed onset of central anorectic action. However, Ucn 2 anorexia was seen ∼1 h earlier in the DIO versus DR genotype in both the dose–response and antagonist-reversal studies. Both the early and protracted components of Ucn 2 anorexia were blocked by cotreatment with A2-B, a CRF2 antagonist (Rivier et al. 2002), implicating a CRF2 mode of anorectic action. The differential onset of cumulative anorexia between DIO and DR rats may be related to the greater baseline food intake of DIO rats within the corresponding first 2 h of the dark cycle. Perhaps central CRF2 stimulation more effectively reduces feeding when the motivation to feed is high. Alternatively, perhaps the early hyperphagia of DIO rats is related to an endogenous deficit in Ucn/CRF-CRF2 activity.
In summary, chow-fed, obesity-prone DIO rats showed a greater propensity to initiate meals, faster, more regular eating rates within meals, and a slightly reduced anorectic potency of CRF2 agonist stimulation compared to obesity-resistant DR rats. These pre-existing line differences may mark the DIO genotype's polygenic greater vulnerability to become obese. That the DIO rat remained responsive to central anorectic effects of Ucn 2 differs from findings with other anorectic agents. DIO rats exhibit central insulin resistance and a reduced anorectic response to leptin (−54%) before they become obese (Levin et al. 2004; Clegg et al. 2005). In contrast, central CRF2 stimulation retained full anorectic efficacy at sufficiently high doses in the DIO genotype. The findings may open new avenues of investigation towards preventing and treating some forms of diet-induced obesity.
Acknowledgments
This is manuscript 18445 from The Scripps Research Institute. We recognize the editorial assistance of Mike Arends, the administrative assistance of Mary Kihagi, and the technical assistance of Bob Lintz, Molly Brennan and Lara Pockros. We thank Jean Rivier (The Salk Institute) for generously providing the peptides. This research was supported by grants from the National Institute of Diabetes and Digestive and Kidney Diseases, including DK64871, DK77616, DK26741, and the Univerisity of Alabama at Birmingham Small Animal Phenotyping Core (P30DK56336 and P30NS057098).
The authors declare no conflict of interest.
References
- Adan R. Preface. Eur J Pharmacol. 2002;440:83. [Google Scholar]
- Arase K, Shargill NS, Bray GA. Effects of corticotropin releasing factor on genetically obese (fatty) rats. Physiol Behav. 1989a;45:565–570. doi: 10.1016/0031-9384(89)90074-7. [DOI] [PubMed] [Google Scholar]
- Arase K, Shargill NS, Bray GA. Effects of intraventricular infusion of corticotropin-releasing factor on VMH-lesioned obese rats. Am J Physiol Regul Integr Comp Physiol. 1989b;256:R751–R756. doi: 10.1152/ajpregu.1989.256.3.R751. [DOI] [PubMed] [Google Scholar]
- Bale TL, Anderson KR, Roberts AJ, Lee KF, Nagy TR, Vale WW. Corticotropin-releasing factor receptor-2-deficient mice display abnormal homeostatic responses to challenges of increased dietary fat and cold. Endocrinology. 2003;144:2580–2587. doi: 10.1210/en.2002-0091. [DOI] [PubMed] [Google Scholar]
- Berteus Forslund H, Torgerson JS, Sjostrom L, Lindroos AK. Snacking frequency in relation to energy intake and food choices in obese men and women compared to a reference population. Int J Obesity. 2005;29:711–719. doi: 10.1038/sj.ijo.0802950. [DOI] [PubMed] [Google Scholar]
- Bradbury MJ, McBurnie MI, Denton DA, Lee KF, Vale WW. Modulation of urocortin-induced hypophagia and weight loss by corticotropin-releasing factor receptor 1 deficiency in mice. Endocrinology. 2000;141:2715–2724. doi: 10.1210/endo.141.8.7606. [DOI] [PubMed] [Google Scholar]
- Chapelot D, Aubert R, Marmonier C, Chabert M, Louis-Sylvestre J. An endocrine and metabolic definition of the intermeal interval in humans: evidence for a role of leptin on the prandial pattern through fatty acid disposal. Am J Clin Nutr. 2000;72:421–431. doi: 10.1093/ajcn/72.2.421. [DOI] [PubMed] [Google Scholar]
- Clegg DJ, Benoit SC, Reed JA, Woods SC, Dunn-Meynell A, Levin BE. Reduced anorexic effects of insulin in obesity-prone rats fed a moderate-fat diet. Am J Physiol Regul Integr Comp Physiol. 2005;288:R981–R986. doi: 10.1152/ajpregu.00675.2004. [DOI] [PubMed] [Google Scholar]
- Cohn C, Joseph D, Bell L, Allweiss MD. Studies on the effects of feeding frequency and dietary composition on fat deposition. Ann N Y Acad Sci. 1965;131:507–518. doi: 10.1111/j.1749-6632.1965.tb34816.x. [DOI] [PubMed] [Google Scholar]
- Comuzzie AG, Allison DB. The search for human obesity genes. Science. 1998;280:1374–1377. doi: 10.1126/science.280.5368.1374. [DOI] [PubMed] [Google Scholar]
- Cottone P, Sabino V, Steardo L, Zorrilla EP. FG 7142 Specifically reduces meal size and the rate and regularity of sustained feeding in female rats: evidence that benzodiazepine inverse agonists reduce food palatability. Neuropsychopharmacology. 2007. in press. [DOI] [PubMed]
- Cruise J, Katz DL. The Three-Hour Diet: How Low-Carb Diets Make You Fat and Timing Makes You Thin. New York, NY, USA: Collins; 2005. [Google Scholar]
- Cullen MJ, Ling N, Foster AC, Pelleymounter MA. Urocortin, corticotropin releasing factor-2 receptors and energy balance. Endocrinology. 2001;142:992–999. doi: 10.1210/endo.142.3.7989. [DOI] [PubMed] [Google Scholar]
- Daniels D, Markison S, Grill HJ, Kaplan JM. Central structures necessary and sufficient for ingestive and glycemic responses to Urocortin I administration. J Neurosci. 2004;24:11457–11462. doi: 10.1523/JNEUROSCI.2702-04.2004. [DOI] [PMC free article] [PubMed] [Google Scholar]
- de Castro JM. Genetic influences on daily intake and meal patterns of humans. Physiol Behav. 1993a;53:777–782. doi: 10.1016/0031-9384(93)90188-l. [DOI] [PubMed] [Google Scholar]
- de Castro JM. Independence of genetic influences on body size, daily intake, and meal patterns of humans. Physiol Behav. 1993b;54:633–639. doi: 10.1016/0031-9384(93)90070-v. [DOI] [PubMed] [Google Scholar]
- de Krom M, van der Schouw YT, Hendriks J, Ophoff RA, van Gils CH, Stolk RP, Grobbee DE, Adan R. Common genetic variations in CCK, leptin, and leptin receptor genes are associated with specific human eating patterns. Diabetes. 2007;56:276–280. doi: 10.2337/db06-0473. [DOI] [PubMed] [Google Scholar]
- Drazen DL, Woods SC. Peripheral signals in the control of satiety and hunger. Curr Opin Clin Nutr Metab Care. 2003;6:621–629. doi: 10.1097/00075197-200311000-00003. [DOI] [PubMed] [Google Scholar]
- Erlanson-Albertsson C, Zetterstrom R. The global obesity epidemic: snacking and obesity may start with free meals during infant feeding. Acta Paediatr. 2005;94:1523–1531. doi: 10.1080/08035250500323780. [DOI] [PubMed] [Google Scholar]
- Farley C, Cook JA, Spar BD, Austin TM, Kowalski TJ. Meal pattern analysis of diet-induced obesity in susceptible and resistant rats. Obesity Res. 2003;11:845–851. doi: 10.1038/oby.2003.116. [DOI] [PubMed] [Google Scholar]
- Farooqi IS, Jebb SA, Langmack G, Lawrence E, Cheetham CH, Prentice AM, Hughes IA, McCamish MA, O'Rahilly S. Effects of recombinant leptin therapy in a child with congenital leptin deficiency. N Engl J Med. 1999;341:879–884. doi: 10.1056/NEJM199909163411204. [DOI] [PubMed] [Google Scholar]
- Fekete EM, Inoue K, Zhao Y, Rivier JE, Vale WW, Szucs A, Koob GF, Zorrilla EP. Delayed satiety-like actions and altered feeding microstructure by a selective type 2 corticotropin-releasing factor agonist in rats: intra-hypothalamic urocortin 3 administration reduces food intake by prolonging the post-meal interval. Neuropsychopharmacology. 2007;32:1052–1068. doi: 10.1038/sj.npp.1301214. [DOI] [PMC free article] [PubMed] [Google Scholar]
- Fekete EM, Zorrilla EP. Physiology, pharmacology, and therapeutic relevance of urocortins in mammals: Ancient CRF paralogs. Front Neuroendocrinol. 2007;28:1–27. doi: 10.1016/j.yfrne.2006.09.002. [DOI] [PMC free article] [PubMed] [Google Scholar]
- Francis LA, Lee Y, Birch LL. Parental weight status and girls' television viewing, snacking, and body mass indexes. Obesity Res. 2003;11:143–151. doi: 10.1038/oby.2003.23. [DOI] [PMC free article] [PubMed] [Google Scholar]
- Halaas JL, Boozer C, Blair-West J, Fidahusein N, Denton DA, Friedman JM. Physiological response to long-term peripheral and central leptin infusion in lean and obese mice. Proc Natl Acad Sci U S A. 1997;94:8878–8883. doi: 10.1073/pnas.94.16.8878. [DOI] [PMC free article] [PubMed] [Google Scholar]
- Harris RB, Martin RJ. Recovery of body weight from below ‘set point’ in mature female rats. J Nutrition. 1984;114:1143–1150. doi: 10.1093/jn/114.6.1143. [DOI] [PubMed] [Google Scholar]
- Heinrichs SC, Joppa M, Lapsansky J, Jeske K, Nelson R, De Souza E. Selective stimulatory actions of corticotropin-releasing factor ligands on correlates of energy balance. Physiol Behav. 2001;74:5–13. doi: 10.1016/s0031-9384(01)00421-8. [DOI] [PubMed] [Google Scholar]
- Heinrichs SC, Lapsansky J, Behan DP, Chan RK, Sawchenko PE, Lorang M, Ling N, Vale WW, De Souza EB. Corticotropin-releasing factor-binding protein ligand inhibitor blunts excessive weight gain in genetically obese Zucker rats and rats during nicotine withdrawal. Proc Natl Acad Sci U S A. 1996;93:15475–15480. doi: 10.1073/pnas.93.26.15475. [DOI] [PMC free article] [PubMed] [Google Scholar]
- Hoare SR, Sullivan SK, Fan J, Khongsaly K, Grigoriadis DE. Peptide ligand binding properties of the corticotropin-releasing factor (CRF) type 2 receptor: pharmacology of endogenously expressed receptors, G-protein-coupling sensitivity and determinants of CRF2 receptor selectivity. Peptides. 2005;26:457–470. doi: 10.1016/j.peptides.2004.10.019. [DOI] [PubMed] [Google Scholar]
- Huang Q, Timofeeva E, Richard D. Corticotropin-releasing factor and its receptors in the brain of rats with insulin and corticosterone deficits. J Mol Endocrinol. 2006a;37:213–226. doi: 10.1677/jme.1.02103. [DOI] [PubMed] [Google Scholar]
- Huang Q, Timofeeva E, Richard D. Regulation of corticotropin-releasing factor and its types 1 and 2 receptors by leptin in rats subjected to treadmill running-induced stress. J Endocrinol. 2006b;191:179–188. doi: 10.1677/joe.1.06906. [DOI] [PubMed] [Google Scholar]
- Inoue K, Valdez GR, Reyes TM, Reinhardt LE, Tabarin A, Rivier J, Vale WW, Sawchenko PE, Koob GF, Zorrilla EP. Human urocortin II, a selective agonist for the type 2 corticotropin-releasing factor receptor, decreases feeding and drinking in the rat. J Pharmacol Exp Ther. 2003;305:385–393. doi: 10.1124/jpet.102.047712. [DOI] [PubMed] [Google Scholar]
- Irani BG, Dunn-Meynell AA, Levin BE. Altered hypothalamic leptin, insulin, and melanocortin binding associated with moderate-fat diet and predisposition to obesity. Endocrinology. 2007;148:310–316. doi: 10.1210/en.2006-1126. [DOI] [PubMed] [Google Scholar]
- Jahn O, Tezval H, van Werven L, Eckart K, Spiess J. Three-amino acid motifs of urocortin II and III determine their CRF receptor subtype selectivity. Neuropharmacology. 2004;47:233–242. doi: 10.1016/j.neuropharm.2004.03.018. [DOI] [PubMed] [Google Scholar]
- Kleiber M, Rogers TA. Energy metabolism. Annu Rev Physiol. 1961;23:5–36. doi: 10.1146/annurev.ph.23.030161.000311. [DOI] [PubMed] [Google Scholar]
- Levin BE, Dunn-Meynell AA. Defense of body weight depends on dietary composition and palatability in rats with diet-induced obesity. Am J Physiol Regul Integr Comp Physiol. 2002;282:R46–R54. doi: 10.1152/ajpregu.2002.282.1.R46. [DOI] [PubMed] [Google Scholar]
- Levin BE, Dunn-Meynell AA, Balkan B, Keesey RE. Selective breeding for diet-induced obesity and resistance in Sprague-Dawley rats. Am J Physiol Regul Integr Comp Physiol. 1997;273:R725–R730. doi: 10.1152/ajpregu.1997.273.2.R725. [DOI] [PubMed] [Google Scholar]
- Levin BE, Dunn-Meynell AA, Banks WA. Obesity-prone rats have normal blood–brain barrier transport but defective central leptin signaling before obesity onset. Am J Physiol Regul Integr Comp Physiol. 2004;286:R143–R150. doi: 10.1152/ajpregu.00393.2003. [DOI] [PubMed] [Google Scholar]
- Levin BE, Dunn-Meynell AA, McMinn JE, Alperovich M, Cunningham-Bussel A, Chua SC., Jr A new obesity-prone, glucose-intolerant rat strain (F.DIO) Am J Physiol Regul Integr Comp Physiol. 2003;285:R1184–R1191. doi: 10.1152/ajpregu.00267.2003. [DOI] [PubMed] [Google Scholar]
- Makino S, Nishiyama M, Asaba K, Gold PW, Hashimoto K. Altered expression of type 2 CRH receptor mRNA in the VMH by glucocorticoids and starvation. Am J Physiol Regul Integr Comp Physiol. 1998;275:R1138–R1145. doi: 10.1152/ajpregu.1998.275.4.R1138. [DOI] [PubMed] [Google Scholar]
- Mann PE, Pasternak GW, Hahn EF, Curreri G, Lubin E, Bodnar RJ. Comparison of effects of chronic administration of naloxone and naloxonazine upon food intake and maintenance of body weight in rats. Neuropharmacology. 1988;27:349–355. doi: 10.1016/0028-3908(88)90142-6. [DOI] [PubMed] [Google Scholar]
- Montague CT, Farooqi IS, Whitehead JP, Soos MA, Rau H, Wareham NJ, Sewter CP, Digby JE, Mohammed SN, Hurst JA, Cheetham CH, Earley AR, Barnett AH, Prins JB, O'Rahilly S. Congenital leptin deficiency is associated with severe early-onset obesity in humans. Nature. 1997;387:903–908. doi: 10.1038/43185. [DOI] [PubMed] [Google Scholar]
- Nicklas TA, Baranowski T, Cullen KW, Berenson G. Eating patterns, dietary quality and obesity. J Am Coll Nutr. 2001;20:599–608. doi: 10.1080/07315724.2001.10719064. [DOI] [PubMed] [Google Scholar]
- Niederau C, Meereis-Schwanke K, Klonowski-Stumpe H, Herberg L. CCK-resistance in Zucker obese versus lean rats. Regul Pept. 1997;70:97–104. doi: 10.1016/s0167-0115(97)00014-1. [DOI] [PubMed] [Google Scholar]
- Nishiyama M, Makino S, Asaba K, Hashimoto K. Leptin effects on the expression of type-2 CRH receptor mRNA in the ventromedial hypothalamus in the rat. J Neuroendocrinol. 1999;11:307–314. doi: 10.1046/j.1365-2826.1999.00331.x. [DOI] [PubMed] [Google Scholar]
- Ogden CL, Carroll MD, Curtin LR, McDowell MA, Tabak CJ, Flegal KM. Prevalence of overweight and obesity in the United States, 1999–2004. JAMA. 2006;295:1549–1555. doi: 10.1001/jama.295.13.1549. [DOI] [PubMed] [Google Scholar]
- Ohata H, Arai K, Shibasaki T. Effect of chronic administration of a CRF1 receptor antagonist, CRA1000, on locomotor activity and endocrine responses to stress. Eur J Pharmacol. 2002;457:201–206. doi: 10.1016/s0014-2999(02)02663-8. [DOI] [PubMed] [Google Scholar]
- Ohata H, Shibasaki T. Effects of urocortin 2 and 3 on motor activity and food intake in rats. Peptides. 2004;25:1703–1709. doi: 10.1016/j.peptides.2004.05.023. [DOI] [PubMed] [Google Scholar]
- Parks EJ, McCrory MA. When to eat and how often? Am J Clin Nutr. 2005;81:3–4. doi: 10.1093/ajcn/81.1.3. [DOI] [PubMed] [Google Scholar]
- Paxinos G, Watson C. The Rat Brain in Stereotaxic Coordinates. San Diego: Academic Press; 1986. [Google Scholar]
- Reyes TM, Lewis K, Perrin MH, Kunitake KS, Vaughan J, Arias CA, Hogenesch JB, Gulyas J, Rivier J, Vale WW, Sawchenko PE. Urocortin II: a member of the corticotropin-releasing factor (CRF) neuropeptide family that is selectively bound by type 2 CRF receptors. Proc Natl Acad Sci U S A. 2001;98:2843–2848. doi: 10.1073/pnas.051626398. [DOI] [PMC free article] [PubMed] [Google Scholar]
- Ricci MR, Levin BE. Ontogeny of diet-induced obesity in selectively bred Sprague-Dawley rats. Am J Physiol Regul Integr Comp Physiol. 2003;285:R610–R618. doi: 10.1152/ajpregu.00235.2003. [DOI] [PubMed] [Google Scholar]
- Richard D, Lin Q, Timofeeva E. The corticotropin-releasing factor family of peptides and CRF receptors: their roles in the regulation of energy balance. Eur J Pharmacol. 2002;440:189–197. doi: 10.1016/s0014-2999(02)01428-0. [DOI] [PubMed] [Google Scholar]
- Richard D, Rivest R, Naimi N, Timofeeva E, Rivest S. Expression of corticotropin-releasing factor and its receptors in the brain of lean and obese Zucker rats. Endocrinology. 1996;137:4786–4795. doi: 10.1210/endo.137.11.8895348. [DOI] [PubMed] [Google Scholar]
- Rivier J, Gulyas J, Kirby D, Low W, Perrin MH, Kunitake K, DiGruccio M, Vaughan J, Reubi JC, Waser B, Koerber SC, Martinez V, Wang L, Tache Y, Vale W. Potent and long-acting corticotropin releasing factor (CRF) receptor 2 selective peptide competitive antagonists. J Med Chem. 2002;45:4737–4747. doi: 10.1021/jm0202122. [DOI] [PubMed] [Google Scholar]
- Rohner-Jeanrenaud F, Walker CD, Greco-Perotto R, Jeanrenaud B. Central corticotropin-releasing factor administration prevents the excessive body weight gain of genetically obese (fa/fa) rats. Endocrinology. 1989;124:733–739. doi: 10.1210/endo-124-2-733. [DOI] [PubMed] [Google Scholar]
- Senn S. Change from baseline and analysis of covariance revisited. Statistics Med. 2006;25:4334–4344. doi: 10.1002/sim.2682. [DOI] [PubMed] [Google Scholar]
- Shannon CE, Weaver W. The Mathematical Theory of Communication. Urbana: University of Illinois Press; 1949. [Google Scholar]
- Tabarin A, Dis-Chavez Y, Consoli D, Monsaingeon M, Bale TL, Culler M, Datta R, Drago F, Vale W, Koob GF, Zorrilla EP, Contarino A. Role of the CRF receptor type 2 in the control of food intake in mice: a meal pattern analysis. Eur J Neurosci. 2007. in press. [DOI] [PMC free article] [PubMed]
- Tolkamp BJ, Kyriazakis II. To split behaviour into bouts, log-transform the intervals. Anim Behav. 1999;57:807–817. doi: 10.1006/anbe.1998.1022. [DOI] [PubMed] [Google Scholar]
- US Department of Agriculture Economic Research Service. America's Eating Habits: Changes and Consequences. Washington, DC: USDA Economic Research Service; 1999. [Google Scholar]
- Vickers AJ. The use of percentage change from baseline as an outcome in a controlled trial is statistically inefficient: a simulation study. BMC Med Res Methodol. 2001;1:6. doi: 10.1186/1471-2288-1-6. [DOI] [PMC free article] [PubMed] [Google Scholar]
- Warwick ZS, Synowski SJ, Rice KD, Smart AB. Independent effects of diet palatability and fat content on bout size and daily intake in rats. Physiol Behav. 2003;80:253–258. doi: 10.1016/j.physbeh.2003.07.007. [DOI] [PubMed] [Google Scholar]
- Westerterp-Plantenga MS, Saris WH, Hukshorn CJ, Campfield LA. Effects of weekly administration of pegylated recombinant human OB protein on appetite profile and energy metabolism in obese men. Am J Clin Nutr. 2001;74:426–434. doi: 10.1093/ajcn/74.4.426. [DOI] [PubMed] [Google Scholar]
- Wren AM, Small CJ, Fribbens CV, Neary NM, Ward HL, Seal LJ, Ghatei MA, Bloom SR. The hypothalamic mechanisms of the hypophysiotropic action of ghrelin. Neuroendocrinology. 2002;76:316–324. doi: 10.1159/000066629. [DOI] [PubMed] [Google Scholar]
- Zizza C, Siega-Riz AM, Popkin BM. Significant increase in young adults' snacking between 1977–1978 and 1994–96 represents a cause for concern! Prev Med. 2001;32:303–310. doi: 10.1006/pmed.2000.0817. [DOI] [PubMed] [Google Scholar]
- Zorrilla EP, Inoue K, Fekete EM, Tabarin A, Valdez GR, Koob GF. Measuring meals: structure of prandial food and water intake of rats. Am J Physiol Regul Integr Comp Physiol. 2005a;288:R1450–R1467. doi: 10.1152/ajpregu.00175.2004. [DOI] [PubMed] [Google Scholar]
- Zorrilla EP, Inoue K, Valdez GR, Tabarin A, Koob GF. Leptin and post-prandial satiety: acute central leptin more potently reduces meal frequency than meal size in the rat. Psychopharmacology. 2005b;177:324–335. doi: 10.1007/s00213-004-1952-1. [DOI] [PubMed] [Google Scholar]
- Zorrilla EP, Reinhardt LE, Valdez GR, Inoue K, Rivier JE, Vale WW, Koob GF. Human urocortin 2, a corticotropin-releasing factor (CRF) 2 agonist, and ovine CRF, a CRF1 agonist, differentially alter feeding and motor activity. J Pharmacol Exp Ther. 2004;310:1027–1034. doi: 10.1124/jpet.104.068676. [DOI] [PubMed] [Google Scholar]
- Zorrilla EP, Tache Y, Koob GF. Nibbling at CRF receptor control of feeding and gastrocolonic motility. Trends Pharmacol Sci. 2003;24:421–427. doi: 10.1016/S0165-6147(03)00177-9. [DOI] [PubMed] [Google Scholar]