

Abstract
The sensitivity of medial superior olive (MSO) neurons to tens of microsecond differences in interaural temporal delay (ITD) derives in part from their membrane electrical characteristics, kinetics and timing of excitatory and inhibitory inputs, and dendrite structure. However, maturation of these physiological and structural characteristics are little studied, especially in relationship to the onset of auditory experience. We showed, using brain slices at physiological temperature, that MSO neurons exhibited sensitivity to simulated temporally delayed (TD) EPSCs (simEPSC), injected through the recording electrode, by the initial phase of hearing onset at P10, and TD sensitivity was reduced by block of low threshold potassium channels. The spike generation mechanism matured between P10 and P16 to support TD sensitivity to adult-like excitatory stimuli (1–4 ms duration) by P14. IPSP duration was shorter at physiological temperature than reported for lower temperatures, was longer than EPSP duration at young ages, but approached the duration of EPSPs by P16, when hearing thresholds neared maturity. Dendrite branching became less complex over a more restricted time frame between P10 and P12. Because many physiological and structural properties approximated mature values between P14 and P16, we studied temporal integration of simEPSCs and IPSPs at P15. Only a narrow range of relative onset times (< 1 ms) yielded responses showing sensitivity to TD. We propose that shaping of excitatory circuitry to mediate TD sensitivity can begin before airborne sound is detectable, and that inhibitory inputs having suboptimal neural delays may then be pruned by cellular mechanisms activated by sensitivity to ITD.
The difference in arrival time of a sound wave at the two ears, the interaural temporal delay (ITD), is the dominant cue for sound localization (Wightman & Kistler, 1992). In mammals, the initial stages of ITD processing occur in the medial superior olive (MSO), whose neurons are situated in the superior olivary complex and are sensitive to small changes in ITD on the order of tens of microseconds (Goldberg & Brown, 1969; Yin & Chan, 1990; Spitzer & Semple, 1995). The MSO receives bilateral excitatory input from the cochlear nucleus and bilateral inhibitory input from the medial and lateral nuclei of the trapezoid body (MNTB, LNTB; Stotler 1953; Banks & Smith, 1992; Cant & Hyson, 1992; Kuwabara & Zook, 1992). Temporal windows for integration of synaptic inputs are determined by biophysical properties of MSO neurons (Svirskis et al. 2002; Scott et al. 2005) and the capability of synaptic connections to deliver well-timed inputs at high rates. Precise developmental processes must converge to refine this neural circuitry and the integrative properties of MSO neurons, but the coordination of these events and their relationship to the onset of auditory experience is little studied.
ITD sensitivity has been demonstrated in vivo in the midbrain of gerbils as early as P15 (Seidl & Grothe, 2005), but extracellular recordings cannot distinguish contributions to neural activity patterns by synaptic machinery and biophysical properties, which may develop along different time courses. In this species, the initial phase of hearing onset occurs between P10 and P12, but thresholds do not approach adult levels until P15 (Woolf & Ryan, 1984; McFadden et al. 1996). Electrical properties of MSO cell membranes and the time constants of synaptic inputs have been measured in vitro after hearing onset from P12–35 gerbils (Svirskis et al. 2002, 2004; Magnusson et al. 2005; Scott et al. 2005). However, determining the maturational profile of functional characteristics preceding and following developmental milestones, such as the onset of sensory experience, is important for unravelling the coordinated genetic programmes and other cellular processes that establish neural circuits in early development. Surprisingly few studies of the nervous system provide this information in a systematic fashion and relate it to structural maturation of neurons and the circuits in which they reside (for example Massengill et al. 1997; Picken Bahrey & Moody, 2003; Corlew et al. 2004; McKay & Turner, 2005; McCabe et al. 2006; for review, Moody & Bosma, 2005). Notable exceptions are the neural connection between the calyx of Held and its postsynaptic target, the principal cell of the medial nucleus of the trapezoid body (MNTB) located in the auditory brainstem and between MNTB neurons and their targets in the lateral superior olive (Kandler & Friauf, 1993, 1995; Hoffpauir et al. 2006; for reviews see Sanes & Friauf, 2000; Schneggenburger & Forsythe, 2006).
Cellular physiology is frequently studied using in vitro preparations, which typically are not investigated at physiological temperature. Notably, some effects of temperature, including reduced duration and amplitude of action potentials (Funabiki et al. 1998; Smith et al. 2000; Kuba et al. 2003; Cao & Oertel, 2005; Kushmerick et al. 2006), resemble and therefore can confound developmental changes described for MSO neurons or chick nucleus laminaris, homologue of the MSO (Funabiki et al. 1998; Kuba et al. 2002; Magnusson et al. 2005; Scott et al. 2005). Consequently, quantification of events at physiological temperature may provide an accelerated picture of maturation compared to other studies of the MSO. We performed whole cell in vitro recordings at physiological temperature to measure maturation of membrane electrical properties and inhibitory and excitatory synaptic potentials before and during hearing onset. Gerbils were studied because they are altricial animals, have an audible spectrum that extends to low frequency, and the neurons of the MSO are sensitive to ITD (Heffner & Heffner, 1988; Muller, 1990; Spitzer & Semple, 1995).
Neurons of the medial nucleus of the trapezoid body (MNTB), which provide inhibitory input to the MSO (Smith et al. 2000; Lohrke et al. 2005; Magnusson et al. 2005), can be activated reliably at young ages in vitro (Chuhma & Ohmori, 1998; Taschenberger & von Gersdorff, 2000; Joshi & Wang, 2002). In addition to potential roles in development of binaural circuits, inhibition can contribute to ITD processing in adult animals by positioning the steep slope of ITD curves through the physiological range of hearing (McAlpine et al. 2001; Brand et al. 2002), facilitating detection of low amplitude excitatory events (Svirskis et al. 2002, 2004; Dodla et al. 2006) or preserving dynamic range for ITD sensitivity (Pena et al. 1996). The duration of IPSPs is a key parameter in models of MSO function, and is best assessed in vitro at physiological temperature. Furthermore, despite the periodic patterns of neural activity generated by low frequency sound, development of the temporal characteristics of synaptic inhibition to MSO has not been studied. Given these considerations, we also investigated maturation of the frequency-following capability of inhibitory inputs to MSO neurons, and then inquired whether inhibitory inputs could affect temporal delay processing in early development. Since the relative timing of IPSPs and EPSPs in vivo is not known, we also examined how a range of IPSP onset times could differentially affect the activity patterns of MSO neurons.
Methods
Recording protocols
Gerbils, postnatal day (P) 6–20, were the experimental animal. All protocols were approved by the Institutional Animal Care and Use Committee of West Virginia University. Following rapid decapitation, the brainstem was dissected in oxygenated ice-cold artificial cerebral spinal fluid (ACSF) and sectioned coronally (200–250 μm) using a Vibratome (Vibratome, St Louis, MO, USA). The ACSF was composed of (mm): NaCl (128), KCl (4), KH2PO4 (1), NaHCO3 (26), glucose (25), CaCl2 (2.5), MgSO4 (1). All chemicals were from Sigma (St Louis, MO, USA) unless otherwise noted. Slices were transferred to a holding chamber that contained ACSF saturated with 95% O2–5% CO2 and incubated at 35°C for 1 h, then allowed to cool to room temperature. Slices were transferred to a recording chamber (RC-26GLP or RC-27 l; Warner Instruments, Hamden, CT, USA) attached to a fixed microscope stage (Axioskop FS; Carl Zeiss Microimaging, Thornwood, NY, USA), and maintained at physiological temperature (35.5–37.5°C) using a dual automatic temperature controller that regulated the recording chamber heater and an in-line heater (Warner Instruments). Temperatures in the middle of the chamber where the slice was positioned were checked using a stand-alone thermocouple-based thermometer (Cole-Parmer, Vernon Hills, IL, USA) calibrated to a mercury thermometer. An initial set of experiments was conducted at 30–32°C; these data are noted in Results. Cells were visualized for recording using infrared-differential interference contrast optics via a video camera (MTI; Dage Instruments, Michigan City, IN, USA). Pipettes for whole-cell recording were filled with (mm): potassium gluconate (130), NaCl (4), MgCl2 (2), Hepes (10), EGTA (0.2), NaATP (2). IPSPs elicited from MNTB primarily increase chloride conductance, which has an equilibrium potential of −76 mV at physiological temperature. In a subset of experiments, cells were labelled by adding neurobiotin (0.4%; Vector Laboratories, Burlingame, CA, USA) and Lucifer Yellow (LY, 0.1%) to the pipette solution. In some experiments, α-dendrotoxin (10, 50 and 100 nm; Calbiochem, San Diego, CA, USA) was added to the bath.
Cell morphology
After the recording sessions, slices were fixed in 4% paraformaldehyde and 0.1% glutaraldehyde in 0.12 m sodium phosphate buffer overnight. Slices were incubated in anti-LY biotinylated antibody and both neurobiotin and LY were revealed using the avidin–biotin complex reaction (Vector Laboratories) intensified by the heavy metals nickel and cobalt. The three-dimensional morphologies of labelled MSO cells were reconstructed using Neurolucida software (MicroBrightfield, Williston, VT, USA), interfaced with a motorized stage and Z-position readout on an upright microscope. The total length of lateral and medial dendrites was measured after removing thin diameter (< 0.5 μm) dendrites. Thin dendrites lessened in number with development, and therefore could have biased comparisons across age. Dendrite lengths and the ratio of lateral to medial lengths were analysed across age. The complexity of dendritic arbors was quantified by determining their fractal dimension. The box-counting method was employed for fractal analysis, as implemented by Neurolucida and double checked using independent freely available software (Fractal Dimension Calculator, http://local.wasp.uwa.edu.au/~pbourke/fractals/fracdim/). The procedure is to count the number (N) of squares (boxes) in a square grid contacted by the dendrites as grids with decreasing square size are placed over the cell. Fractal dimension (D) is given by the relationship between increasing N and decreasing square size (s): D= lims→0log(Ns)/log(1/s), with larger numbers indicating increased complexity.
Stimulus protocols and data analyses
Whole cell current clamp recordings were made using a Multiclamp 700A computer-controlled microelectrode amplifier and Digidata 1322 digitizer with pCLAMP 9.0 software (Molecular Devices, Union City, CA, USA). Microelectrodes with tip resistances of 2–8 MΩ were pulled from 1.5 mm borosilicate glass using a P-97 micropipette puller (Sutter Instrument Co., Novarto, CA, USA). The resting membrane potential and action potential thresholds were corrected for a calculated liquid junction potential of 14 mV (custom C code based upon Barry, 1994) and JPCalcW module in pCLAMP). Data were collected at a sampling rate of 20–40 kHz and filtered at 10–20 kHz; some traces were processed through smoothing procedures implemented in Gnuplot (v 3.7; http://www.gnuplot.info/). Some data were collected at higher sampling rates to eliminate effects of sampling on action potential amplitude.
Input and slope resistance
Input resistance was determined from V–I curves, which were generated by measuring the voltage response to a series of hyperpolarizing and depolarizing current steps (P13 MSO neuron is shown in Fig. 1A). Voltage deflections were measured (using Clampfit, Molecular Devices) by averaging in a 5 ms time window during the early part of the pulse (double arrows in Fig. 1A), in order to better assess the state of the cell as it initially responds to synaptic inputs. This early time window also incorporated the peak hyperpolarization.
Figure 1. MSO cell characteristics and experimental protocols.

A, most MSO cells after P10 respond phasically to depolarizing current. Family of voltage responses to hyperpolarizing and depolarizing current steps in P13 cell at physiological temperature. B, V–I curve (top graph) constructed by averaging between times indicated by the double arrows in panel A. This temporal window was chosen to follow the afterhyperpolarization of the action potential and include the peak hyperpolarizing voltage. The slope resistance (Rsl) is calculated across a range of voltages (bottom graph) and decreased with depolarization of the cell. Rsl at the resting membrane potential, indicated by the open square, is the input resistance (Rin; boxed value). The value of Rsl at spike threshold (Rst), indicated by the open circle, is at or near the minimum value of Rsl. C, Rslversus membrane potential curves shifted to smaller values with increasing age. Rin values decreased more with age than did Rst values. D, Rin and Rst decreased to near mature values by P16 (n= 52 cells; number of cells per age shown in panel E). Average values connected by dashed lines. Continuous lines are single exponential fits to all data points; τRin= 4.95 days, and τRst= 6.7 days. E, percentage change in cell resistance with depolarization ((Rin−Rst)/Rin× 100) became smaller at older ages. F, experimental protocol to study integration of excitatory and inhibitory currents. Synaptic waveforms were summed across a range of relative delays of 0–1.5 ms or 0–0.75 ms, simulating application of individual excitatory inputs to each major dendrite. These simulated (sim)EPSCs, reflecting temporal delays (TD) between inputs (0, 250, 500 and 750 μs are shown), were injected through the electrode into living MSO cells in brain slices. The line over the simEPSCs shows the waveform amplitude at 0 ms TD and the length shows the simulated temporal delay for each waveform. Injection of simEPSC waveforms was performed independent of and coupled with activation of inhibition from the medial nucleus of the trapezoid body (MNTB). LSO, lateral superior olive. G–I, voltage traces induced by current injection in a separate population of cells recorded at lower temperature (30–32°C). G and H, application of α-dendrotoxin (DTX) to the cell in panel G converted phasic to tonic response. I, tonic cells generated a sustained response to depolarizing current. Triangles indicated voltage sag with hyperpolarizing current, which also occurred in tonic neurons. Data in this and subsequent figures shown as means ±s.d.
Because V–I curves were nonlinear (Fig. 1B, top panel), a global analysis of the V–I curve was performed by computing the first derivative (which is the slope resistance, Rsl) and plotting that value as a function of membrane potential (Fig. 1B, bottom panel). The V–I plots, which could be noisy in small regions of the curve due in part to the presence of spontaneous EPSPs and IPSPs, were fitted using a cubic spline and smoothed using Gnuplot prior to calculating derivatives numerically using custom written C code.
The Rsl value at the resting membrane potential (boxed value in Fig. 1B) is defined when injected current is 0 nA. This value is also commonly reported as the input resistance (Rin), so we adopt that convention in this report (Rin= 43 MΩ for this cell). Two features of these plots were compared among ages: Rin and the slope resistance at spike threshold (Rst; circled value in bottom panel of Fig. 1B; Rst= 13 MΩ). Rst was measured because it provided a reliable and systematic estimate for the lower bound for the change in resistance, due to summed effects of voltage dependent conductances activated by depolarization. The percent change in Rsl with depolarization was calculated as ((Rin−Rst)/Rin) × 100. We also determined the threshold current and voltage for action potential generation and the amplitude from spikes generated at threshold.
Temporal delay sensitivity
Excitatory inputs were modelled as α functions, and a series of waveforms that simulate binaural interactions between excitatory inputs were derived from introducing a range of temporal delays (TD) between individual inputs and summing them. Waveforms having TD values between 0 and 1.5 ms in steps of 0.1 ms or 0–0.75 ms in steps of 0.05 ms were created and stored. The resultant waveforms were then injected as simulated binaural excitatory postsynaptic currents (simEPSCs) into living MSO neurons (Fig. 1F), based on procedures implemented by Reyes et al. (1996). Sets of simEPSCs were derived from individual EPSCs having overall durations of 1–10 ms, which overlap published values (Grothe & Sanes, 1993; Smith, 1995; Smith et al. 2000; Scott et al. 2005) and match data reported here. Different duration simEPSCs were used to mimic developmental changes across age, test the ability of cells to respond to short excitatory waveforms and quantify the contribution of excitatory waveform duration to TD sensitivity. Currents were injected rather than conductances based on a previous study (Reyes et al. 1996), where the essential results of both approaches were the same. Phasic MSO neurons dissipate their membrane potential quickly when an EPSP does not generate a spike, so the charge due to current injection does not accumulate between stimuli. Currents were injected as trains of 10 simEPSC waveforms presented at 50 or 100 Hz, with each simEPSC waveform having the same TD value. TD values were changed randomly between each train of 10 simEPSC waveforms and each TD value was repeated 6 times in the stimulus set for a total of 60 stimuli per TD value. Trains were separated by 125–500 ms.
TD curves were constructed by dividing the number of action potentials evoked at each TD value by the number of stimuli. Normalized spike rates for each TD curve varied from 0 (0 spikes/60 stimuli) to 1.0 (60 spikes/60 stimuli) and are reported in units of normalized spike count/ms (1/ms). The slope of the TD curve was calculated from a linear fit between normalized rate values of 0.8–0.2 (the rate declined with increasing TD value). If the rate did not decrease to 0.2, the line was fitted to all rate values below the maximum rate. Sensitivity to TD was estimated for each cell by considering responses to each stimulus within a train (N= 60 stimuli) as independent events, which we verified for our data, that either did or did not generate an action potential. Spike activity could be treated, then, as a binomial distribution having probability (p) equal to the normalized firing rate (R). By using a binomial distribution, we made fewer assumptions about the underlying distribution of spike rates in our measures of TD sensitivity. We used the firing rate at TD = 0 ms as a reference (p1, R1), and calculated the probability that a response (p2, R2) was different from the reference. For example, for the most common case of declining rates with increasing TD, we calculated the probability that R2≤R1 as:
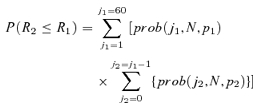 |
where prob(j, N, p) represents the probability mass function for an outcome of j spikes in N trials given probability p. In essence the overlap in the two binomial distributions was calculated by weighting each value in the response distribution (p2, R2) by its overlap with the reference distribution (p1, R1). No overlap between distributions yields a value of 1. A plot of P(R2≤R1)versus R2 was used to determined a just noticeable difference (jnd) between the probability distributions, defined as when P(R2≤R1) ≥ 0.7. This value corresponds to a difference of 1 standard deviation between distribution means (scaled by their variance), typically taken as a threshold measure (70% correct) in two-alternative forced choice experiments (see Macmillan & Creelman, 1991). The minimum value of R2 satisfying this condition was used to interpolate a jnd value for TD from the TD curve for the cell.
IPSPs and EPSPs
IPSPs and EPSPs were evoked by electrical stimulation (S940/S910 stimulus adaptor/isolator, Dagan, Minneapolis, MN, USA) of the MNTB, which could also activate excitatory fibres of passage. In some cases EPSPs were elicited in isolation. When IPSPs could be elicited, antagonists of excitatory, glutamatergic neurotransmission (CNQX 10 μm, MK-801 10 μm) were added to the bath. Latencies were measured from the start of the stimulus artifact to the onset of the IPSP. Repetitive stimuli varying in frequency from 10 to 150 Hz were applied to evaluate the frequency following capability of MNTB inputs to MSO cells. IPSPs in response to low frequency stimuli (10 or 50 Hz) were used to quantify their characteristics across age. Averaged EPSPs and IPSPs were generated from 15 to 20 individual responses and fitted to an α function with two terms, yielding an average correlation coefficient of 0.91. The weighted average of the time constants (weights determined from the fitting procedure) were compared across ages. Methods for activating IPSPs along with injection of simEPSCs are described in Results. All data are presented as means ±s.d., except where noted.
Results
Neuron classification and experimental conditions
Nearly all experiments were conducted using brain slices maintained at 35.5–37.5°C. In particular instances where noted, recordings were made at 30–32°C. This study focused on changes in MSO cell properties preceding and following the initial phase (P10–12) of hearing onset (McFadden et al. 1996) in order to identify developmental beginning and end points for structural and functional features of these neurons in relationship to airborne auditory experience. Older animals, P17–20, were included in this population to place these analyses in the context of developmental end points for input resistance and postsynaptic potentials described in recent reports (P15–35: Scott et al. 2005; P12–20: Magnusson et al. 2005) and assess the effect of recording at physiological temperature.
From the earliest age that was studied, we noted two populations of MSO neurons in the principal cell column based on their response to sustained depolarizing current. These populations were categorized as phasic if one or two spikes were generated at stimulus onset, or tonic if a train of spikes was generated throughout the stimulus duration (Fig. 1G and I). In an initial set of experiments conducted at 30–32°C, we recorded 171 phasic and 80 tonic cells between P6 and P16. Tonic cells constituted a decreasing fraction of the total with increasing age: P6–9, 45% (34/76); P10–12, 31% (25/80); P13–16, 22% (21/95). Application of α-DTX to the bath converted phasic to tonic activity in response to depolarizing current (Fig. 1H), consistent with previous reports of MNTB and MSO cells (Brew & Forsythe, 1995; Svirskis et al. 2002). Tonic neurons have been reported for gerbil MSO at ages P11–17 (Svirskis et al. 2002), and adult guinea pigs (Smith, 1995), although in guinea pigs, the tonic responses were associated strictly with marginal cells lateral to the principal cell column. Based on the decreasing fraction of tonic cells with age, recordings made at physiological temperature were focused on phasic neurons.
Decrease in membrane resistance occurs from before the onset of hearing until P16
Phasic neurons of the auditory brainstem are proposed to decrease their resistance significantly upon depolarization in order to raise thresholds for delayed excitatory inputs and improve coincidence detection (Manis & Marx, 1991; Brew & Forsythe, 1995). V–I curves of phasic neurons were generated and analysed to measure the decrease in cell resistance with depolarization and describe developmental changes in these parameters relative to the onset of auditory experience. Input resistance (Rin) was measured because it is a standard metric to compare cells and Rst because it provides a lower bound for the change in resistance during a synaptic input (see Methods). Representative cells at different ages illustrate a downward shift of the slope resistance (Rsl) curves with age (Fig. 1C). At older ages (P15–20) the Rsl curves were nearly flat.
Across the population of phasic cells, Rin declined from young ages (P7) to older ages (P20; exponential fit yields τ= 4.95 days) and by P16 approached values at P20 (Fig. 1D). From age P14, some cells exhibited passive electrical properties characteristic of more mature animals. Even at young ages, Rst values were low, about 50 MΩ at P7 (Fig. 1D). These Rst values showed a steady decline until P16 (exponential fit yields τ= 6.7 days), although with a slower time course than Rin. The decline in Rin and Rst was not matched by changes in resting membrane potential, which averaged −64 ± 4.1 mV between P10 and P16, with no trend across age.
Differences between Rin and Rst for individual cells could be as high as 180 MΩ in young animals (P7), and as low as 5 MΩ in older animals, and on average this difference declined until P16 (distance between Rin and Rst curves in Fig. 1D). Therefore, in older animals the decrease in Rsl during a depolarizing input may not greatly reduce the amplitude of a lagging depolarizing input as a mechanism for improving ITD sensitivity. However, assuming that both inputs are similar in current amplitude, the relative effectiveness of a lagging excitatory input is determined by the percentage change in cell resistance induced by the preceding input. Average values for this parameter were calculated for each day, and ranged between 20% and 60% after P12 (Fig. 1E).
Rin was measured at physiological temperature for a limited population of tonic neurons between P14 and P22 (n= 10). These values were as large as 180 MΩ at P14 and 80 MΩ at P19–22, and did not overlap values for phasic neurons. These data suggest that tonic neurons constitute a distinguishable population during the third week of development, but they may simply proceed along a slower maturational time course to become phasic neurons.
Development of excitatory and inhibitory synaptic potentials
EPSP duration decreased rapidly prior to P14
The duration of EPSPs and EPSCs in gerbils has been shown to decrease from P14 (the earliest age tested) to short durations, on the order of 1 ms, at ages older than P20 (Scott et al. 2005). We measured the change in EPSP duration across a range of ages encompassing earlier time points to determine its developmental time course relative to the onset of auditory experience and to examine whether recordings at physiological temperature reveal faster synaptic waveforms at younger ages than has been reported. Our data revealed long EPSPs, exceeding 30 ms, prior to P10 with decreased duration to values ≤ 2 ms by P14 (Fig. 2A). By P11 EPSPs became relatively fast and had shorter durations (about 4 ms) than projected from recordings in older animals (Scott et al. 2005). The EPSPs matured with a time constant (τEPSP= 1.4 days; Fig. 2C) that was faster than the decrease in Rin (τRin= 4.95 days). Furthermore, these data defined a physiological range of stimulus durations that guided our investigation of temporal delay (TD) sensitivity.
Figure 2. Maturation of stimulus-evoked excitatory and inhibitory synaptic potentials at physiological temperature.

A, the duration of EPSPs decreased with age. Lowest graph shows EPSP at P8 fitted with two-term α function (grey line through trace; weighted time constant (τw-EPSP) with weights determined by the fit was 4.32 (ms). B, the duration of IPSPs evoked by MNTB stimulation decreased with age, but values were as long or longer than EPSPs at each age. Lower graph shows IPSP at P10 fit with two-term α function (grey line through trace; τw-IPSP= 4.06 ms). C, weighted time constants for EPSPs (boxes) decreased rapidly and became relatively fast by P12 (n= 30 cells). Continuous line single exponential fit; τEPSP= 1.4 days. IPSPs decreased rapidly and became relatively fast by P16 (n= 25 cells). Continuous line single exponential fit: τIPSP= 2.05 days. D, recording of IPSPs from a P16 MSO cell in response to varying rates of MNTB stimulation. E, after P11, IPSPs follow the stimulus frequency at increased rates and by P13 can respond at 100 Hz with at least 80% entrainment (n= 16 cells; P11, 14, 18 one cell; other ages 2–4 cells).
IPSP duration was longer than EPSP duration
Previous recordings from gerbils revealed long duration IPSPs and IPSCs between P12 and P14, just after the earliest phase of hearing onset in gerbils, which remain long relative to EPSPs up to P20 (Magnusson et al. 2005). We reasoned that IPSPs would be faster when recorded at physiological temperature and may approach or even be faster than EPSPs, as has been proposed (Brand et al. 2002). We also sought to determine when IPSP duration began to decrease relative to hearing onset. IPSPs, evoked by stimulation of the medial nucleus of the trapezoid body (MNTB; Fig. 1F), decreased in duration with age from average values approaching 40 ms at P10 to values of 3–4 ms between P16 and P18 (Fig. 2B). Durations decreased by about 80% between P7 and P16, as reflected by the change in the weighted time constant (Fig. 2C). Evoked IPSPs matured more quickly (τIPSP= 2.05 days) than the decrease in Rin but were as long or longer than EPSPs at each age (Fig. 2C). At the earliest ages (P7–9) spontaneous IPSPs were apparent but it was difficult to electrically evoke activity in these cells. The inability to evoke IPSPs in some slices may reflect the severing of axons during brain slice preparation, especially if some axons run perpendicular to the plane of section or have different branching patterns at young ages. Note that inhibitory inputs to MSO in rats do not become consistently hyperpolarizing until P8 (Lohrke et al. 2005), so immaturity of this connection may make activation more difficult at the earliest ages we studied.
Frequency following improved after hearing onset
MNTB cells in vivo receive high rates of input from globular bushy cells for sustained durations (Spirou et al. 1990; Smith et al. 1991; Kopp-Scheinpflug et al. 2003), but the development of frequency following in the MNTB-MSO neural connection has not been investigated. We measured the capability of inhibitory inputs to follow a range of stimulus frequencies applied to inhibitory inputs. Frequent failures occurred in younger animals at stimulus frequencies greater than 10 Hz. However, at ages P13 and older, over 80% of stimuli at 100 Hz elicited IPSPs and by P15 responses were nearly entrained at 150 Hz (Fig. 2D and E).
Temporal delay sensitivity coincides with the initial phase of hearing onset
Stimulus paradigms
Given the presence of phasic neurons prior to P10 and the large changes in Rsl they exhibit upon depolarization, we inquired to what extent MSO neurons were sensitive to temporally delayed stimuli at ages encompassing the early stages of hearing onset. To accomplish this goal, waveforms that simulated interaural temporal delays (ITD) matching and longer than what would be experienced in vivo (estimated to be 120 μs; Brand et al. 2002) were injected into MSO neurons. Note we employ the terminology ‘temporal delay’ in reporting experimental results, because we are simulating in vitro the ITDs that can only be presented experimentally in vivo. These stimuli, which we call simulated (sim)EPSCs, represent a simplified form of the excitatory currents that an MSO cell would experience in vivo. However, these stimuli permitted assessment of the intrinsic sensitivity to TD of neurons across a range of postnatal ages, independent of maturation of excitatory synapses. A salient feature of simEPSC stimuli is reduction of the peak amplitude of the waveform injected into the cell with increasing TD (Fig. 1F).
Phasic neurons are sensitive to temporal delay
Trains of 10 simEPSCs having the same TD value were injected into the somata of MSO cells through the recording pipette, and TD values were changed randomly between trains. The gain for injection of simEPSCs was fixed within a stimulus set, which included all TD values repeated 6 times in random sequence. Because action potential thresholds varied by cell, the gain to generate activity for the measurement of TD sensitivity varied among cells; higher gains for each cell were normalized to this value. Voltage responses to stimulus waveforms injected into a P15 cell (delays of 0, 250, 300 and 500 μs) showed that the number of evoked action potentials decreased with small increases in TD (Fig. 3A). Action potential amplitude could vary during trains, regardless of TD value, but did not differ consistently among TD values.
Figure 3. Assay for sensitivity to temporally delayed excitatory inputs.

A, voltage response to injected currents that simulate temporally delayed EPSCs (simEPSC). Action potentials are indicated by asterisks. Delays of less than 1 ms resulted in significant changes in evoked spike rate. Four trains of 10 voltage responses corresponding to temporal delays 0, 250, 300, 500 μs are shown. B, a series of temporal delay (TD) curves from the same P15 MSO cell as in panel A. The TD values for the voltage responses depicted in panel A are indicated by arrows. Increasing the amplitude (gain) of the injected current generated TD curves with increased rate at each TD value until a saturating response was reached (○). Further increasing the gain shifted the decline in spike rate to larger TD values (▵). Gain values are indicated in the key as the peak injected current for the 0 μs TD waveform normalized by the smallest value used. Due to differences in spike threshold, gain values are not directly comparable among cells. C, TD curves from a single MSO cell at P11, generated using simEPSC durations of 2 or 10 ms. Short duration waveforms (2 ms) generated non-monotonic TD curves at low stimulus gain (▪) but longer duration waveforms (10 ms) generated monotonic TD waveforms (rate decreasing with TD, •). For each stimulus duration, increasing stimulus gain generated saturated TD curves and shifted the decline in rate to larger TD values (□ and ○). Recordings in A–C made at physiological temperature. D–F, phasic neurons exposed to α-dendrotoxin (DTX) and tonic neurons were not sensitive to temporal delay. In D and E, experiments conducted at 30–32°C. D, slope of the TD curve decreased when phasic neuron was exposed to α-DTX. If stimulus gain was kept constant, then the response saturated at all TD values. One of the responses to a train of 10 stimuli is shown for selected data points. E, decrease in slope across a population of cells following α-DTX application. Slope values are negative to indicate decreasing rate with increasing TD value, and are expressed in units of normalized spike count per millisecond. F, responses of a tonic neuron at P15 to simEPSCs (2 ms duration) was independent of TD value. Recording was made at physiological temperature.
At relatively low stimulus gain, the TD curve peaked at 0 μs TD, representing maximal activity for simEPSC waveforms that reflect perfect coincidence (curve with squares in Fig. 3B). The firing probability decreased to zero over a narrow range of delays up to 250 μs. Note that reflecting these plots about 0 μs TD would more closely resemble ITD curves generated in vivo that incorporate delays greater to and less than the value yielding the peak response. Increasing the stimulus gain so that the cell responded to every stimulus at small TD values (normalized rate = 1, which we refer to as a saturated response) resulted in a steeper decline in rate with increasing TD, but at larger values of TD between 150 and 350 μs (curve plotted with open circles in Fig. 3B; arrows point to TD values that correspond to voltage traces in Fig. 3A). Further increasing the stimulus gain shifted the curves to the right along the TD axis (remaining curve in Fig. 3B), and could lead to further small increases in the slope of the TD curve. Although the decline in normalized rate for saturated TD curves occurred at TD values outside of the physiological range of hearing for gerbils, these saturated TD curves illustrate the maximum slopes exhibited by maturing MSO cells. In a later section we show that inhibition can interact with high gain excitation and shift these steep slopes into the physiological range for TD values that the gerbil would experience.
A somewhat different picture emerged for many cells at ages younger than P14, as illustrated for a P11 cell (Fig. 3C). For short duration waveforms (2 ms is shown), low gain stimuli generated a non-monotonic change in rate with increasing TD. The rate could be nearly zero at perfect coincidence (TD value of 0 μs) and peak at a TD value between 200 and 300 μs, then decline to zero over a small range of TDs (200–300 μs; filled squares in Fig. 3C). Increased stimulus gain could generate saturated TD curves as recorded from older animals (open squares in Fig. 3C). Notably, TD curves for stimuli similar to and longer than EPSPs recorded at this age were monotonically decreasing at all stimulus gains (10 ms; filled and open circles in Fig. 3C). A possible explanation for non-monotonicity in TD curves using short duration simEPSCs is that action potentials emerged from the latter part of the simEPSC (data not shown), indicating that a minimum integration time is required to recruit sufficient Na+ channels to generate a spike. This maturational step may reflect changes in Na+ channel gene expression, as has been reported in other developing systems (Van Wart & Matthews, 2006). The decrease in EPSP duration with age (Fig. 2C) may match the developing capability of the MSO cell to integrate charge and generate an action potential.
Temporal delay sensitivity is reduced by α-DTX
In experiments conducted at 30–32°C, long duration simEPSCs (10 ms) were used as stimuli and could generate non-saturating, monotonically declining TD curves (Fig. 3D, control). The sensitivity of phasic neurons to α-DTX (Fig. 1H), a blocker of KLT channels, led us to investigate its effects on responses to simEPSCs. Addition of 10–100 nmα-DTX to the bath resulted in entrainment of the phasic cell over the full range of TD values (Fig. 3D). Reducing the stimulus gain to prevent entrainment revealed that the slope of the TD curve was indeed reduced by α-DTX (Fig. 3D and E), but could still exhibit small values.
TD curves were also generated for tonic neurons. In contrast, tonic neurons exhibited relatively little change in firing rate with TD. Overall, the slope for tonic neurons was −0.1 ± 0.19 1/ms (n= 33 stimulus gains from 12 cells), which differed from this population of phasic cells (−1.4 ± 0.73 1/ms; n= 131 gains from 40 cells; P < 0.0001 unpaired t test; all cells recorded at 30–32°C). Few tonic neurons were studied at physiological temperature, but exhibited little sensitivity to TD (Fig. 3F; 2 ms simEPSC). In fact, cells could fire stereotypically, regardless of TD value, indicating their lack of sensitivity to the fine structure of the stimulus.
simEPSC duration affects the slope of TD curves
The effects of presenting simEPSC waveforms of different durations, and each duration across a range of stimulus gains are shown for two cells, one from P10 and the other from P16 (Fig. 4A; dashed lines, 2 ms duration; continuous lines, 10 ms duration). The durations of simEPSCs encompassed the durations of EPSPs that we recorded from P10–20 animals. Each line extends from upper left to lower right, revealing that increased stimulus amplitude for a given stimulus duration yielded a steeper (more negative, because rate decreases with TD) slope of the TD curve, regardless of age. Furthermore, the lines for the shortest duration waveform (2 ms) are located lower on the graph for each cell (age), indicating that short duration waveforms generated TD curves having steeper slopes. The lines for the shortest duration waveform were also shifted to the right on the graph for each cell (age), indicating that greater current amplitude was required for short waveforms to generate a spike. Therefore, even for cells having a small Rin, restricting TD by having short EPSCs would require increased synaptic current to activate the cell.
Figure 4. Slopes of TD curves steepened with age and with decreasing simEPSC duration.

A, the slope of the TD curve became steeper (more negative) with increased stimulus amplitude regardless of stimulus duration (2 and 10 ms are shown). Current values on abscissa are the peak current for a 0 μs TD simEPSC waveform. For a given age (P10 and P16 are shown), shorter duration stimuli required larger peak currents to activate the cell. Short duration stimuli yielded steeper slopes for TD curves than long duration stimuli (for each cell, dashed traces are lower on graph than solid traces). B, population data revealed that TD curves became steeper with age beginning at about P10. Slopes of non-saturated TD curves for 1, 2 and 4 ms simEPSCs plotted with triangles, circles, and squares, respectively, as mean ±s.d. When data points represent measurements from a single cell, the mean value is plotted without bars indicating s.d. Data for 1 and 4 ms simEPSCs are shifted to the left and right at each age for clarity of viewing. Not all stimulus durations could be presented to each cell. Slopes for non-monotonic TD curves measured as decreasing rate from peak value. Inset, at P15, relationship between slope (s) of TD curve and duration (d) of simEPSC fitted by s=a+c/d, where a (asymptotic value of TD slope) =−0.12; c (curvature of function) =−7.3. C, half-width values showed the same trends with age as slope of TD curves. D, discriminability of TD values measured as just noticeable differences (jnd) from TD = 0 ms or from TD value yielding peak rate response. Longer duration simEPSCs presented at P9–11 to better match the duration of EPSPs recorded at that age. jnd values became smaller with age and some cells achieved values in response to longer duration simEPSCs within the physiological limit for ITD sensitivity in adult gerbil (horizontal dashed line) as early as P10. Number of cells indicated for each data point; 53 total cells were studied. Largest number for each age indicates the total number of cells studied at that age, except for P10 (4 cells), P14 (10 cells) and P15 (11 cells).
Age dependence of responses to TD
The development of sensitivity to temporal delay, indicated by the slope of the TD curve averaged for each age, was studied using a range of short duration inputs (1, 2 and 4 ms). These durations were chosen because they bracket the range that we measured after P10 and published values (Scott et al. 2005) and could be used to determine the age at which TD sensitivity approached adult values. A range of durations were used because it also seems likely that convergent excitatory inputs to MSO cells do not have identical latencies and their disparate locations on the dendritic tree can extend composite excitatory waveforms to longer durations (Zhou et al. 2005). Using this range of values also permitted quantification of the relationship between simEPSC duration and TD sensitivity. The average slopes of non-saturated TD curves began to decrease (more negative, steeper slope values) at P10 and decreased steadily until P16 (Fig. 4B). Although we had few samples at older ages, these data suggest that the slope may continue to decrease. Slopes for non-monotonic curves, from young animals, were determined at TD values longer than the peak response. At P15, when cell resistance reached near-adult values, we measured a hyperbolic dependence of TD slope on simEPSC duration, becoming steeper with decreasing duration (Fig. 4B, inset). A similar decrease in TD slope with age held for saturated TD curves, which always had steeper slopes than non-saturated TD curves. By P14, MSO cells exhibited near-maximal slopes measured from saturated TD curves, about −20 normalized spike counts per millisecond (data not shown). Therefore, the duration of excitatory waveforms acts in concert with other cellular characteristics, such as low input resistance and resistance changes with depolarization, to delimit the coincidence detection process.
Quantification of TD discrimination
The discriminability of TD across age for non-saturated curves was calculated, assuming binomial distributions at each TD value for the responses to simEPSC stimuli (see Methods). The binomial probability was estimated by the normalized firing rate at each TD value. For monotonically declining TD curves, which constituted the majority of curves at ages older than P13 using short duration stimuli, we calculated the jnd for a change in TD from 0 ms. This approach is analogous to determining the just detectable angular change in the location of a sound source from a position directly in front of the head. For non-monotonic TD curves recorded from younger animals, we calculated the jnd for an increase in TD from the value yielding the peak response. These analyses indicated that, even at ages immediately preceding hearing onset, MSO neurons were capable of discriminating small changes in TD (Fig. 4D). TD sensitivity improved with age and was best for the shortest duration simEPSC waveforms. Because MSO neurons did not generate monotonic TD curves in response to short duration stimuli (1–4 ms) reliably at ages surrounding the initial phase of hearing onset at P10, we presented longer duration waveforms (6, 10 ms which were similar to inputs they would experience in vivo) to cells at P9–11. The TD curves generated by these stimuli demonstrated sensitivity within the physiological range for ITD of gerbils (120 μs, indicated by horizontal dashed line) as early as P10 (data for 6 ms are shown in Fig. 4D).
We measured the half-width of non-saturated TD curves and these values decreased with age, similar to slopes of the TD curves (Fig. 4C). At P15, after reflecting the curve about 0 μs, to more closely resemble ITD curves measured in vivo, these values averaged 0.34, 0.40 ± 0.18 and 0.86 ± 0.13 ms for 1, 2 and 4 ms duration waveforms, respectively. Because stimulus effects at 100 Hz do not accumulate between stimuli within a train, this paradigm reflects intrinsic TD sensitivity of the MSO cell. These values overlapped values from mid-frequency (most sensitive) regions of nucleus laminaris recorded in vitro (Kuba et al. 2002, 2003, 2005). Also, because the simEPSC stimuli are deterministic and essentially have zero variance within a stimulus train, we compared them to in vivo recordings at high frequency (> 1 kHz), where the variance of response phase is limited by the stimulus period (Fitzpatrick & Kuwada, 2001). The half-width values we measured in vitro for the shortest duration waveform corresponded to ITD sensitivity measured at frequencies of about 1.5 kHz (1/(2 × 0.34 ms half width); Goldberg & Brown, 1969; Carr & Konishi, 1990; Yin & Chan, 1990; Spitzer & Semple, 1995; Fitzpatrick & Kuwada, 2001).
Temporal delay processing in the presence of inhibition
The ability of IPSPs to follow high frequency stimuli at P15 and the existence of monotonic, steep TD curves in response to short duration stimuli coincides with the earliest demonstration of ITD sensitivity in vivo, in single unit recordings from the auditory midbrain (Seidl & Grothe, 2005). Many parameters for inhibition in vivo are unknown, such as the timing of IPSPs relative to EPSPs. During a periodic stimulus, IPSPs that lag EPSPs on one cycle lead the next cycle, so a range of relative onset times are possible, but the effects of varying the timing of inhibition have not been systematically explored. Therefore, we investigated the effects of synaptic inhibition on TD curves at this age across a broad range of relative onset times. Furthermore, at P15 many aspects of MSO cell function are nearly mature but still developing, so interactions between inhibition and excitation could play dual roles in development and normal function such as sound localization.
The experimental protocol to vary the timing of inhibition relative to excitation is shown in Fig. 1F. Short simEPSC waveforms (2 ms and 4 ms duration) were used to generate TD curves. At physiological temperature, it was challenging to verify the patency of evoked inhibition, set appropriate, high gains to activate the MSO cell and complete the stimulus protocol; therefore, we report data from three MSO cells. Complementary data from another 10 cells recorded at lower temperature (30–32°C) are also described to demonstrate the generality of our results. IPSP onset time was changed in 0.5 ms increments across a broad range of times, typically −5 to +2 ms, relative to injection of simEPSCs. The timing of inhibition was constant during generation of each TD curve; 5–10 s elapsed between runs having different IPSP onset times.
Each of the three traces in Fig. 5A show the response to the first five simEPSCs out of a train of 10 simEPSCs; in each trace we show a sequence of 0 μs TD waveforms, so only the onset time of the IPSP differs among traces. When the IPSP led the simEPSC by 3.7 ms (top trace) or lagged by 2.3 ms (bottom trace), the cell generated an action potential (indicated by asterisks) in response to each simEPSC waveform. However, when the onset of the IPSP was nearly coincident with the onset of the simEPSC, 2/5 waveforms did not elicit a spike. Note that the IPSP was of short enough duration to be complete prior to the next simEPSC in the train. The onset time of the IPSP relative to the simEPSC was corrected for conduction delay from electrical shock of the MNTB (typically 1–1.5 ms).
Figure 5. Effects of inhibition on TD sensitivity.

A, three traces, each showing the response of the cell to a simEPSC train when IPSPs lead (top trace), are nearly coincident with (middle trace) or lag (bottom trace) injection of simEPSCs. In each trace, the first five (out of a train of 10) responses to successive injections of 0 ms TD simEPSCs are displayed. Artifacts of electrical shock to the MNTB were not removed. The first artifact in the top two trains is identified by an inverted triangle; artifact in bottom train is not visible because it occurs during the action potential. IPSPs in the middle trace are nearly coincident with simEPSCs and are difficult to identify, but inhibited the generation of action potentials. Threshold for action potential (asterisks) detection indicated by horizontal dashed lines. B, a series of TD curves from the same cell depicted in panel A, with different IPSP onset times. The onset time of the IPSP relative to the simEPSC waveform is indicated in the key. Inhibition caused a reduction of rate as evidenced by shifting the TD curve to the left, and reduction of the rate from saturation (value of 1) to non-saturating responses. A 3-D plot of the TD curves (viewed from two different angles) is shown in the lower part of the panel and illustrates the range of IPSP onset times that affect the TD curves. TD axis is plotted orthogonal to IPSP onset time. Height of graph represents normalized spike rate at each combination of TD and IPSP onset time. Trace for −0.2 ms IPSP onset time, which yielded a monotonically declining slope within the physiological range of ITD, is indicated as dashed bold line. Surface is plotted using interpolation with natural cubic splines for better visualization. C, same cell as in other panels, but using 50 Hz stimulation within trains of simEPSCs and a larger range of IPSP onset times. Leading IPSPs could result in a TD curve having a peak at non-zero TD (bold dashed line). Lagging inhibition that generated declining slope within the physiological range of ITD is indicated as continuous bold line. D, same cell as in panels B and C, but at lower temperature T= 30°C. Lagging inhibition that generated declining slope within the physiological range of ITD is indicated as continous bold black line. E. Interaction of IPSPs with simEPSCs in a second cell revealed responses similar to those in panels B–D. Continuous bold line in right panel indicates declining slope within the physiological range of ITD. F, interaction of IPSPs with simEPSCs in a third cell, which had significant spontaneous IPSPs. Near-simultaneous leading inhibition substantially reduced activity. Continuous bold line in right panel indicates declining slope within the physiological range of ITD.
The resultant TD curves from a series of IPSP onset times are shown in Fig. 5B. Both leading (−1.7, −1.2, −0.2 ms) and lagging (+0.3 ms) inhibitory times could reduce the driven rate and, in effect, shift TD curves downward and to the left. The slopes of these shifted TD curves were small when measured within the gerbil physiological range for ITD processing (0–120 μs); the curves declined steeply at larger TD values. Notably, only one TD curve, at − 0.2 ms IPSP onset time, exhibited a monotonically declining rate through the physiological range (thick dashed trace). The family of TD curves is re-plotted as a 3-D surface (Fig. 5B) to visualize more globally the interacting effects of IPSP onset time and TD. The flat surface at the top of the plot indicates the saturated responses at this simEPSC gain. Despite this high amplitude excitation, inhibition could carve a deep trough in the response, and the window for that response extended over a several millisecond range of IPSP onset times (2 ms for this cell).
In order to mitigate potential effects of lagging IPSPs on the next simEPSC in the train, the effects of inhibition were studied in the same cell at 50 Hz (instead of 100 Hz), over a wider range of IPSP onset times (Fig. 5C, right panel). We also used slightly longer simEPSC waveforms (4 ms duration), which also generate TD curves having steep slopes (Fig. 4B). Just as with 100 Hz stimuli, strong inhibition of the TD curve occurred over at least a millisecond range of IPSP onset times. Two features of these TD curves were noted. First, a sharp change in the response occurred when the IPSP onset moved from leading to lagging the simEPSC (+0.3 ms, thick continuous trace in Fig. 5C), whereby the firing rate was reduced substantially but declined monotonically through the physiological range. Only a single IPSP onset time generated this response. Larger lagging values for inhibitory onset time did not affect the TD curve. Second, when the IPSP preceded the simEPSC by −0.7 ms, the peak of the TD curve occurred at a non-zero TD value, 300 μs, rather than at 0 μs (thick dashed trace in Fig. 5C, left panel). This response feature also was only generated by a single value for IPSP onset time.
Given the effects of increasing temperature on reducing spike amplitude and increasing spike threshold (presented in the following section), we studied the same cell at a lower temperature (30°C; Fig. 5D), which is more typical for in vitro brain slice studies. At this temperature lower stimulus amplitudes activated the cell so the stimulus gain was reduced. In contrast to high temperature, then, inhibition was more effective in reducing spike activity. Coincident inhibition (0 ms) nearly eliminated any response, suggesting that excitatory inputs to MSO neurons must be of large amplitude when inhibitory inputs are active. As was shown in Fig. 5C, a single value for lagging inhibition resulted in a steep, monotonically declining rate through the physiological range (thick continuous trace in Fig. 5D, right panel).
IPSP/simEPSC interactions were recorded at physiological temperature from two other cells (Fig. 5E and F). In both cells, leading inhibition could also reduce firing rate such that TD curves had low slope within the physiological range of ITD sensitivity. Notably, a single value for IPSP onset time, which lagged the simEPSC onset, yielded a TD curve having a monotonically and steeply declining rate within the physiological range of ITD (thick continuous traces in the right panels of Fig. 5E and F). The results from these cells indicate that the relative timing of inhibition and excitation, most reliably small values of lagging inhibition, is critical to position the steep slope of the TD curve in the physiological range for ITD.
We studied an additional 10 cells at lower temperature (30–32°C) using long duration simEPSCs (8–10 ms duration), because IPSPs were also of longer duration at lower temperature (not shown), but with otherwise identical protocols. These cells exhibited qualitatively similar responses to those studied at physiological temperature. For saturated TD curves, a limited range of lagging delays (typically one value) in IPSP onset time yielded TD curves having a monotonically declining rate within the physiological range (9/10 cells). In a minority of cases, lagging delay could also generate a peak shifted TD curve (3/10 cells). Peak-shifted responses could be due in part to variance in action potential latency (small average lagging delays include some leading delays) and to increasing spike latency with TD (not shown) that can lead to greater suppression of activity at the smallest TD values. Five of the 10 cells were tested not only with lagging but also with leading inhibition, and in 2/5 cells at least one IPSP onset time led to a response that peaked at non-zero TD. The salient feature of recordings from all cells at lower temperature was that near simultaneous IPSP onset times could eliminate activity across all TD values (similar to response shown in Fig. 5D). These data indicate the important effects of temperature on weighting the integration of inhibition and excitation by MSO cells. Lower stimulus gains that led to non-saturating TD curves were typically not used in these experiments even at physiological temperature because it was difficult to elicit activity in the presence of inhibition across a range of IPSP onset times (3–4 ms).
We calculated jnd values for the TD curves that had monotonically declining slopes through the physiological range (bold dashed line in upper left panel of Fig. 5B, bold continuous line in right panel in each of Fig. 5C, D, E and F) and the peak-shifted response in Fig. 5C (bold dashed line in left panel). These TD curves had jnd values within the physiological range for ITD: Fig. 5B left, 109 μs; Fig. 5C left, 114 μs; Fig. 5C right, 64 μs; Fig. 5D right, 119 μs; Fig. 5E right, 30 μs; Fig. 5F right, 71 μs. These analyses suggest that the limited temporal window over which IPSPs elicit monotonically declining or peak-shifted responses requires precision in developmental mechanisms that shape axon dimensions such as calibre and length that affect neural delays.
Action potential amplitude and threshold change with age
The amplitude of action potentials in MSO cells has been shown to decrease during the third postnatal week, which has been suggested to minimize back-propagation into dendrites of signals that may interfere with ITD processing and inactivation of sodium channels at the spike initiation site (Kuba et al. 2006; Scott et al. 2005). Assuming that MSO cells utilize a Hebbian mechanism by which action potentials reinforce particular afferent connections, then spikes may need to be of larger amplitude during early development. Therefore, the maturational profile of action potential parameters was studied in relationship to developmental milestones such as hearing onset or myelination, which occur during the second postnatal week. Furthermore, the dependence of action potential parameters on temperature (Hodgkin & Katz, 1949; Funabiki et al. 1998; Volgushev et al. 2000; Kuba et al. 2003; Cao & Oertel, 2005; Kushmerick et al. 2006) necessitates measurement at physiological temperature to better represent developmental profiles in vivo. Examples of action potentials elicited by depolarizing current pulses are shown in Fig. 6A. Note that at young ages the waveform was broader and consisted of a long lasting after-hyperpolarization. The action potential amplitude began to decrease and threshold for depolarizing current pulses increase at P10; both parameters completed a significant maturational phase by P16 (Fig. 6C and D). The voltage threshold for spike generation also increased from the earliest ages (P7–9: −45.9 ± 2.3 mV; P10–15: −34.1 ± 1.7 mV; P16–20: −39.2 ± 4.9 mV; n= 9–41, mean ±s.e.m.). The slope of the action potential depolarization became less variable and smaller, on average, after P15 (Fig. 6E). To verify that the smaller size of action potentials in older animals did not result from susceptibility of cells to high temperature, several MSO neurons were recorded as temperature was changed (one example shown in Fig. 6B, left panel). The spike amplitude changed linearly over the temperature range 28.7–37.6°C at a rate of 15 mV/10°C; spike threshold and temperature had a hyperbolic relationship (Fig. 6B, right panel; a fuller presentation of these data will constitute a separate report).
Figure 6. Changes in action potential waveshape and threshold with age.

A, examples of action potentials from the range of ages that were studied, induced by threshold depolarizing current pulses and aligned at the beginning of rapid depolarization. B, action potentials recorded from a P15 MSO neuron as the temperature was raised. Right panel, amplitude (open circles) and threshold (right ordinatei solid squares) for this cell change with temperature. Continuous line is fitted to the data: A (amplitude) =mT+b, where A= action potential amplitude, m= 1.5 mV C−1, b= 67 mV. C, the action potential amplitude reduced in size significantly between P10 and P16 (n= 75 cells; numbers apply also to panels D and E). D, the spike threshold determined from constant current pulses also increased between P10 and P16 and may increase further after P16. E, slope of depolarizing phase of action potential decreased after P15.
Development of the dendritic tree
The placement of synaptic inputs along the dendritic and somatic surface is a key element in synaptic integration and in defining the functional attributes of neurons (Cline, 2001; Van Aelst & Cline, 2004; Sorensen & Rubel, 2006). MSO neurons extend principal dendrites toward each cochlear nucleus resulting in a bipolar structure and are innervated by the cochlear nucleus toward which they extend (Ramón y Cajal, 1909; Stotler, 1953). Dendrite structure is regulated by the presence of afferent innervation (Altman & Anderson, 1972), as has been shown also for MSO and nucleus laminaris (Deitch & Rubel, 1984; Russell & Moore, 1999). Therefore, we investigated morphological changes in MSO cell dendrites during the developmental period P6–15, to determine their relationship to changes in electrophysiological properties of the cells and their synaptic inputs surrounding the onset of auditory experience. Out of a total population of 71 labelled MSO cells, we identified 40 with both dendrites that appeared to be wholly contained within the tissue slice. Cells were identified by their phasic (15 cells) or tonic (11 cells) firing patterns, or as unclassified (14 cells) in slices where both response types were encountered and an association with a particular labelled cell was ambiguous (distribution across age shown in Fig. 7D). Most unassigned cells were phasic. For example, 12 unknown cells were located in brain slices where all recorded cells were recovered anatomically; 8 cells were phasic and 4 were tonic.
Figure 7. Dendritic trees of MSO neurons became smaller and less complex during postnatal development.

A, reconstructions of biocytin and Lucifer Yellow labelled MSO neurons. Columns depict cells from each age group, which are numbered, labelled as tonic (T) or phasic (P) and associated with the appropriate symbol in panel D. Generally cells were bipolar but some cells had dorsally or ventrally projecting dendrites. Dendrites were considered lateral or medial relative to dorsal-ventral axis of MSO projecting through centre of soma. Examples of tendrils are indicated by arrows for cells nos 2 and 4; tendrils were excluded from dendritic length measurements. ax: axon. B, the total length of dendrites, excluding tendrils, decreased after P8. After P12 this value did not exceed 1 mm. C, the average number of tendrils per cell was reduced after P10. D, the fractal dimension, a measure of dendritic complexity, decreased during P10–12. Dashed line connects average values for each age. Symbol legend enclosed by box: P – phasic; T – tonic; U – unclassified, when response type could not be assigned with certainty to labelled cell.
MSO dendrites were typically thick (1–3 μm) along most of their length, and usually terminate in clubs, which can have small tendrils that emanate from their tips (Fig. 7A, representative tendrils marked by arrows for cell nos 2 and 4). One to three primary dendrites originated from each side of the cell body. The average total length of dendrites decreased with age, most sharply between P8 and P10 (Fig. 7B). At ages up to P12, 30% of cells (9/30) had total dendritic lengths exceeding 0.8 mm, whereas no cells at P13–15 exceeded this value. The number of dendritic twigs per cell also decreased, from an average of 20–30 per cell at P8–10 to an average of 6–8 per cell at P13–15 (Fig. 7C). Concomitantly, the complexity of the dendrites decreased over this range of ages. The fractal dimension of MSO cells, although small compared with other neuron types (cortical pyramidal neurons 1.4–1.6, Porter et al. 1991; Purkinje cells 1.5–1.6, Smith et al. 1993; retinal cells 1.2–1.5, Fernandez et al. 1994), decreased between P6–9 and P13–15 (1.15 ± 0.027 at P6–9 versus 1.05 ± 0.025 at P13–15, Student's unpaired t test, P < 0.0001; Fig. 7D), representing an approximate halving in the complexity of structure (Porter et al. 1991). Some cells exhibited small values for fractal dimension as early as P10. In general, there was a shift from a medial bias (0.7 lateral/medial dendrite length for P6–9; 0.85 for P10–12) to a very small lateral bias (1.1 for P13–15) in the relative size of dendritic trees. Long dendrites were probably pruned during the second postnatal week, because it is unlikely that such a large fraction (30%) of cells degenerated. In summary, these results indicate that the branching structure of dendrites matured along a more rapid time frame (P9–12) than electrophysiological properties of the MSO cell and its synaptic inputs.
Discussion
These experiments were conducted at physiological temperature in brain slices in order to provide a representative picture of biophysical, synaptic and structural properties of MSO neurons during postnatal development in vivo. Collectively many physiological parameters reached an adult-like stage of maturation through a key developmental period that ended by P16. We studied maturation of the capability of MSO neurons to encode temporally delayed stimuli and revealed that TD discrimination within the physiological range was measurable as early as P10, reached near-adult values by P16 and was reduced by blockade of KLT channels by α-DTX. In part this capability depended upon action potential parameters, which reached near-adult values during a more confined time frame of P10–16, such that the spike generation mechanism could support sensitivity to short duration (1, 2 ms) temporally delayed waveforms by P14. We studied maturation of cellular properties that affect TD sensitivity and revealed that cell resistance (Rin and Rst), which sets limits upon integration windows for coincidence detection, decreased continually from the earliest age studied (P7) to near-mature values by P16. Evoked EPSPs neared adult-like short durations (< 2 ms) by P14, and we showed that decreased duration of excitatory current increased the slope of the TD curves through a hyperbolic relationship. We also studied maturation of inhibition and temporal interactions between inhibition and excitation and showed that evoked IPSPs were as long or longer than EPSPs at all ages and could follow high frequency activation (150 Hz) by P15. Only a small range (1–2 ms) of relative IPSP and EPSP onset times yielded responses showing sensitivity to TD. Furthermore, our investigations of the maturation of dendrite structure revealed that branching complexity reduced over a more restricted time period (P9–12) than physiological properties of the cell.
Several of these properties (TD sensitivity, action potential characteristics, IPSP frequency following and dendrite structure) underwent maturation within a circumscribed time period in comparison with other parameters (cell resistance, EPSP and IPSP kinetics), which decreased monotonically during the age range that was studied. We were able to define the onset of maturation for certain parameters because our studies extended to several days preceding the initial phase of hearing onset. Our data provide a basis to investigate the interactions between gene expression and the acquisition of physiological and structural attributes that establish and define functional neural circuits.
Development of MSO in context of auditory brainstem maturation
Gerbils and many other rodents are born with closed ear canals and a non sound-transducing inner ear, so they undergo significant postnatal maturation (Woolf & Ryan, 1984; Sanes & Rubel, 1988) and are useful models to study auditory development. The onset of hearing, commonly defined as sensitivity to airborne sound, is not sudden, but nears adult-like levels over a 1 week period and can be divided into three phases of maturation: (1) an initial phase (P10–12) when a limited frequency range (0.25–8 kHz) can evoke activity only at high thresholds (> 95 dBSPL), but in only about 1/3 of animals; (2) a transition phase (P13–14) when the audible spectrum for all animals becomes adult-like (0.125–32 kHz) but thresholds are elevated (> 70 dBSPL); and (3) a refinement phase (P15–30) when hearing sensitivity reaches maturity (15–60 dBSPL depending upon frequency, although thresholds are within 20 dB of adult values by P16; McFadden et al. 1996). Consequently, beginning at P10 for some animals (and P12 for all animals) maturation occurs in the context of neural activity evoked by airborne sound. Maturation prior to P10 could also depend on synaptic activity of cochlear origin, resulting from spontaneous neurotransmitter release from hair cells or self-stimulation via vocalization as occurs in some rodent species (Ehret, 2005). The youngest animals we studied (P6) were about the same age as when inner hair cells begin to efficiently couple Ca2+ levels to exocytosis (P5; Beutner & Moser, 2001), and so the functional and structural characteristics that we studied could be affected by self-stimulation induced neural activity. Other developmental milestones, such as the myelination of nerve fibres, which is substantially completed in trapezoid body axons between P6 and P11 (Foran & Peterson, 1992), could also coordinate maturational processes.
Temporal delay sensitivity
One of our goals was to chart the intrinsic ability of MSO neurons to detect changes in temporally delayed stimuli during early development, so we bypassed activation of excitatory inputs and introduced waveforms having fixed amplitude and delay parameters directly into the cell. This approach did not incorporate contributing effects of synaptic properties such as depression and variance in EPSC amplitude or dendritic structure (Agmon-Snir et al. 1998; Kuba et al. 2002; Cook et al. 2003), but also avoided contravening effects of their developmental progression. The slopes of TD curves steepened with age, which resulted in decreased jnd values. Values for some cells fell within the physiological range of ITD, by as early as P10, in response to longer duration stimuli (6, 10 ms) that are representative of inputs in vivo. Correlations between neural activity and expression of ion channel genes during formation of neural circuits has been demonstrated for Kv3.1 channels in neurons of the inferior colliculus (Liu & Kaczmarek, 1998) and maxi-K channels in cultured neurons (Chae et al. 2005) and will need to be explored in future studies of MSO.
Another indicator for maturation of TD sensitivity was the reduction in the number of tonic neurons between P6–9 (45%) and P13–16 (22%). This trend probably reflects the developmental increase in low threshold potassium conductance (KLT) shown to occur from P14 onward (Scott et al. 2005), which limits spike activity (Manis & Marx, 1991; Brew & Forsythe, 1995; Rothman & Manis, 2003). Some tonic cells may degenerate, but this mechanism likely does not account for the large decrease in their number.
Contribution of action potential properties to TD sensitivity
Our recordings from animals aged P7–13 suggest that TD sensitivity can be affected by the spike generation mechanism. We propose that sodium channels, even at physiological temperature, activate too slowly at these ages to respond to short duration stimuli, resulting in a TD curve with the peak response shifted to non-zero TD values. The ability to respond maximally to short duration stimuli (1–2 ms duration) at 0 μs TD is largely in place by the transitional phase of hearing onset at P13–14. Interestingly, this change parallels increased expression of sodium channel subunit Nav1.6 in the retina and optic nerve that brackets the time of eye opening and when cells become capable of repetitive firing (Van Wart & Matthews, 2006). We showed that spike amplitude began to decrease at about P10 with the initial onset of sensitivity to airborne sound. These acoustic experiences, and other factors such as myelination of trapezoid body axons, may trigger transitions in sodium and potassium channel gene expression in MSO neurons. These processes may be balanced with migration of sodium channels into the initial segment (Scott et al. 2005; Kuba et al. 2006). One possibility is that delayed rectifier expression may reduce action potential amplitude from earlier ages than when Na+ channel migration may affect the speed of action potential depolarization (Fig. 6C and E). The reduction of action potential amplitude by increasing temperature has been known from studies of squid giant axon (Hodgkin & Katz, 1949), and is a feature of neurons in vertebrate animals that must function optimally at higher temperatures (Volgushev et al. 2000). In the auditory system, decreased amplitude with temperature may be more dramatic for cells having low cellular resistance, such as octopus cells of the cochlear nucleus (Cao & Oertel, 2005). The action potential amplitudes we measured were less than reported by Scott et al. (2005) for the ages at which these studies overlap. In part this difference may be due to our measurement of action potential characteristics at threshold, because action potential amplitude can increase with increasing stimulation current. Also, for cells such as MSO neurons that have low cellular resistance values, even changes in temperature of only a few degrees near physiological values can affect action potential parameters (Fig. 6B). Smaller action potential amplitudes at the soma may reflect concentration of sodium channels in the initial segment, which may function to reduce sodium channel inactivation in the presence of high rates of synaptic input (Kuba et al. 2006).
Contribution of cell resistance and EPSC duration to TD sensitivity
We showed a large decrease in Rin, which overlaps values recently reported (Scott et al. 2005 for P14–35; Magnusson et al. 2005 for P12–21), but a much smaller change in Rst that begins from the earliest age we studied and reaches near-mature levels by P16. Decreases in Rin and Rst, then, begin by or before P7 and may follow a genetic programme independent of auditory experience. Rst reflects the summed depolarization-induced activation of cellular conductances characterized, at least in part, by a developmental increase in KLT shown for MSO cells after P14 (Scott et al. 2005). The greater change in Rin compared to Rst could reflect a shift in the voltage activation curve for KLT with age or an increased expression of conductances activated at the resting membrane potential, such as the hyperpolarization-activated mixed conductance Ih.
The relative values of Rin and Rst have functional implications for coincidence detection. In general, at ages older than P12 the resting membrane potential was at or within a few millivolts of the steepest region of the Rsl curve. In contrast, the threshold for spike generation was located along the shallowest region of the Rsl curve. This situation necessitates that depolarization occurs rapidly to open sodium channels prior to activating conductances that decrease the cell resistance with depolarization (Brew & Forsythe, 1995; Ferragamo & Oertel, 2002; Kuba et al. 2003; Rothman & Manis, 2003; Scott et al. 2005). Although in animals older than P16 Rst differed little in absolute value from Rin (< 10 MΩ) and by a lesser percentage than at earlier ages, the percent change relative to Rin could be as high as ∼50%. Thus, this rationale for rapid depolarization prior to activation of membrane conductances is important to limit the coincidence detection window, but perhaps not as important as the baseline effect of low Rin values in shortening the duration of excitatory inputs.
Physiological temperature combined with low Rin can yield EPSPs of equal or even shorter duration than EPSCs (Kuba et al. 2003). By using spike rate as a measure, we showed a hyperbolic relationship between simEPSC duration and slope of the TD curve. Furthermore, we propose that low Rin and high spike threshold also can conspire to sharpen TD sensitivity by requiring larger amplitude EPSCs to activate the cell. The decline in EPSP amplitude (Fig. 1F) and in the slope of EPSP depolarization with increasing TD is steeper for large than for small signals that exhibit the same kinetics and would also contribute to steeper TD curves for high amplitude input. The increased spike threshold recorded at physiological temperature (Fig. 6D), then, factors importantly in measurements of TD sensitivity in vitro.
Dendrite structure
During the first two postnatal weeks, both tonic and phasic neurons are prevalent among the principal cell column of the MSO. Both tonic and phasic physiological types exhibit a roughly bipolar dendritic organization; thin tendrils are characteristic of early ages, but are rare after P12. One function of dendritic tendrils is to present a larger cross-section for capture of growth cones extending through the vicinity of the cell (Fiala et al. 1998), so perhaps all inputs have made contact by P12. The basic dendritic structure is defined more rapidly (P9–12) than physiological properties. Given the strong role of synaptic activity in dendrite growth and stabilization (Deitch & Rubel, 1984; Rajan & Cline, 1998; for review, Cline, 2001), we propose that reorganization of MSO cell dendrites reported here depends upon neural activity evoked by airborne sound, because it overlaps the initial phase of hearing onset. Additional experience-dependent maturation in synaptic connections and refinement of dendritic morphology have been documented after this initial phase of hearing onset until 2–3 months of age (Rogowski & Feng, 1981). Differences between our data, which show a small lateral bias at P13–15, and demonstration of a small medial bias by 18 months of age (Russell & Moore, 1999) may reflect subtle experience-dependent changes in dendritic structure. MSO neurons may adjust to these changes even in adolescence because binaural processing, as demonstrated by modelling studies, can be affected by the locations of synapses on dendrites and filtering of inputs by the contralateral dendrite (Agmon-Snir et al. 1998; Zhou et al. 2005).
Possible roles for inhibition in the developing medial superior olive
We showed a steady rate of maturation for IPSPs from P10 until P16. IPSPs are in transition from depolarizing to hyperpolarizing at ages preceding P10 (Lohrke et al. 2005), suggesting dependence of maturation of IPSP kinetics on neural activity due to self-stimulation or a genetic programme independent of auditory experience. The IPSPs we recorded were faster than those reported by Magnusson et al. (2005), probably due to effects of temperature. Increasingly it is recognized that inhibition plays a key role in maturation of sensory systems by creating more stringent conditions for correlation among excitatory inputs, which can be of long duration early in development (Chang & Merzenich, 2003; Hensch & Stryker, 2004; Chang et al. 2005). In MSO at the younger ages that we studied, IPSPs are longer than EPSPs, but their values converge and should be compared in mature animals at physiological temperature. The activity patterns of IPSPs that originate from the MNTB are likely to be increasingly phasic after hearing onset and may then restrict temporal windows in which correlated excitatory inputs can be reinforced so that unfavourable delays are pruned.
Maturation of synaptic machinery occurs during this time frame such that inhibition can be driven at high frequency (> 150 Hz) also by P15–16. This capability, coupled with the steep slopes of TD curves, renders the system capable of representing sound location utilizing integration of both excitatory and inhibitory inputs. In fact, limited ITD sensitivity has been recorded in vivo at P15 from gerbil lateral lemniscus neurons, which may derive their responses via projections from the MSO (Seidl & Grothe, 2005). This time point also correlates with the ability of gerbils to respond to low intensity sound and the resulting necessity to preserve dynamic range in the neural representation of sound attributes, including sound location. It seems likely that the narrow range of IPSP onset times that yield TD sensitivity in the presence of high amplitude excitation would be reinforced in the neural circuit at P15–16 and could constitute a mechanism to preserve dynamic range. Dynamic range preservation is supported by computational results (Pena et al. 1996) and by rapidly increasing IPSP amplitudes with increased intensity of electrical stimulation of inhibitory cell groups in brain slices (Grothe & Sanes, 1993; Smith, 1995). We showed that a large range of IPSP onset times yield TD curves that are flat in the physiological range, so presumably if neural connections that yield these onset times exist during development in vivo, they should be pruned. Such pruning requires a mechanism for detection of rate changes with movement of a sound source or of the animal's head, and feedback of this information onto the MSO neuron to reinforce appropriate synaptic inputs.
Leading inhibition has been shown to increase excitability of the MSO cell over a small temporal window (postinhibitory facilitation, Dodla et al. 2006) and has been proposed to shift the peak of ITD curves to values outside of the physiological range (Brand et al. 2002). The former phenomenon must be further investigated for its role in TD tuning, since it may increase the response across a large range of TD values similarly and not improve TD sensitivity. We could record peak-shifted responses for IPSP onset times with short lead times over excitation. A more systematic exploration, at finer intervals of IPSP onset time, will be required to assess the temporal range over which peak-shifting can occur. Nonetheless, our results show that this phenomenon does not require ultra-short IPSPs as has been suggested by computer modelling (Brand et al. 2002).
We showed that precision in IPSP onset time at values nearly coincident with excitatory input is required to generate monotonic or peak-shifted TD curves. The cellular mechanisms for synaptic integration in MSO differ from other systems in which coincidence is enforced primarily by release from preceding inhibition (Gauck & Jaeger, 2000) or temporal integration windows are adjusted by depression of inhibitory inputs at high frequency (Gabernet et al. 2005). Furthermore, in MSO, integration operates on a faster time scale than other systems where disynaptic, lagging inhibition shunts excitatory inputs and dynamically adjusts temporal integration windows (Pouille & Scanziani, 2001; Carter & Regehr, 2002). Given the effect of synaptic input placement on latency of postsynaptic potentials in MSO (Zhou et al. 2005), fine tuning of neural delays probably occurs during the refinement period of hearing maturation after P16 as inhibitory inputs onto MSO cells reorganize through this period until P25 (Kapfer et al. 2002). Interactions between EPSPs and IPSPs will be challenging to test in vitro in more mature animals at physiological temperature. Nonetheless, we suggest that studying the effects of timing of inhibition and excitation even at ages P15–16, especially at physiological temperature, can shed light onto temporal processing in the mature MSO.
Anatomical correlates with inhibitory projections to MSO
The differential effects of leading and lagging inhibition may be associated with both cell groups that inhibit the MSO. The MSO is innervated by inhibitory neurons in the MNTB and the LNTB (Cant & Hyson, 1992; Kuwabara & Zook, 1992) and we have described two sets of inhibitory neurons in the LNTB (Spirou & Berrebi, 1997; Spirou et al. 1998). One neuron type forms the posteroventral (pv)LNTB, resembles morphologically cells of the MNTB and probably phase-locks well to acoustic stimuli. Leading and lagging inhibition could originate from both the MNTB and pvLNTB, since IPSPs that lag on one stimulus cycle lead excitation on the next cycle. The other neuron type forms the main (m)LNTB, lacks somatic innervation and may not phase-lock well. These inputs may function in similar fashion to KLT channels by providing tonic inhibition that raises the threshold for activation, as has been proposed for superior olivary nucleus inhibition of nucleus laminaris in birds (Yang et al. 1999; Burger et al. 2005). Such actions of inhibition can render neurons that are not specialized for coincidence detection, pyramidal neurons of cerebral cortex, sensitive to phase-delayed excitatory inputs (Grande et al. 2004). This effect of inhibition places an extra demand (in addition to low Rin) for fast, high amplitude excitatory synaptic currents to generate action potentials. Note that inhibitory inputs to MSO that function in this manner would have to be of long duration, because even high rate, non-periodic spontaneous IPSPs (which are of shorter duration than evoked IPSPs; data not shown) do not increase the slope of TD curves (Fig. 5F).
In summary, an important developmental period for MSO neurons ends at P16 with several characteristics maturing within a more circumscribed time frame of P10–16. This latter time period covers the first two phases of hearing onset and extends into the early refinement phase when hearing thresholds become low. By P15, physiological capabilities that support ITD processing are in place, and the relative timing of excitation and inhibition is critical to generating sensitivity by MSO cells to temporally delayed inputs within a physiologically meaningful range of values. This timing is likely to be refined over subsequent weeks during the final stages of auditory system maturation.
Acknowledgments
This work was supported by an NIH/NIDCD (DC005035) grant to G.A.S., and a NIH/NCRR COBRE grant (P20 RR15574) to the Sensory Neuroscience Research Center. We acknowledge Eric Young for advice on spike train analysis, SNRC colleagues, Henrique von Gersdorff and Paul Manis for critical discussions.
References
- Agmon-Snir H, Carr CE, Rinzel J. The role of dendrites in auditory coincidence detection. Nature. 1998;393:268–272. doi: 10.1038/30505. [DOI] [PubMed] [Google Scholar]
- Altman J, Anderson WJ. Experimental reorganization of the cerebellar cortex. I. Morphological effects of elimination of all microneurons with prolonged x-irradiation started at birth. J Comp Neurol. 1972;146:355–406. doi: 10.1002/cne.901460305. [DOI] [PubMed] [Google Scholar]
- Banks MI, Smith PH. Intracellular recordings from neurobiotin-labeled cells in brain slices of the rat medial nucleus of the trapezoid body. J Neurosci. 1992;12:2819–2837. doi: 10.1523/JNEUROSCI.12-07-02819.1992. [DOI] [PMC free article] [PubMed] [Google Scholar]
- Barry PH. JPCalc, a software package for calculating liquid junction potential corrections in patch-clamp, intracellular, epithelial and bilayer measurements and for correcting junction potential measurements. J Neurosci Meth. 1994;51:107–116. doi: 10.1016/0165-0270(94)90031-0. [DOI] [PubMed] [Google Scholar]
- Beutner D, Moser T. The presynaptic function of mouse cochlear inner hair cells during development of hearing. J Neurosci. 2001;21:4593–4599. doi: 10.1523/JNEUROSCI.21-13-04593.2001. [DOI] [PMC free article] [PubMed] [Google Scholar]
- Brand A, Behrend O, Marquardt T, McAlpine D, Grothe B. Precise inhibition is essential for microsecond interaural time difference coding. Nature. 2002;417:543–547. doi: 10.1038/417543a. [DOI] [PubMed] [Google Scholar]
- Brew HM, Forsythe ID. Two voltage-dependent K+ conductances with complementary functions in postsynaptic integration at a central auditory synapse. J Neurosci. 1995;15:8011–8022. doi: 10.1523/JNEUROSCI.15-12-08011.1995. [DOI] [PMC free article] [PubMed] [Google Scholar]
- Burger RM, Cramer KS, Pfeiffer JD, Rubel EW. Avian superior olivary nucleus provides divergent inhibitory input to parallel auditory pathways. J Comp Neurol. 2005;481:6–18. doi: 10.1002/cne.20334. [DOI] [PubMed] [Google Scholar]
- Cant NB, Hyson RL. Projections from the lateral nucleus of the trapezoid body to the medial superior olivary nucleus in the gerbil. Hear Res. 1992;58:26–34. doi: 10.1016/0378-5955(92)90005-8. [DOI] [PubMed] [Google Scholar]
- Cao XJ, Oertel D. Temperature affects voltage-sensitive conductances differentially in octopus cells of the mammalian cochlear nucleus. J Neurophys. 2005;94:821–832. doi: 10.1152/jn.01049.2004. [DOI] [PubMed] [Google Scholar]
- Carr CE, Konishi M. A circuit for detection of interaural time differences in the brain stem of the barn owl. J Neurosci. 1990;10:3227–3246. doi: 10.1523/JNEUROSCI.10-10-03227.1990. [DOI] [PMC free article] [PubMed] [Google Scholar]
- Carter AG, Regehr WG. Quantal events shape cerebellar interneuron firing. Nature Neurosci. 2002;5:1309–1318. doi: 10.1038/nn970. [DOI] [PubMed] [Google Scholar]
- Chae K-S, Oh K-S, Dryer SE. Growth factors mobilize multiple pools of KCa channels in developing parasympathetic neurons: role of ADP-ribosylation factors and related proteins. J Neurophysiol. 2005;94:1597–1605. doi: 10.1152/jn.00296.2005. [DOI] [PubMed] [Google Scholar]
- Chang EF, Bao S, Imaizumi K, Schreiner CE, Merzenich MM. Development of spectral and temporal response selectivity in the auditory cortex. Proc Natl Acad Sci U S A. 2005;102:16460–16465. doi: 10.1073/pnas.0508239102. [DOI] [PMC free article] [PubMed] [Google Scholar]
- Chang EF, Merzenich MM. Environmental noise retards auditory cortical development. Science. 2003;300:498–502. doi: 10.1126/science.1082163. [DOI] [PubMed] [Google Scholar]
- Chuhma N, Ohmori H. Postnatal development of phase-locked high-fidelity synaptic transmission in the medial nucleus of the trapezoid body of the rat. J Neurosci. 1998;18:512–520. doi: 10.1523/JNEUROSCI.18-01-00512.1998. [DOI] [PMC free article] [PubMed] [Google Scholar]
- Cline HT. Dendritic arbor development and synaptogenesis. Curr Opin Neurobiol. 2001;11:118–126. doi: 10.1016/s0959-4388(00)00182-3. [DOI] [PubMed] [Google Scholar]
- Cook DL, Schwindt PC, Grande LA, Spain WJ. Synaptic depression in the localization of sound. Nature. 2003;421:66–70. doi: 10.1038/nature01248. [DOI] [PubMed] [Google Scholar]
- Corlew R, Bosma MM, Moody WJ. Spontaneous, synchronous electrical activity in neonatal mouse cortical neurons. J Physiol. 2004;560:377–390. doi: 10.1113/jphysiol.2004.071621. [DOI] [PMC free article] [PubMed] [Google Scholar]
- Deitch JS, Rubel EW. Afferent influences on brain stem auditory nuclei of the chicken: time course and specificity of dendritic atrophy. J Comp Neurol. 1984;229:66–79. doi: 10.1002/cne.902290106. [DOI] [PubMed] [Google Scholar]
- Dodla R, Svirskis G, Rinzel J. Well-timed, brief inhibition can promote spiking: postinhibitory facilitation. J Neurophysiol. 2006;95:2664–2677. doi: 10.1152/jn.00752.2005. [DOI] [PMC free article] [PubMed] [Google Scholar]
- Ehret G. Infant rodent ultrasounds – a gate to the understanding of sound communication. Behav Genet. 2005;35:19–29. doi: 10.1007/s10519-004-0853-8. [DOI] [PubMed] [Google Scholar]
- Fernandez E, Eldred WD, Ammermuller J, Block A, von Bloh W, Kolb H. Complexity and scaling properties of amacrine, ganglion, horizontal, and bipolar cells in the turtle retina. J Comp Neurol. 1994;347:397–408. doi: 10.1002/cne.903470306. [DOI] [PubMed] [Google Scholar]
- Ferragamo MJ, Oertel D. Octopus cells of the mammalian ventral cochlear nucleus sense the rate of depolarization. J Neurophysiol. 2002;87:2262–2270. doi: 10.1152/jn.00587.2001. [DOI] [PubMed] [Google Scholar]
- Fiala JC, Feinberg M, Popov V, Harris KM. Synaptogenesis via dendritic filopodia in developing hippocampal area CA1. J Neurosci. 1998;18:8900–8911. doi: 10.1523/JNEUROSCI.18-21-08900.1998. [DOI] [PMC free article] [PubMed] [Google Scholar]
- Fitzpatrick DC, Kuwada S. Tuning to interaural time differences across frequency. J Neurosci. 2001;21:4844–4861. doi: 10.1523/JNEUROSCI.21-13-04844.2001. [DOI] [PMC free article] [PubMed] [Google Scholar]
- Foran DR, Peterson AC. Myelin acquisition in the central nervous system of the mouse revealed by an MBP-LacZ transgene. J Neurosci. 1992;12:4890–4897. doi: 10.1523/JNEUROSCI.12-12-04890.1992. [DOI] [PMC free article] [PubMed] [Google Scholar]
- Funabiki K, Koyano K, Ohmori H. The role of GABAergic inputs for coincidence detection in the neurons of nucleus laminaris of the chick. J Physiol. 1998;508:851–869. doi: 10.1111/j.1469-7793.1998.851bp.x. [DOI] [PMC free article] [PubMed] [Google Scholar]
- Gabernet L, Jadhav SP, Feldman DE, Carandini M, Scanziani M. Somatosensory integration controlled by dynamic thalamocortical feed-forward inhibition. Neuron. 2005;48:315–327. doi: 10.1016/j.neuron.2005.09.022. [DOI] [PubMed] [Google Scholar]
- Gauck V, Jaeger D. The control of rate and timing of spikes in the deep cerebellar nuclei by inhibition. J Neurosci. 2000;20:3006–3016. doi: 10.1523/JNEUROSCI.20-08-03006.2000. [DOI] [PMC free article] [PubMed] [Google Scholar]
- Goldberg JM, Brown PB. Response of binaural neurons of dog superior olivary complex to dichotic tonal stimuli: some physiological mechanisms of sound localization. J Neurophysiol. 1969;32:613–636. doi: 10.1152/jn.1969.32.4.613. [DOI] [PubMed] [Google Scholar]
- Grande LA, Kinney GA, Miracle GL, Spain WJ. Dynamic influences on coincidence detection in neocortical pyramidal neurons. J Neurosci. 2004;24:1839–1851. doi: 10.1523/JNEUROSCI.3500-03.2004. [DOI] [PMC free article] [PubMed] [Google Scholar]
- Grothe B, Sanes DH. Bilateral inhibition by glycinergic afferents in the medial superior olive. J Neurophysiol. 1993;69:1192–1196. doi: 10.1152/jn.1993.69.4.1192. [DOI] [PubMed] [Google Scholar]
- Heffner RS, Heffner HE. Sound localization and use of binaural cues by the gerbil (Meriones unguiculatus) Behav Neurosci. 1988;102:422–428. doi: 10.1037//0735-7044.102.3.422. [DOI] [PubMed] [Google Scholar]
- Hensch TK, Stryker MP. Columnar architecture sculpted by GABA circuits in developing cat visual cortex. Science. 2004;303:1678–1681. doi: 10.1126/science.1091031. [DOI] [PMC free article] [PubMed] [Google Scholar]
- Hodgkin AL, Katz B. The effect of temperature on the electrical activitiy of the giant axon of the squid. J Physiol. 1949;109:240–249. doi: 10.1113/jphysiol.1949.sp004388. [DOI] [PMC free article] [PubMed] [Google Scholar]
- Hoffpauir BK, Grimes JL, Mathers PH, Spirou GA. Synaptogenesis at the calyx of Held: rapid onset of function and one-to-one morphological innervation. J Neurosci. 2006;17:5511–5523. doi: 10.1523/JNEUROSCI.5525-05.2006. [DOI] [PMC free article] [PubMed] [Google Scholar]
- Joshi I, Wang L-Y. Developmental profiles of glutamate receptors and synaptic transmission at a single synapse in the mouse auditory brainstem. J Physiol. 2002;540:861–873. doi: 10.1113/jphysiol.2001.013506. [DOI] [PMC free article] [PubMed] [Google Scholar]
- Kandler K, Friauf E. Pre- and postnatal development of efferent connections of the cochlear nucleus in the rat. J Comp Neurol. 1993;328:161–184. doi: 10.1002/cne.903280202. [DOI] [PubMed] [Google Scholar]
- Kandler K, Friauf E. Development of electrical membrane properties and discharge characteristics of superior olivary complex neurons in fetal and postnatal rats. Eur J Neurosci. 1995;7:1773–1790. doi: 10.1111/j.1460-9568.1995.tb00697.x. [DOI] [PubMed] [Google Scholar]
- Kapfer C, Seidl AH, Schweizer H, Grothe B. Experience-dependent refinement of inhibitory inputs to auditory coincidence-detector neurons. Nature Neurosci. 2002;5:247–253. doi: 10.1038/nn810. [DOI] [PubMed] [Google Scholar]
- Kopp-Scheinpflug C, Lippe WR, Dorrscheidt GJ, Rubsamen R. The medial nucleus of the trapezoid body in the gerbil is more than a relay; comparison of pre- and postsynaptic activity. JARO. 2003;4:1–23. doi: 10.1007/s10162-002-2010-5. [DOI] [PMC free article] [PubMed] [Google Scholar]
- Kuba H, Ishii TM, Ohmori H. Axonal site of spike initiation enhances auditory coincidence detection. Nature. 2006;444:1069–1072. doi: 10.1038/nature05347. [DOI] [PubMed] [Google Scholar]
- Kuba H, Koyano K, Ohmori H. Synaptic depression improves coincidence detection in the nucleus laminaris in brainstem slices of the chick embryo. Eur J Neurosci. 2002;15:984–990. doi: 10.1046/j.1460-9568.2002.01933.x. [DOI] [PubMed] [Google Scholar]
- Kuba H, Yamada R, Fukui I, Ohmori H. Tonotopic specialization of auditory coincidence detection in nucleus laminaris of the chick. J Neurosci. 2005;25:1924–1934. doi: 10.1523/JNEUROSCI.4428-04.2005. [DOI] [PMC free article] [PubMed] [Google Scholar]
- Kuba H, Yamada R, Ohmori H. Evaluation of the limiting acuity of coincidence detection in nucleus laminaris of the chicken. J Physiol. 2003;552:611–620. doi: 10.1113/jphysiol.2003.041574. [DOI] [PMC free article] [PubMed] [Google Scholar]
- Kushmerick C, Renden R, von Gersdorff H. Physiological temperatures reduce the rate of vesicle pool depletion and short-term depression via an acceleration of vesicle recruitment. J Neurosci. 2006;26:1366–1377. doi: 10.1523/JNEUROSCI.3889-05.2006. [DOI] [PMC free article] [PubMed] [Google Scholar]
- Kuwabara N, Zook JM. Projections to the medial superior olive from the medial and lateral nuclei of the trapezoid body in rodents and bats. J Comp Neurol. 1992;324:522–538. doi: 10.1002/cne.903240406. [DOI] [PubMed] [Google Scholar]
- Liu SQ, Kaczmarek LK. Depolarization selectively increases the expression of the Kv3.1 potassium channel in developing inferior colliculus. J Neurosci. 1998;18:8758–8769. doi: 10.1523/JNEUROSCI.18-21-08758.1998. [DOI] [PMC free article] [PubMed] [Google Scholar]
- Lohrke S, Srinivasan G, Oberhofer M, Doncheva E, Friauf E. Shift from depolarizing to hyperpolarizing glycine action occurs at different perinatal ages in superior olivary complex nuclei. Eur J Neurosci. 2005;22:2708–2722. doi: 10.1111/j.1460-9568.2005.04465.x. [DOI] [PubMed] [Google Scholar]
- McAlpine D, Jiang D, Palmer AR. A neural code for low-frequency sound localization in mammals. Nat Neurosci. 2001;4:396–401. doi: 10.1038/86049. [DOI] [PubMed] [Google Scholar]
- McCabe AK, Chisholm SL, Picken-Bahrey HL, Moody WJ. The self-regulating nature of spontaneous synchronized activity in developing mouse cortical neurons. J Physiol. 2006;577:155–167. doi: 10.1113/jphysiol.2006.117523. [DOI] [PMC free article] [PubMed] [Google Scholar]
- McFadden SL, Walsh EJ, McGee J. Onset and development of auditory brainstem responses in the Mongolian gerbil. Hear Res. 1996;100:68–79. doi: 10.1016/0378-5955(96)00108-6. [DOI] [PubMed] [Google Scholar]
- McKay BE, Turner RW. Physiological and morphological development of the rat cerebellar Purkinje cell. J Physiol. 2005;567:829–850. doi: 10.1113/jphysiol.2005.089383. [DOI] [PMC free article] [PubMed] [Google Scholar]
- Macmillan NA, Creelman CD. Detection Theory: A User's Guide. New York: Cambridge University Press; 1991. [Google Scholar]
- Magnusson AK, Kapfer C, Grothe B, Koch U. Maturation of glycinergic inhibition in the gerbil medial superior olive after hearing onset. J Physiol. 2005;568:497–512. doi: 10.1113/jphysiol.2005.094763. [DOI] [PMC free article] [PubMed] [Google Scholar]
- Manis PB, Marx SO. Outward currents in isolated ventral cochlear nucleus neurons. J Neurosci. 1991;11:2865–2880. doi: 10.1523/JNEUROSCI.11-09-02865.1991. [DOI] [PMC free article] [PubMed] [Google Scholar]
- Massengill JL, Smith MA, Son DI, O'Dowd DK. Differential expression of K4-AP currents and Kv3.1 potassium channel transcripts in cortical neurons that develop distinct firing phenotypes. J Neurosci. 1997;17:3136–3147. doi: 10.1523/JNEUROSCI.17-09-03136.1997. [DOI] [PMC free article] [PubMed] [Google Scholar]
- Moody WJ, Bosma MM. Ion channel development, spontaneous activity, and activity-dependent development in nerve and muscle cells. Phys Rev. 2005;85:883–941. doi: 10.1152/physrev.00017.2004. [DOI] [PubMed] [Google Scholar]
- Muller M. Quantitative comparison of frequency representation in the auditory brainstem nuclei of the gerbil, Pachyuromys duprasi. Exp Brain Res. 1990;81:140–149. doi: 10.1007/BF00230110. [DOI] [PubMed] [Google Scholar]
- Pena JL, Viete S, Albeck Y, Konishi M. Tolerance to sound intensity of binaural coincidence detection in the nucleus laminaris of the owl. J Neurosci. 1996;16:7046–7054. doi: 10.1523/JNEUROSCI.16-21-07046.1996. [DOI] [PMC free article] [PubMed] [Google Scholar]
- Picken Bahrey HL, Moody WJ. Early development of voltage-gated ion currents and firing properties in neurons of the mouse cerebral cortex. J Neurophysiol. 2003;89:1761–1773. doi: 10.1152/jn.00972.2002. [DOI] [PubMed] [Google Scholar]
- Porter R, Ghosh S, Lange GD, Smith TG. A fractal analysis of pyramidal neurons in mammalian motor cortex. Neurosci Lett. 1991;130:112–116. doi: 10.1016/0304-3940(91)90240-t. [DOI] [PubMed] [Google Scholar]
- Pouille F, Scanziani M. Enforcement of temporal fidelity in pyramidal cells by somatic feed-forward inhibition. Science. 2001;293:1159–1163. doi: 10.1126/science.1060342. [DOI] [PubMed] [Google Scholar]
- Rajan I, Cline HT. Glutamate receptor activity is required for normal development of tectal cell dendrites in vivo. J Neurosci. 1998;18:7836–7846. doi: 10.1523/JNEUROSCI.18-19-07836.1998. [DOI] [PMC free article] [PubMed] [Google Scholar]
- Ramón y Cajal S. Histology of the Nervous System of Man and Vertebrates. New York: Oxford University Press; 1909. [Google Scholar]
- Reyes AD, Rubel EW, Spain WJ. In vitro analysis of optimal stimuli for phase-locking and time-delayed modulation of firing in avian nucleus laminaris neurons. J Neurosci. 1996;16:993–1007. doi: 10.1523/JNEUROSCI.16-03-00993.1996. [DOI] [PMC free article] [PubMed] [Google Scholar]
- Rogowski BA, Feng AS. Normal postnatal development of medial superior olivary neurons in the albino rat: a Golgi and Nissl study. J Comp Neurol. 1981;196:85–97. doi: 10.1002/cne.901960108. [DOI] [PubMed] [Google Scholar]
- Rothman JS, Manis PB. The roles potassium currents play in regulating the electrical activity of ventral cochlear nucleus neurons. J Neurophysiol. 2003;89:3097–3113. doi: 10.1152/jn.00127.2002. [DOI] [PubMed] [Google Scholar]
- Russell FA, Moore DR. Effects of unilateral cochlear removal on dendrites in the gerbil medial superior olivary nucleus. Eur J Neurosci. 1999;11:1379–1390. doi: 10.1046/j.1460-9568.1999.00547.x. [DOI] [PubMed] [Google Scholar]
- Sanes DH, Friauf E. Development and influence of inhibition in the lateral superior olivary nucleus. Hear Res. 2000;147:46–58. doi: 10.1016/s0378-5955(00)00119-2. [DOI] [PubMed] [Google Scholar]
- Sanes DH, Rubel EW. The ontogeny of inhibition and excitation in the gerbil lateral superior olive. J Neurosci. 1988;8:682–700. doi: 10.1523/JNEUROSCI.08-02-00682.1988. [DOI] [PMC free article] [PubMed] [Google Scholar]
- Schneggenburger R, Forsythe ID. The calyx of Held. Cell Tissue Res. 2006;326:311–337. doi: 10.1007/s00441-006-0272-7. [DOI] [PubMed] [Google Scholar]
- Scott LL, Mathews PJ, Golding NL. Posthearing developmental refinement of temporal processing in principal neurons of the medial superior olive. J Neurosci. 2005;25:7887–7895. doi: 10.1523/JNEUROSCI.1016-05.2005. [DOI] [PMC free article] [PubMed] [Google Scholar]
- Seidl AH, Grothe B. Development of sound localizastion mechanisms in the Mongolian gerbil is shaped by early acoustic experience. J Neurophysiol. 2005;94:1028–1036. doi: 10.1152/jn.01143.2004. [DOI] [PubMed] [Google Scholar]
- Smith PH. Structural and functional differences distinguish principal from nonprincipal cells in the guinea pig MSO slice. J Neurophysiol. 1995;73:1653–1667. doi: 10.1152/jn.1995.73.4.1653. [DOI] [PubMed] [Google Scholar]
- Smith TG, Brauer K, Reichenbach A. Quantitative phylogenetic constancy of cerebellar Purkinje cell morphological complexity. J Comp Neurol. 1993;331:402–406. doi: 10.1002/cne.903310309. [DOI] [PubMed] [Google Scholar]
- Smith PH, Joris PX, Carney LH, Yin TCT. Projections of physiologically characterized globular bushy cell axons from the cochlear nucleus of the cat. J Comp Neurol. 1991;304:387–407. doi: 10.1002/cne.903040305. [DOI] [PubMed] [Google Scholar]
- Smith AJ, Owens S, Forsythe ID. Characterization of inhibitory and excitatory postsynaptic currents of the rat medial superior olive. J Physiol. 2000;529:681–698. doi: 10.1111/j.1469-7793.2000.00681.x. [DOI] [PMC free article] [PubMed] [Google Scholar]
- Sorensen SA, Rubel EW. The level and integrity of synaptic input regulates dendrite structure. J Neurosci. 2006;26:1539–1550. doi: 10.1523/JNEUROSCI.3807-05.2006. [DOI] [PMC free article] [PubMed] [Google Scholar]
- Spirou GA, Berrebi AS. Glycine immunoreactivity in the lateral nucleus of the trapezoid body of the cat. J Comp Neurol. 1997;383:473–488. doi: 10.1002/(sici)1096-9861(19970714)383:4<473::aid-cne6>3.0.co;2-#. [DOI] [PubMed] [Google Scholar]
- Spirou GA, Brownell WE, Zidanic M. Recordings from cat trapezoid body and HRP labeling of globular cell axons. J Neurophysiol. 1990;63:1169–1190. doi: 10.1152/jn.1990.63.5.1169. [DOI] [PubMed] [Google Scholar]
- Spirou GA, Rowland KC, Berrebi AS. Ultrastructure of neurons and large synaptic terminals in the lateral nucleus of the trapezoid body of the cat. J Comp Neurol. 1998;398:257–272. doi: 10.1002/(sici)1096-9861(19980824)398:2<257::aid-cne7>3.0.co;2-#. [DOI] [PubMed] [Google Scholar]
- Spitzer MP, Semple MN. Neurons sensitive to interaural phase disparity in gerbil superior olive: diverse monaural and temporal response properties. J Neurophysiol. 1995;73:1668–1690. doi: 10.1152/jn.1995.73.4.1668. [DOI] [PubMed] [Google Scholar]
- Stotler WA. An experimental study of the cells and connections of the superior olivary complex of the cat. J Comp Neurol. 1953;98:401–432. doi: 10.1002/cne.900980303. [DOI] [PubMed] [Google Scholar]
- Svirskis G, Kotak V, Sanes DH, Rinzel J. Enhancement of signal-to-noise ratio and phase locking for small inputs by a low-threshold outward current. J Neurosci. 2002;22:11019–11025. doi: 10.1523/JNEUROSCI.22-24-11019.2002. [DOI] [PMC free article] [PubMed] [Google Scholar]
- Svirskis G, Kotak V, Sanes DH, Rinzel J. Sodium along with low-threshold potassium currents enhance coincidence detection of subthreshold noisy signals in MSO neurons. J Neurophysiol. 2004;91:2465–2473. doi: 10.1152/jn.00717.2003. [DOI] [PMC free article] [PubMed] [Google Scholar]
- Taschenberger H, von Gersdorff H. Fine-tuning an auditory synapse for speed and fidelity: developmental changes in presynaptic waveform, EPSC kinetics and synaptic plasticity. J Neurosci. 2000;20:9182–9173. doi: 10.1523/JNEUROSCI.20-24-09162.2000. [DOI] [PMC free article] [PubMed] [Google Scholar]
- Van Aelst L, Cline HT. Rho GTPases and activity-dependent dendritic development. Curr Opin Neurobiol. 2004;14:297–304. doi: 10.1016/j.conb.2004.05.012. [DOI] [PubMed] [Google Scholar]
- Van Wart A, Matthews G. Expression of sodium channels Nav1.2 and Nav1.6 during postnatal development of the retina. Neurosci Lett. 2006;403:315–317. doi: 10.1016/j.neulet.2006.05.019. [DOI] [PMC free article] [PubMed] [Google Scholar]
- Volgushev M, Vidyasagar TR, Chistiakova M, Yousef T, Eysel UT. Membrane properties and spike generation in rat visual cortical cells during reversible cooling. J Physiol. 2000;522:59–76. doi: 10.1111/j.1469-7793.2000.0059m.x. [DOI] [PMC free article] [PubMed] [Google Scholar]
- Wightman FL, Kistler DJ. The dominant role of low-frequency interaural time differences in sound localization. J Acoust Soc Am. 1992;91:1648–1661. doi: 10.1121/1.402445. [DOI] [PubMed] [Google Scholar]
- Woolf NK, Ryan AF. The development of auditory function in the cochlear of the Mongolian gerbil. Hear Res. 1984;13:277–283. doi: 10.1016/0378-5955(84)90081-9. [DOI] [PubMed] [Google Scholar]
- Yang L, Monsivals P, Rubel EW. The superior olivary nucleus and its influence on nucleus laminaris: a source of inhibitory feedback for coincidence detection in the avian auditory brainstem. J Neurosci. 1999;19:2313–2325. doi: 10.1523/JNEUROSCI.19-06-02313.1999. [DOI] [PMC free article] [PubMed] [Google Scholar]
- Yin TCT, Chan JCK. Interaural time sensitivity in medial superior olive of cat. J Neurophysiol. 1990;72:705–718. doi: 10.1152/jn.1990.64.2.465. [DOI] [PubMed] [Google Scholar]
- Zhou Y, Carney LH, Colburn HS. A model for interaural time difference sensitivity in the medial superior olive: interaction of excitatory and inhibitory synaptic inputs, channel dynamics, and cellular morphology. J Neurosci. 2005;25:3046–3058. doi: 10.1523/JNEUROSCI.3064-04.2005. [DOI] [PMC free article] [PubMed] [Google Scholar]