Abstract
After defining the current approach to measuring the hypoxic ventilatory response this paper explains why this method is not appropriate for comparisons between individuals or conditions, and does not adequately measure the parameters of the peripheral chemoreflex. A measurement regime is therefore proposed that incorporates three procedures. The first procedure measures the peripheral chemoreflex responsiveness to both hypoxia and CO2 in terms of hypoxia's effects on the sensitivity and ventilatory recruitment threshold of the peripheral chemoreflex response to CO2. The second and third procedures employ current methods for measuring the isocapnic and poikilocapnic ventilatory responses to hypoxia, respectively, over a period of 20 min. The isocapnic measure is used to determine the time course characteristics of hypoxic ventilatory decline and the poikilocapnic measure shows the ventilatory response to a hypoxic environment. A measurement regime incorporating these three procedures will permit a detailed assessment of the peripheral chemoreflex response to hypoxia that allows comparisons to be made between individuals and different physiological and environmental conditions.
While several methods have been developed to measure the ventilatory response to hypoxia, a standard method capable of comparing test results between subjects and within the same subject under different conditions remains elusive. Indeed at the recent 15th international hypoxia symposium held at Lake Louise a consensus could not be reached. Nevertheless, such a consensus is highly desirable because it will permit comparisons that will further our understanding of how the ventilatory response to hypoxia changes between and within individuals under different physiological (e.g. changes in cerebral blood flow and central chemoreflex sensitivity) and environmental (e.g. following acclimatization to hypoxia) circumstances, as well as with drug-induced changes. The aim of this article is therefore to describe the current problems associated with measuring the hypoxic ventilatory response (HVR) and propose a method that overcomes them.
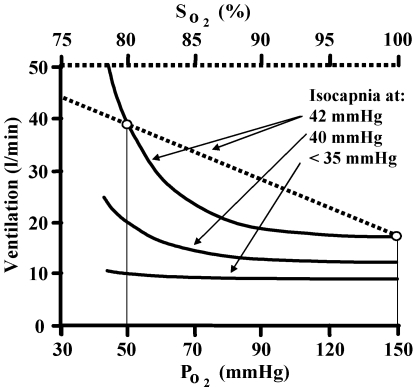
The ventilatory response to hypoxia is mediated by the peripheral chemoreflex, a reflex arc from the carotid body sensor to the respiratory muscle effectors (Torrance, 1996). In the range of hypoxia limited by ethical constraints, hypoxia does not affect ventilation through other means such as central depression or excitation (Honda, 1992; Fatemian et al. 2003), and is mediated by the peripheral chemoreflex alone (Cunningham, 1987). The HVR can be measured with CO2 tensions allowed to change (poikilocapnic) or fixed (isocapnic). Figure 1 illustrates the ventilatory response to hypoxia at several isocapnic tensions.
Figure 1. The isocapnic ventilatory response to hypoxia.
Ventilation increases rectangular hyperbolically with decreasing PO2 or linearly with decreasing oxygen saturation at any constant PCO2. At an isocapnic PCO2 below the ventilatory recruitment threshold the response is absent, but as PCO2 exceeds the ventilatory recruitment threshold the response increases.
The HVR is time dependent (Easton et al. 1986; Powell, 2007) and the isocapnic HVR can be arbitrarily divided into two phases, a first phase (0–5 min) of immediate ventilation increase, followed by a second phase (5–20 min) of slow decline (Steinback & Poulin, 2007). The second phase is referred to as hypoxic ventilatory decline (HVD) (Liang et al. 1997). Moreover, HVR may be dependent on the pattern of previous hypoxic exposures and sustained CO2 tensions (Mateika et al. 2004; Harris et al. 2006).
The peripheral chemoreflex response to hypoxia consists of an increase in the peripheral chemoreflex sensitivity to CO2 via changes in [H+] at the carotid body (Cunningham, 1987; Torrance, 1996; Kumar & Bin-Jaliah, 2007). The ventilatory recruitment threshold of this CO2 response depends on the level of carotid body activity. In sea level subjects the increase in CO2 sensitivity dominates the response to hypoxia, with little increase in carotid body activity (Mohan & Duffin, 1997), but in adapted altitude residents the increase in CO2 sensitivity with hypoxia may be lost (Leon-Velarde et al. 2003) (also see Fig. 10). In this case, the response to hypoxia may be a decrease in the ventilatory recruitment threshold due to an increase in carotid body activity.
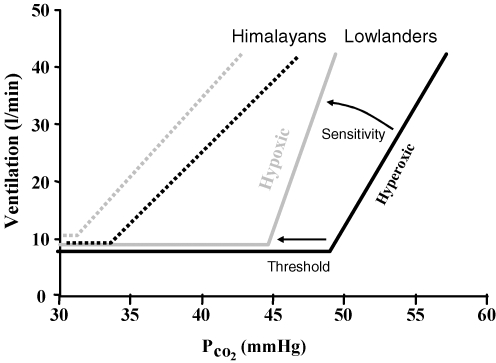
Figure 10. Mean modified rebreathing tests results (Slessarev et al. 2007).
A comparison of isoxic hyperoxic (150 mmHg PO2) ventilatory responses to CO2 (black lines) with isoxic hypoxic (50 mmHg PO2) ventilatory responses to CO2 (grey lines) shows that in lowlanders (continuous lines) an increase in the slope (sensitivity) of the response dominates and most of the change in ventilatory recruitment threshold can be attributed to this change in slope. By contrast, in long-time Himalayan residents (dashed lines) the increase in sensitivity is not significant and a decrease in ventilatory recruitment threshold dominates indicating an increase in the carotid body activity.
In most individuals, hyperoxia (PO2= 150 mmHg) effectively silences the peripheral chemoreflex response to CO2 (Lloyd & Cunningham, 1963; Mohan & Duffin, 1997). It is suggested that hyperoxia be limited to this value during testing to avoid its stimulatory effects (Becker et al. 1996). The time dependency of the ventilatory response to hypoxia is dominated by changes in the ventilatory recruitment threshold of the CO2 response, reflecting changes in carotid body activity, rather than changes in the sensitivity of the CO2 response (Duffin & Mahamed, 2003).
Ventilation depends on both the peripheral chemoreflex drive to breathe and the central chemoreflex drive to breathe (Cunningham et al. 1986). When hypoxia stimulates the peripheral chemoreflex its effect is assumed to be additive with the central chemoreflex drive already present (Clement et al. 1992; Clement et al. 1995; St. Croix et al. 1996). Determining the peripheral contribution therefore requires subtraction of the central contribution from the measured ventilation. The central chemoreflex stimulus is the medullary [H+], determined by central PCO2, with the latter dependent on both arterial PCO2 and cerebral blood flow. Since cerebral blood flow is affected by both CO2 and hypoxia (Poulin et al. 1996; Vovk et al. 2002; Meadows et al. 2004), the central chemoreflex stimulus is not easily determined from end-tidal PCO2 measurements.
These factors require consideration when devising tests of the ventilatory response to hypoxia. I suggest that current methods of measuring the HVR are inadequate since they do not allow either comparisons between different conditions within the same individual or comparisons between different individuals that are (1) free of possible artefactually induced differences and (2) employ a standardized method of choosing isocapnia. The following sections detail why current methods fail and then suggest a measurement regime that overcomes these difficulties and fully characterizes the ventilatory response to hypoxia.
Measuring HVR
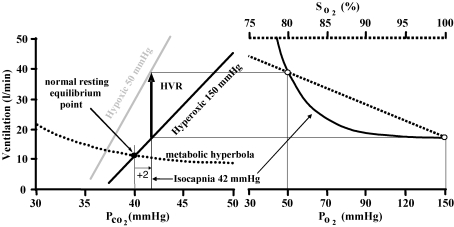
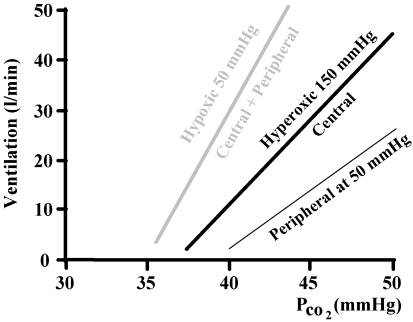
The current acute HVR test consists of establishing an isocapnic PCO2 and then producing a known degree of hypoxia and measuring the resulting change in ventilation before HVD intervenes. The isocapnic PCO2 is usually chosen to be 1–2 mmHg above resting (e.g. Bascom et al. 1990). The resulting change in ventilation may be divided by the change in PO2 or SO2 to obtain a measure of hypoxic sensitivity (Fig. 1). The function of this test can be demonstrated using a graphical model of the control of breathing which illustrates the relation between the ventilatory responses to hypoxia and carbon dioxide (Fig. 2). The model features a metabolic hyperbola, describing the dependence of PCO2 on ventilation, and a linear ventilatory response to PCO2. The latter is the sum of linear ventilatory responses to PCO2 mediated by the central and peripheral chemoreflexes (Fig. 3). The peripheral response slope or CO2 sensitivity depends on PO2 such that at high PO2 (i.e. at or above 150 mmHg) the sensitivity is neglible, and at low PO2 it becomes significant, varying rectangular hyperbolically with PO2. The inter-section of the metabolic hyperbola and the CO2 response indicates the equilibrium point defining resting ventilation and PCO2.
Figure 2. The relationship between hypoxic and hypercapnic ventilatory responses and the current definition of HVR.
At a chosen isocapnic PCO2 (here set to 2 mmHg above resting) the ventilation increase (arrow) from the hyperoxic CO2 response line (assumed to reflect the central chemoreflex response) to any hypoxic CO2 response line (assumed to reflect the sum of central and peripheral chemoreflex responses) is the HVR. Note that the magnitude of the HVR depends on the choice of isocapnic PCO2, and that at a given isocapnic tension the mechanisms (change in slope or threshold) responsible for the HVR are indistinguishable from one another.
Figure 3. The additive effect of central and peripheral responses to hypercapnia.
The hyperoxic line is the addition of a neglible peripheral response and the central response and so reflects the central chemoreflex response alone. The hypoxic line is again the addition of central and peripheral responses, this time with a substantial peripheral contribution.
Using this model, Fig. 2 shows the current definition of HVR, and illustrates both its dependence on the choice of isocapnic PCO2 and the central ventilation response to PCO2. It also illustrates that changes in HVR may be due to alterations in either the slopes or the thresholds of these responses. Therefore, the current test does not show whether a change in HVR is due to an alteration of the interaction of hypoxia with the peripheral chemoreflex CO2 response, which would affect the slope, or due to an alteration in the carotid body activity, which would affect the ventilatory recruitment threshold.
As stated in the proposal introduced by John W. Severinghaus at the recent 15th international hypoxia conference at Lake Louise (http://www.hypoxia.net/forum/HVR.pdf): ‘Peripheral chemosensitivity should be tested with equal central ventilatory drive’. Isocapnic measures of ventilatory responses to changes in PO2 or SO2 rely on the choice of isocapnic PCO2 to maintain equal central ventilatory drives between tests (Harris et al. 2006). However, achieving this condition is problematic (Robbins, 2007).
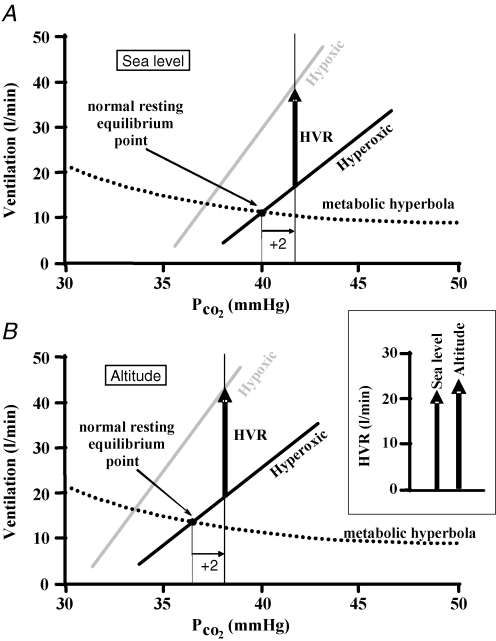
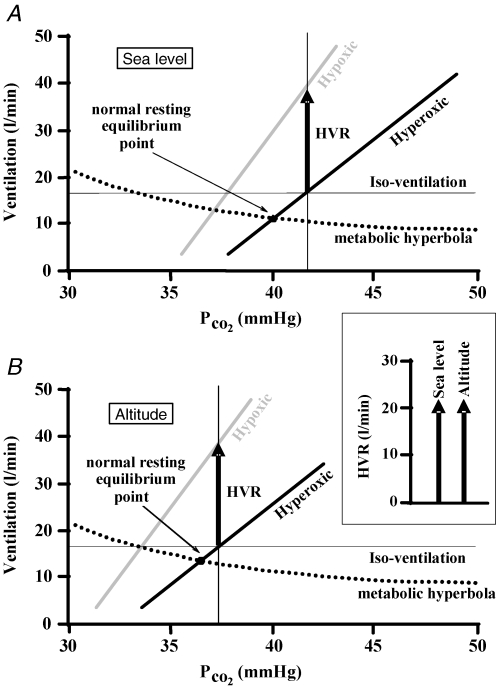
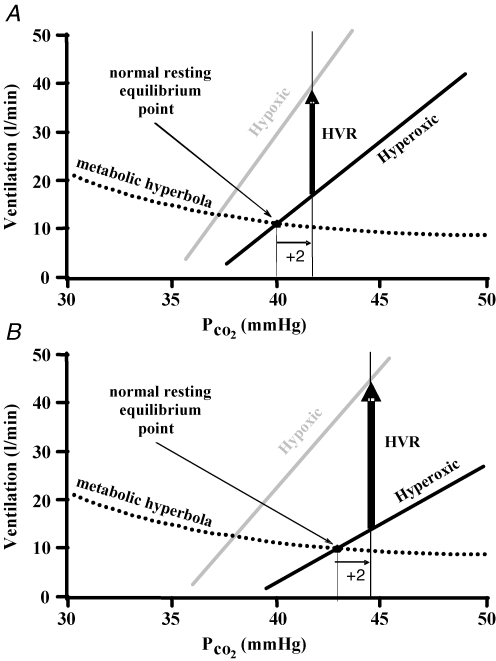
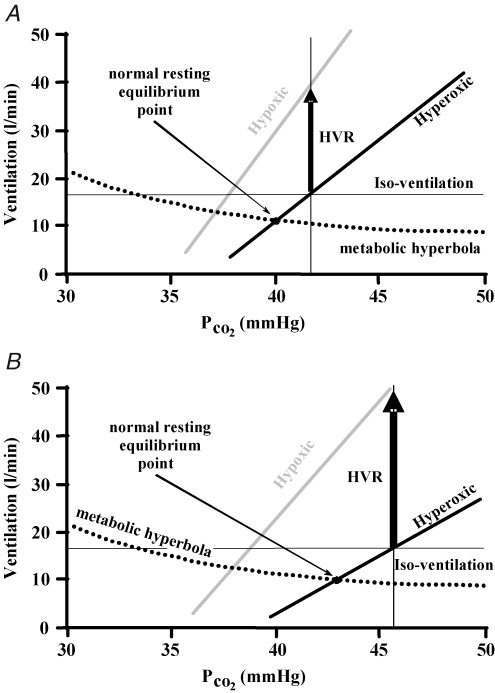
If the isocapnic choice is based relative to resting PCO2, then changes in the ventilatory recruitment threshold of the PCO2 response due to alterations in acid–base, such as the leftward shift that occurs at altitude (Somogyi et al. 2005), produce an artefactual increase in HVR as shown in Fig. 4. This problem can be overcome by using an isocapnic PCO2 that produces the same hyperoxic ventilation as suggested by (Sato et al. 1994), and is illustrated in Fig. 5. However, neither of these methods for choosing the isocapnic PCO2 prevents an artefactual increase in HVR if there is a change in central chemosensitivity between tests, as illustrated in Figs 6 and 7.
Figure 4. A threshold shift scenario.
The HVR (as defined in Fig. 2), is shown at sea level (A) and high altitude (B). The only difference between the ventilatory responses to CO2 at sea level and those at altitude at a given isoxic tension (hyperoxic or hypoxic) is a decrease in threshold (leftward shift); the metabolic hyperbola is assumed to be unchanged. If the choice of isocapnia is made relative to the resting PCO2, then the altitude HVR compared to the HVR at sea level is artefactually increased as the inset box shows in a side-by-side comparison.
Figure 5. A threshold shift scenario as forFig. 4.
The HVR (as defined in Fig. 2), is shown at sea level (A) and high altitude (B). The only difference between the ventilatory responses to CO2 at sea level and those at altitude at a given isoxic tension (hyperoxic or hypoxic) is a decrease in threshold (leftward shift); the metabolic hyperbola is assumed to be unchanged. If a hypercapnic iso-ventilation is used to set the isocapnic PCO2 then the altitude HVR compared to the HVR at sea level does not change and is measured correctly as the inset box shows in a side-by-side comparison.
Figure 6. The HVR is as shown inFig. 2, representing the HVR in the first condition (A) and second condition (B).
The second condition (B) shows a decrease in the slope of the hyperoxic CO2 response line, but no change in the peripheral chemoreflex contribution to the hypoxic CO2 response line. If the choice of isocapnia is made relative to the resting PCO2, then the HVR of condition 2(B) compared to the HVR of condition 1(A) is artefactually increased.
Figure 7.
Repeating the scenario pictured in Fig. 6, if a hypercapnic iso-ventilation is used to set the isocapnic PCO2 then the HVR of condition 2 (B) compared to the HVR of condition 1 (A) is artefactually increased.
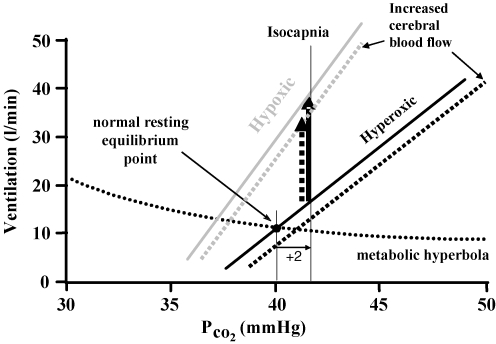
A further concern is that no matter what isocapnic PCO2 is used, changes of cerebral blood flow with hypoxia during testing or changes in cerebral blood flow reactivity to CO2 and hypoxia between and within tests and between individuals will also confound the measurement of HVR by altering the central chemoreflex drive due to CO2 washout (Ainslie & Poulin, 2004; Xie et al. 2006). The effect of a change in cerebral blood flow on HVR measured as the isocapnic change in ventilation with hypoxia is illustrated in Fig. 8. An example of such a change in cerebrovascular reactivity is that which occurs overnight (Meadows et al. 2005; Corfield & Meadows, 2006) or upon ascent to high altitude (Ainslie et al. 2007).
Figure 8. An increase in cerebral blood flow scenario.
As in Fig. 2, after determining the ventilation at an isocapnic PCO2 in hyperoxia to measure the central chemoreflex contribution, hypoxia is introduced and the ventilation measured again at the isocapnic PCO2. Here, however, hypoxia induces an increase in cerebral blood flow, washing out central CO2 and reducing the central chemoreflex response. The dashed lines show the effect on both hyperoxic and hypoxic CO2 response lines. As a result the HVR measured (dashed arrow) is artefactually reduced from its true value (continuous arrow).
These scenarios illustrate the difficulty in making a choice of isocapnia that will allow comparisons of HVR between tests. It is therefore necessary to develop measures that will allow such comparisons as well as fully describing the ventilatory response to hypoxia.
Proposed regime for measuring the hypoxic ventilatory response
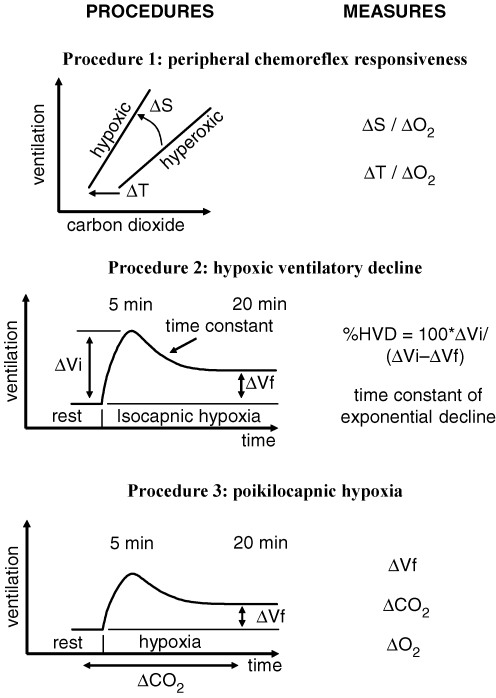
The following is not intended to mandate the details of a particular experimental setup and the testing conditions, but rather the principles of testing that should be followed so that test results may be compared. A measurement regime consisting of three procedures is proposed. The first determines the immediate (within 5 min) peripheral chemoreflex ventilatory response. The second procedure measures the time course of HVD and the third procedure measures the ventilatory response to environmental hypoxia. Figure 9 outlines the proposed measurement regime, which makes the following assumptions.
Figure 9. Procedures of the measurement regime.
Procedure 1 measures the changes in slopes (ΔS) and thresholds (ΔT) of the ventilatory responses to CO2 for a given change from hyperoxia to hypoxia (ΔO2). Procedure 2 measures the time course of the decline in ventilation between 5 and 20 min after the start of isocapnic hypoxia at a specified CO2 and O2 in terms of the percentage HVD and the time constant of the fitted exponential decline. Procedure 3 measures the ventilatory response (ΔVf and ΔCO2) after 20 min of poikilocapnic hypoxia at a specified O2.
HVR is mediated by the peripheral chemoreflex alone (Cunningham, 1987).
Hyperoxia (150 mmHg) silences the peripheral chemoreflex response to CO2 (Lloyd & Cunningham, 1963; Mohan & Duffin, 1997).
In the range of hypoxia limited by ethical considerations, hypoxia does not affect ventilation through other means such as central depression or excitation (Honda, 1992; Fatemian et al. 2003).
Ventilation is controlled by both central and peripheral chemoreflexes (Cunningham et al. 1986) and their drives are additive (Clement et al. 1992; Clement et al. 1995; St. Croix et al. (1996).
Cerebral blood flow is affected by both CO2 and hypoxia (Poulin et al. 1996; Vovk et al. 2002; Meadows et al. 2004).
HVR is time dependent (Easton et al. 1986; Powell, 2007) and can be arbitrarily divided into two phases; a first phase (0–5 min) of immediate ventilation increase, followed by a second phase (5–20 min) of HVD (Liang et al. 1997; Steinback & Poulin, 2007).
Procedure 1. Measuring peripheral chemoreflex responsiveness
For the reasons stated previously, the peripheral chemoreflex response to hypoxia cannot simply be measured as the difference in ventilation produced by changes in isocapnic hypoxic and hyperoxic O2 tensions or saturations. However, it can be determined by comparing the difference between ventilatory responses to CO2 at a high constant O2 tension (isoxic hyperoxic ventilatory response to CO2) and a low constant O2 tension (isoxic hypoxic ventilatory response to CO2). Given the assumptions above, the hyperoxic response measures the central chemoreflex and the hypoxic response measures the sum of the central and peripheral responses. Therefore the difference between hyperoxic and hypoxic responses represents the ventilatory contribution of the peripheral chemoreflex.
Such a comparison (Fig. 10) shows that the peripheral chemoreflex response to hypoxia can be characterized by an increase in sensitivity to CO2, the difference of sensitivities between the isoxic hypoxic and hyperoxic ventilatory responses to CO2, and a decrease in the ventilatory recruitment threshold from the hyperoxic to the hypoxic isoxic ventilatory response to CO2, reflecting either an increase in peripheral chemoreflex activity or the increase in CO2 sensitivity. These two measures thus define the peripheral chemoreflex.
If comparison of peripheral chemoreflex responsiveness is the aim, then the measurements of the isoxic responses to CO2 can be limited to two defined isoxic tensions: (1) a hyperoxic PO2 of 150 mmHg to determine the central response to CO2 and (2) a hypoxic PO2 of 50 mmHg, which would add the peripheral response. The differences in sensitivities and ventilatory recruitment thresholds between these tests define a peripheral chemoreflex responsiveness, which can then be compared between subjects and conditions.
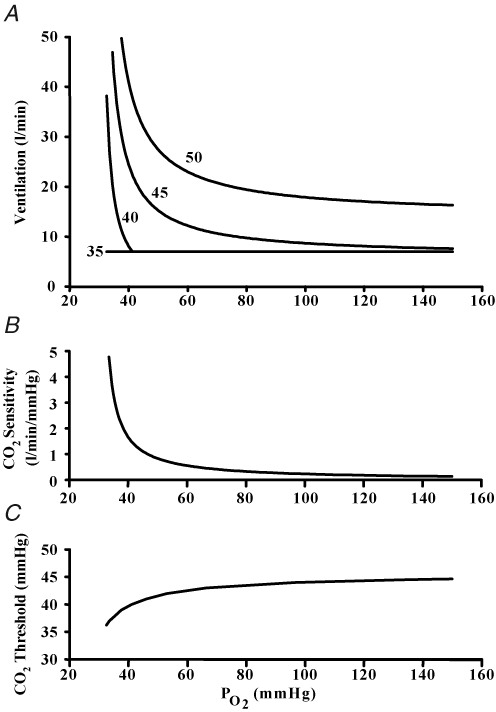
However, if the aim is to fully characterize the peripheral chemoreflex, then a series of hypoxic isoxic CO2 responses at different PO2 tensions can be measured and their differences in sensitivity and ventilatory recruitment threshold from the hyperoxic isoxic CO2 response defines the complete peripheral chemoreflex response to hypoxia. Such results can be displayed either as a series of isocapnic ventilatory responses to PO2 or as a plot of peripheral chemoreflex CO2 sensitivity and threshold against PO2 as shown in Fig. 11. The latter relations are useful to modellers (Duffin, 2005; Stuhmiller & Stuhmiller, 2005; Topor et al. 2007).
Figure 11.
A, isocapnic ventilatory responses to hypoxia at isocapnic tensions of 35, 40, 45 and 50 mmHg. B, variation of the peripheral chemoreflex CO2 sensitivity with PO2. C, variation of the CO2 response ventilatory recruitment threshold with PO2.
The isoxic hypoxic and hyperoxic ventilatory responses to CO2 can be measured using either steady state methods, including end-tidal forcing, or rebreathing methods, but should be completed within the first 5 min of hypoxic exposure, an arbitrarily set time limit based on the observed time course of the immediate response. Each method has advantages and disadvantages.
The steady state method requires at least three points to determine the sensitivity to CO2 at each isoxic level, requiring some 5 min per point response time to allow central equilibration of CO2, and therefore care in limiting the accumulated hypoxic exposure time to avoid HVD. An experimental approach such as the following could be used: in a background of hyperoxia (e.g. 150 mmHg), increase end-tidal PCO2 to three different isocapnic tensions above resting each for 8 min with the last 3 min at specific end-tidal hypoxic tension (e.g. 50 mmHg), with each isocapnic tension separated by a resting period of at least 5 min to return end-tidal tensions to normal. At each isocapnic tension the fifth minute ventilation measures the central response and the eighth minute measures the central plus peripheral response. This approach measures the response relative to arterial CO2, and may underestimate the sensitivity due to the increase in cerebral blood flow with CO2 (Berkenbosch et al. 1989; Pandit et al. 2003). Since the ventilatory recruitment thresholds are not measured, the difference between the hyperoxic and hypoxic responses at resting ventilation can be substituted.
The modified rebreathing method (Mohan et al. 1999; Duffin et al. 2000) measures both sensitivity and ventilatory recruitment threshold within the initial 5 min of hypoxia. It measures the response relative to venous CO2, reducing the arteriovenous difference sufficiently to negate any effects of cerebral blood flow changes. It can therefore be used to measure changes in the peripheral chemoreflex response where there are known changes in cerebrovascular activity such as those that occur overnight (Mahamed et al. 2005; Meadows et al. 2005; Beecroft et al. 2006) or at high altitude (Ainslie et al. 2007). However, the rebreathing method may overestimate the CO2 sensitivity if central CO2 increases faster than mixed venous CO2 because brain CO2 production is greater than whole body CO2 production. Modelling shows this factor to be negligible (Read & Leigh, 1967) but direct experimental evidence for this assumption is lacking.
Procedure 2. Measuring HVD, the isocapnic hypoxic ventilatory response
The peripheral chemoreflex response measurement procedure as described above can be considered a ‘snapshot’ of the immediate peripheral chemoreflex response to hypoxia. To measure the second phase, HVD, two approaches can be employed. One measures the peripheral chemoreflex response to hypoxia before and after exposure to 20 min of hypoxia (Mahamed & Duffin, 2001) and determines the changes in chemoreflex characteristics according to the first procedure. This approach does not require a choice of isocapnia and if rebreathing is used then cerebral blood flow changes do not affect the measurement; however, the time course of the HVD is not determined.
The other approach measures the complete time course of ventilation during 20 min of isocapnic hypoxia (Steinback & Poulin, 2007) so that the time course of HVD can be modelled (Liang et al. 1997). Isocapnic hypoxia may be maintained using a feedback approach to end-tidal forcing (Robbins et al. 1982) or a feedforward approach using sequential breathing (Slessarev et al. 2007). In this test the choice of isocapnic PCO2 is again problematic, but if comparisons are limited to the time course of the response and the degree of HVD rather than the absolute amplitude, and the effect of any cerebral blood flow changes over the 20 min of measurement can be ignored (Suzuki et al. 1989), then HVD can be determined.
Procedure 3. Measuring the poikilocapnic hypoxic ventilatory response
The effect of hypoxia on ventilation, when PCO2 is uncontrolled is not large (Steinback & Poulin, 2007) because any increase in ventilation increases the elimination of CO2, thereby lowering PCO2 and reducing both the central and peripheral chemoreflex contributions to ventilation. The central chemoreflex contribution is also affected by changes in central PCO2 resulting from changes in cerebral blood flow that occur in response to both hypoxia and the resulting hypocapnia (Poulin & Robbins 1998; Poulin et al. 2002). Measuring ventilation during a 20 min poikilocapnic hypoxic exposure thus simulates the response that would be observed on an environmental exposure to hypoxia, for example at altitude. As such it may serve a predictive purpose, relevant to altitude sickness, but this aspect has not been tested.
Concluding remarks
The measurement procedures described here can be carried out using a variety of equipment and techniques and under a variety of conditions. They are designed to provide measures of the ventilatory response to hypoxia that can be compared between subjects and within subjects under different conditions. The same principles of methodology can be applied to measuring other physiological responses to hypoxia such as cerebral blood flow (Vovk et al. 2002) and cardiovascular changes (Shoemaker et al. 2002). It is recognized that the assumptions underlying the tests as stated here may be subject to criticism; they are proposed to stimulate discussion in the hope that a consensus may be reached and standardized methods of measurement developed as a result.
Acknowledgments
Thanks are due to Dr. J. Fisher & Thornhill Research for support, and to Drs. P.N. Ainslie, H.J. Bell and J.H. Mateika for helpful discussion.
References
- Ainslie PN, Burgess K, Subedi P, Burgess KR. Alterations in cerebral dynamics at high altitude following partial acclimatization in humans: wakefulness and sleep. J Appl Physiol. 2007;102:658–664. doi: 10.1152/japplphysiol.00911.2006. [DOI] [PubMed] [Google Scholar]
- Ainslie PN, Poulin MJ. Ventilatory, cerebrovascular, and cardiovascular interactions in acute hypoxia: regulation by carbon dioxide. J Appl Physiol. 2004;97:149–159. doi: 10.1152/japplphysiol.01385.2003. [DOI] [PubMed] [Google Scholar]
- Bascom DA, Clement ID, Cunningham DA, Painter R, Robbins PA. Changes in peripheral chemoreflex sensitivity during sustained, isocapnic hypoxia. Respir Physiol. 1990;82:161–176. doi: 10.1016/0034-5687(90)90032-t. [DOI] [PubMed] [Google Scholar]
- Becker HF, Polo O, Mcnamara SG, Berthon-Jones M, Sullivan CE. Effect of different levels of hyperoxia on breathing in healthy subjects. J Appl Physiol. 1996;81:1683–1690. doi: 10.1152/jappl.1996.81.4.1683. [DOI] [PubMed] [Google Scholar]
- Beecroft J, Duffin J, Pierratos A, Chan CT, McFarlane P, Hanly PJ. Enhanced chemo-responsiveness in patients with sleep apnoea and end-stage renal disease. Eur Respir J. 2006;28:151–158. doi: 10.1183/09031936.06.00075405. [DOI] [PubMed] [Google Scholar]
- Berkenbosch A, Bovill JG, Dahan A, DeGoede J, Olievier IC. The ventilatory CO2 sensitivities from Read's rebreathing method and the steady-state method are not equal in man. J Physiol. 1989;411:367–377. doi: 10.1113/jphysiol.1989.sp017578. [DOI] [PMC free article] [PubMed] [Google Scholar]
- Clement ID, Bascom DA, Conway J, Dorrington KL, O'Connor DF, Painter R, Paterson DJ, Robbins PA. An assessment of central–peripheral ventilatory chemoreflex interaction in humans. Respir Physiol. 1992;88:87–100. doi: 10.1016/0034-5687(92)90031-q. [DOI] [PubMed] [Google Scholar]
- Clement ID, Pandit JJ, Bascom DA, Dorrington KL, O'Connor DF, Robbins PA. An assessment of central–peripheral ventilatory chemoreflex interaction using acid and bicarbonate infusions in humans. J Physiol. 1995;485:561–570. doi: 10.1113/jphysiol.1995.sp020752. [DOI] [PMC free article] [PubMed] [Google Scholar]
- Corfield DR, Meadows GE. Control of cerebral blood flow during sleep and the effects of hypoxia. Adv Exp Med Biol. 2006;588:65–73. doi: 10.1007/978-0-387-34817-9_7. [DOI] [PubMed] [Google Scholar]
- Cunningham DJC. Review lecture: studies on arterial chemoreceptors in man. J Physiol. 1987;384:1–26. doi: 10.1113/jphysiol.1987.sp016440. [DOI] [PMC free article] [PubMed] [Google Scholar]
- Cunningham DJC, Robbins PA, Wolff CB. Integration of respiratory responses to changes in alveolar partial pressures of CO2 and O2 and in arterial pH. In: Fishman A P, Cherniack N S, Widdicombe JG, editors. Handbook of Physiology, section 3, The Respiratory System. II. Bethesda, MD, USA: American Physiological Society; 1986. pp. 475–528. [Google Scholar]
- Duffin J. Role of acid-base balance in the chemoreflex control of breathing. J Appl Physiol. 2005;99:2255–2265. doi: 10.1152/japplphysiol.00640.2005. [DOI] [PubMed] [Google Scholar]
- Duffin J, Mahamed S. Adaptation in the respiratory control system. Can J Physiol Pharmacol. 2003;81:765–773. doi: 10.1139/y03-049. [DOI] [PubMed] [Google Scholar]
- Duffin J, Mohan RM, Vasiliou P, Stephenson R, Mahamed S. A model of the chemoreflex control of breathing in humans: Model parameters measurement. Respir Physiol. 2000;120:13–26. doi: 10.1016/s0034-5687(00)00095-5. [DOI] [PubMed] [Google Scholar]
- Easton PA, Slykerman LJ, Anthonisen NR. Ventilatory response to sustained hypoxia in normal adults. J Appl Physiol. 1986;61:906–911. doi: 10.1152/jappl.1986.61.3.906. [DOI] [PubMed] [Google Scholar]
- Fatemian M, Nieuwenhuijs DJ, Teppema LJ, Meinesz S, van der Mey AG, Dahan A, Robbins PA. The respiratory response to carbon dioxide in humans with unilateral and bilateral resections of the carotid bodies. J Physiol. 2003;549:965–973. doi: 10.1113/jphysiol.2003.042259. [DOI] [PMC free article] [PubMed] [Google Scholar]
- Harris DP, Balasubramaniam A, Badr MS, Mateika JH. Long-term facilitation of ventilation and genioglossus muscle activity is evident in the presence of elevated levels of carbon dioxide in awake humans. Am J Physiol Regul Integr Comp Physiol. 2006;291:R1111–R1119. doi: 10.1152/ajpregu.00896.2005. [DOI] [PubMed] [Google Scholar]
- Honda Y. Respiratory and circulatory activities in carotid body-resected humans. J Appl Physiol. 1992;73:1–8. doi: 10.1152/jappl.1992.73.1.1. [DOI] [PubMed] [Google Scholar]
- Kumar P, Bin-Jaliah I. Adequate stimuli of the carotid body: More than an oxygen sensor? Respir Physiol & Neurobiol. 2007;157:12–21. doi: 10.1016/j.resp.2007.01.007. [DOI] [PubMed] [Google Scholar]
- Leon-Velarde F, Gamboa A, Rivera ChM, Palacios JA, Robbins PA. Plasticity in respiratory motor control – Selected contribution: Peripheral chemoreflex function in high-altitude natives and patients with chronic mountain sickness. J Appl Physiol. 2003;94:1269–1278. doi: 10.1152/japplphysiol.00858.2002. [DOI] [PubMed] [Google Scholar]
- Liang PJ, Bascom DA, Robbins PA. Extended models of the ventilatory response to sustained isocapnic hypoxia in humans. J Appl Physiol. 1997;82:667–677. doi: 10.1152/jappl.1997.82.2.667. [DOI] [PubMed] [Google Scholar]
- Lloyd BB, Cunningham DJC. A quantitative approach to the regulation of human respiration. In: Cunningham DJC, Lloyd BB, editors. The Regulation of Human Respiration. Oxford: Blackwell; 1963. pp. 331–349. [Google Scholar]
- Mahamed S, Duffin J. Repeated hypoxic exposures change respiratory chemoreflex control in humans. J Physiol. 2001;534:595–603. doi: 10.1111/j.1469-7793.2001.00595.x. [DOI] [PMC free article] [PubMed] [Google Scholar]
- Mahamed S, Hanly PJ, Gabor J, Beecroft J, Duffin J. Overnight changes of chemoreflex control in obstructive sleep apnoea patients. Respir Physiol Neurobiol. 2005;146:279–290. doi: 10.1016/j.resp.2004.11.013. [DOI] [PubMed] [Google Scholar]
- Mateika JH, Mendello C, Obeid D, Badr MS. Peripheral chemoreflex responsiveness is increased at elevated levels of carbon dioxide following episodic hypoxia in awake humans. J Appl Physiol. 2004;96:1197–1205. doi: 10.1152/japplphysiol.00573.2003. [DOI] [PubMed] [Google Scholar]
- Meadows GE, Kotajima F, Vazir A, Kostikas K, Simonds AK, Morrell MJ, Corfield DR. Overnight changes in the cerebral vascular response to isocapnic hypoxia and hypercapnia in healthy humans: protection against stroke. Stroke. 2005;36:2367–2372. doi: 10.1161/01.STR.0000185923.49484.0f. [DOI] [PubMed] [Google Scholar]
- Meadows GE, O'Driscoll DM, Simonds AK, Morrell MJ, Corfield DR. Cerebral blood flow response to isocapnic hypoxia during slow-wave sleep and wakefulness. J Appl Physiol. 2004;97:1343–1348. doi: 10.1152/japplphysiol.01101.2003. [DOI] [PubMed] [Google Scholar]
- Mohan RM, Amara CE, Cunningham DA, Duffin J. Measuring the central-chemoreflex sensitivity in man: rebreathing and steady-state methods compared. Respir Physiol. 1999;115:23–33. doi: 10.1016/s0034-5687(99)00003-1. [DOI] [PubMed] [Google Scholar]
- Mohan R, Duffin J. The effect of hypoxia on the ventilatory response to carbon dioxide in man. Respir Physiol. 1997;108:101–115. doi: 10.1016/s0034-5687(97)00024-8. [DOI] [PubMed] [Google Scholar]
- Pandit JJ, Mohan RM, Paterson ND, Poulin MJ. Cerebral blood flow sensitivity to CO2 measured with steady-state and Read's rebreathing methods. Respir Physiol Neurobiol. 2003;137:1–10. doi: 10.1016/s1569-9048(03)00089-2. [DOI] [PubMed] [Google Scholar]
- Poulin MJ, Fatemian M, Tansley JG, O'Connor DF, Robbins PA. Changes in cerebral blood flow during and after 48 h of both isocapnic and poikilocapnic hypoxia in humans. Exp Physiol. 2002;87:633–642. doi: 10.1113/eph8702437. [DOI] [PubMed] [Google Scholar]
- Poulin MJ, Liang PJ, Robbins PA. Dynamics of the cerebral blood flow response to step changes in end-tidal PCO2 and PO2 in humans. J Appl Physiol. 1996;81:1084–1095. doi: 10.1152/jappl.1996.81.3.1084. [DOI] [PubMed] [Google Scholar]
- Poulin MJ, Robbins PA. Influence of cerebral blood flow on the ventilatory response to hypoxia in humans. Exp Physiol. 1998;83:95–106. doi: 10.1113/expphysiol.1998.sp004095. [DOI] [PubMed] [Google Scholar]
- Powell FL. The influence of chronic hypoxia upon chemoreception. Respir Physiol Neurobiol. 2007;157:154–161. doi: 10.1016/j.resp.2007.01.009. [DOI] [PMC free article] [PubMed] [Google Scholar]
- Read DJC, Leigh J. Blood-brain tissue PCO2 relationships and ventilation during rebreathing. J Appl Physiol. 1967;23:53–70. doi: 10.1152/jappl.1967.23.1.53. [DOI] [PubMed] [Google Scholar]
- Robbins PA. Role of the peripheral chemoreflex in the early stages of ventilatory acclimatization to altitude. Respir Physiol Neurobiol. 2007 doi: 10.1016/j.resp.2007.03.008. in press. [DOI] [PubMed] [Google Scholar]
- Robbins PA, Swanson GD, Micco AJ, Schubert WP. A fast gas-mixing system for breath-to-breath respiratory control studies. J Appl Physiol. 1982;52:1358–1362. doi: 10.1152/jappl.1982.52.5.1358. [DOI] [PubMed] [Google Scholar]
- Sato M, Severinghaus JW, Bickler P. Time course of augmentation and depression of hypoxic ventilatory responses at altitude. J Appl Physiol. 1994;77:313–316. doi: 10.1152/jappl.1994.77.1.313. [DOI] [PubMed] [Google Scholar]
- Shoemaker J, Vovk A, Cunningham D. Peripheral chemoreceptor contributions to sympathetic and cardiovascular responses during hypercapnia. Can J Physiol Pharmacol. 2002;80:1136–1144. doi: 10.1139/y02-148. [DOI] [PubMed] [Google Scholar]
- Slessarev M, Han J, Mardimae A, Prisman E, Preiss D, Volgyesi G, Ansel C, Duffin J, Fisher JA. Prospective targeting and control of end-tidal CO2 and O2 concentrations. J Physiol. 2007;581:1207–1219. doi: 10.1113/jphysiol.2007.129395. [DOI] [PMC free article] [PubMed] [Google Scholar]
- Slessarev M, Prisman E, Ito S, Watson R, Jensen D, Preiss D, Greene R, Norboo T, Stobdan T, Diskit D, Norboo A, Kunzang M, Fisher JA, Duffin J, Appenzeller O. Chemoreflex control of breathing in Himalayan and sea-level residents (Abstracts of the 15th International Hypoxia Symposium) High Alt Med Biol. 2007;7:319–350. [Google Scholar]
- Somogyi RB, Preiss D, Vesely A, Fisher JA, Duffin J. Changes in respiratory control after 5 days at altitude. Respir Physiol Neurobiol. 2005;145:41–52. doi: 10.1016/j.resp.2004.11.004. [DOI] [PubMed] [Google Scholar]
- St Croix CM, Cunningham DA, Paterson DH. Nature of the interaction between central and peripheral chemoreceptor drives in human subjects. Can J Physiol Pharmacol. 1996;74:640–646. doi: 10.1139/cjpp-74-6-640. [DOI] [PubMed] [Google Scholar]
- Steinback CD, Poulin MJ. Ventilatory responses to isocapnic and poikilocapnic hypoxia in humans. Respir Physiol Neurobiol. 2007;155:104–113. doi: 10.1016/j.resp.2006.05.006. [DOI] [PubMed] [Google Scholar]
- Stuhmiller JH, Stuhmiller LM. A mathematical model of ventilation response to inhaled carbon monoxide. J Appl Physiol. 2005;98:2033–2044. doi: 10.1152/japplphysiol.00034.2005. [DOI] [PubMed] [Google Scholar]
- Suzuki A, Nishimura M, Yamamoto H, Miyamoto K, Kishi F, Kawakami Y. No effect of brain blood flow on ventilatory depression during sustained hypoxia. J Appl Physiol. 1989;66:1674–1678. doi: 10.1152/jappl.1989.66.4.1674. [DOI] [PubMed] [Google Scholar]
- Topor ZL, Vasilakos K, Younes M, Remmers JE. Model based analysis of sleep disordered breathing in congestive heart failure. Respir Physiol Neurobiol. 2007;155:82–92. doi: 10.1016/j.resp.2006.04.016. [DOI] [PubMed] [Google Scholar]
- Torrance RW. Prolegomena. Chemoreception upstream of transmitters. Adv Exper Med Biol. 1996;410:13–38. [PubMed] [Google Scholar]
- Vovk A, Cunningham DA, Kowalchuk JM, Paterson DH, Duffin J. Cerebral blood flow responses to changes in oxygen and carbon dioxide in humans. Can J Physiol Pharmacol. 2002;80:819–827. doi: 10.1139/y02-105. [DOI] [PubMed] [Google Scholar]
- Xie A, Skatrud JB, Morgan B, Chenuel B, Khayat R, Reichmuth K, Lin J, Dempsey JA. Influence of cerebrovascular function on the hypercapnic ventilatory response in healthy humans. J Physiol. 2006;577:319–329. doi: 10.1113/jphysiol.2006.110627. [DOI] [PMC free article] [PubMed] [Google Scholar]


