Abstract
Repetitive synaptic stimulation evokes large amplitude Ca2+ release waves from internal stores in many kinds of pyramidal neurons. The waves result from mGluR mobilization of IP3 leading to Ca2+-induced Ca2+ release. In most experiments in slices, regenerative Ca2+ release can be evoked for only a few trials. We examined the conditions required for consistent release from the internal stores in hippocampal CA1 pyramidal neurons. We found that priming with action potentials evoked at 0.5–1 Hz for intervals as short as 15 s were sufficient to fill the stores, while sustained subthreshold depolarization or subthreshold synaptic stimulation lasting from 15 s to 2 min was less effective. A single episode of priming was effective for about 2–3 min. Ca2+ waves could also be evoked by uncaging IP3 with a UV flash in the dendrites. Priming was necessary to evoke these waves repetitively; 7–10 spikes in 15 s were again effective for this protocol, indicating that priming acts to refill the stores and not at a site upstream to the production of IP3. These results suggest that normal spiking activity of pyramidal neurons in vivo should be sufficient to maintain their internal stores in a primed state ready to release Ca2+ in response to an appropriate physiological stimulus. This may be a novel form of synaptic plasticity where a cell's capacity to release Ca2+ is modulated by its average firing frequency.
Repetitive synaptic stimulation evokes Ca2+ release from internal stores in several kinds of pyramidal neurons in the hippocampus (Pozzo-Miller et al. 1996; Nakamura et al. 1999; Yeckel et al. 1999; Power & Sah, 2002), amygdala (Power & Sah, 2005), cortex (Larkum et al. 2003; Hagenston et al. 2007), and in dopamine neurons (Morikawa et al. 2003). This release spreads as a wave in restricted regions of the proximal dendrites of these cells and is generated by the mobilization and action of IP3 following the activation of group I metabotropic glutamate receptors (mGluRs; Nakamura et al. 1999, 2000; Power & Sah, 2002, 2007). The magnitude of the Ca2+ release wave often reaches several micromolar and lasts typically 0.5–1.5 s (Larkum et al. 2003). This large increase, which is spatially and mechanistically distinct (Nakamura et al. 2002) from the more studied forms of postsynaptic [Ca2+]i increase (Ca2+ entry through NMDA receptors and Ca2+ entry through voltage-gated Ca2+ channels) may play important roles in synaptic plasticity, gene expression, and other forms of postsynaptic signalling.
Following this large release of Ca2+ from the endoplasmic reticulum (ER) into the cytoplasm, much of the Ca2+ is pumped back into the ER by sarco(endo)plasmic reticulum Ca2+ ATPase (SERCA) pumps (e.g. Misquitta et al. 1999). This process typically takes 30–60 s following regenerative release (Garaschuk et al. 1997; Nakamura et al. 2000). However, some of the cytoplasmic Ca2+ is pumped out of the cell so the stores are probably not completely refilled. Indeed several groups have noted that it is difficult to repetitively release Ca2+ from stores without some procedure for refilling the stores.
In non-neuronal cells stores are often refilled through special capacitative Ca2+ channels, which are activated following depletion of store content (Parekh, 2003; Putney, 2005; Roos et al. 2005). Refilling through this mechanism does not appear to be important in neuronal cells. Rather, entry through voltage-gated Ca2+ channels is sufficient in many cases to refill or ‘prime’ the stores.
‘Priming’ has been used in many experiments in slices to refill stores in order to study aspects of the Ca2+ release mechanism. The parameters of the priming process have not been studied in detail. Usually, the experimenters were satisfied to find a procedure that worked. These included depolarizing pulses (Garaschuk et al. 1997; Finch & Augustine, 1998), action potentials (Jaffe & Brown, 1994; Fiorillo & Williams, 1998; Larkum et al. 2003; Stutzmann et al. 2003; Power & Sah, 2005; Watanabe et al. 2006; Hagenston et al. 2007), high-potassium induced depolarization (Garaschuk et al. 1997) and sustained voltage-clamped depolarization (Pozzo-Miller et al. 1996). In one study (Power & Sah, 2005) sustained subthreshold depolarization was found to be sufficient and perhaps the more important pathway for filling basolateral amygdalar projection neurons, presumably through the activation of low-threshold voltage-gated Ca2+ channels.
How stores are refilled is important since only some of the above protocols could be mimicked by in vivo physiological patterns. In this study we examined the parameters of store priming in hippocampal CA1 pyramidal neurons more systematically. We found that even though there was a fair amount of variability from cell to cell some generalizations could be made. Action potentials evoked at 0.5–1 Hz for brief periods were usually sufficient to fill stores. Sustained subthreshold depolarization and repetitive synaptic stimulation were much less effective in priming the stores. Following priming, Ca2+ release could often be evoked for several trials without further priming although there were many cases where release could not be evoked unless priming immediately preceded the trial. In those trials where release was present in multiple trials after a single episode of priming, the magnitude of release decreased with each successive trial until the release completely disappeared. The effect of a single episode of priming lasted for about 2–3 min before dissipating. These results suggest that normal spiking activity of pyramidal neurons in vivo should be sufficient to maintain stores in a primed state ready to release Ca2+. We also found that priming the internal stores was not the only factor affecting whether the stores release Ca2+ following tetanic stimulation. Increasing the stimulation intensity increased the likelihood of Ca2+ release even if the stores were not primed, indicating that the threshold for evoking release cannot be described as a function of a single parameter.
Methods
Whole-cell recording
Transverse hippocampal slices (300 μm thick) from 2- to 4-week-old Sprague–Dawley rats were prepared as previously described (Nakamura et al. 1999, 2002). Animals were anaesthetized with isoflurane and decapitated using procedures approved by the Institutional Animal Care and Use Committee of New York Medical College. Slices were cut in an ice-cold solution consisting of (mm): 120 choline chloride, 3 KCl, 8 MgCl2, 1.25 NaH2PO4, 26 NaHCO3, and 10 glucose. They were incubated for at least 1 h in normal ACSF (artificial cerebrospinal fluid) composed of (mm): 124 NaCl, 2.5 KCl, 2 CaCl2, 2 MgCl2, 1.25 NaH2PO4, 26 NaHCO3, and 10 or 20 glucose, bubbled with a mixture of 95% O2–5% CO2, making the final pH 7.4. The same solution was used for recording.
Submerged and superfused slices were placed in a chamber mounted on a stage rigidly bolted to an air table and were viewed with a ×40 water-immersion lens in an Olympus BX50WI microscope mounted on an X–Y translation stage. Somatic whole-cell recordings were made using patch pipettes pulled from 1.5 mm outer diameter thick-walled glass tubing (1511-M, Friedrich & Dimmock, Millville, NJ, USA). Tight seals on CA1 pyramidal cell somata or proximal apical dendrites were made with the ‘blow and seal’ technique using video-enhanced DIC optics to visualize the cells (Sakmann & Stuart, 1995). For most experiments the pipette solution contained (mm): 140 potassium gluconate, 4 NaCl, 4 Mg-ATP, 0.3 Na-GTP, and 10 Hepes, pH adjusted to 7.2–7.4 with KOH. This solution was supplemented with either 150 μm bis-fura-2, 300 μm furaptra, or 200 μm Oregon Green Bapta-5N (Molecular Probes, Eugene, OR, USA). Synaptic stimulation was evoked with 100 μs pulses with glass electrodes placed on the slice about 10–30 μm to the side of the main apical dendritic shaft and at varying distances from the soma. These electrodes were low resistance patch electrodes (less than 5 MΩ) filled with ACSF or a sharp tungsten electrode (WPI, Sarasota, FL, USA; model TM33B01KT) each with a tungsten wire glued to the side. We controlled the amplitude of the synaptic response to be below the threshold for action potential generation, either by regulating the stimulation current or hyperpolarizing the cell body with the patch electrode on the soma. Temperature in the chamber was maintained between 31 and 33°C. All other chemicals were obtained from Fisher Scientific (Piscataway, NJ, USA) or Sigma Chemical Co. (St Louis, MO, USA).
Dynamic [Ca2+]i measurements
Time-dependent [Ca2+]i measurements from different regions of the pyramidal neuron were made as previously described (Lasser-Ross et al. 1991; Nakamura et al. 2002). Briefly, a Photometrics (Tucson, AZ, USA) AT300 cooled CCD camera, operated in the frame transfer mode, was mounted on the camera port of the microscope. Custom software (original version described in Lasser-Ross et al. 1991) controlled readout parameters and synchronization with electrical recordings. A second custom program was used to analyse and display the data. Pixels were binned in the camera to allow frame rates of 30 Hz. For most experiments we measured fluorescence changes of bis-fura-2 and furaptra with single wavelength excitation (382 ± 10 nm) and emission ≥ 455 nm. For experiments with caged IP3 (see below) we used the low-affinity indicator Oregon Green Bapta-5N with excitation at 494 ± 10 nm and emission at 536 ± 20 nm. [Ca2+]i changes are expressed as ΔF/F where F is the fluorescence intensity when the cell is at rest and ΔF is the change in fluorescence during activity. Corrections were made for indicator bleaching during trials by subtracting the signal measured under the same conditions when the cell was not stimulated. We did not correct for tissue autofluorescence.
To examine the spatial distribution of postsynaptic [Ca2+]i changes we selected pyramidal neurons that were in the plane of the slice and close to the surface. In these neurons, we could examine [Ca2+]i increases over a range of 230 μm with the camera and the lens selected for these experiments. Increases in different parts of the cell are displayed using either selected regions of interest (ROIs) or a pseudo ‘line scan’ display (Nakamura et al. 2000).
Photoactivation of caged IP3
For some experiments we released Ca2+ by uncaging IP3 with a UV flash instead of by synaptic stimulation. Caged IP3 (d-myo-inositol 1,4,5-trisphosphate, p4(5)-1-(2-nitrophenyl)ethyl ester; Walker et al. 1987) was purchased from Calbiochem and was included in the patch pipette at a concentration of 450 μm. Pulsed UV light at ∼365 nm from a light-emitting diode (UVILED, Rapp Optoelectronics) was focused through the objective via either a 1250 μm or 200 μm diameter quartz fibre optic light guide making a spot of about 120 μm or 20 μm in diameter with a ×40 objective lens on the slice. For these experiments Oregon Green Bapta-5N was used as the Ca2+ indicator because the excitation wavelength for this indicator is outside the activation band of caged IP3.
Results
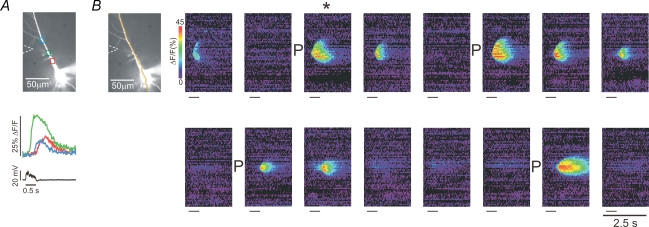
We selected pyramidal neurons that had a stable resting potential more than 10 mV below spike threshold and which generated action potentials with amplitudes greater than 90 mV. The mean membrane potential of the cells used for the experiments was −61.2 ± 4.5 mV (n= 56). The average threshold potential for spike firing was −42.9 ± 5.8 mV. We tetanically stimulated synaptic responses in CA1 pyramidal neurons with a train of 50 pulses evoked at 10 ms intervals. Although Ca2+ release can be evoked with a variety of stimulation protocols (Zhou & Ross, 2001) we standardized with this protocol to allow a systematic examination of other parameters. Cells were required to respond with a Ca2+ release wave using stimulation currents lower than 140 μA; most cells generated release between 30 and 90 μA. In a typical experiment we applied this stimulation at regular intervals interspersed with a priming protocol or no stimulation. Synaptic stimulation current was kept constant for all trials except in certain experiments (see below). Figure 1 shows the result of a typical experiment where the priming protocol was action potentials evoked at 4 Hz by brief (2 ms) intrasomatic depolarizing pulses for the duration of the 2 min intertrial interval. After the first trial, which successfully evoked a Ca2+ release wave, the second tetanus failed to evoke release when there was no priming between trials. However, following priming, the next two trials generated Ca2+ waves before failure. At this point priming again succeeded in putting the cell in a state where release could be evoked for the next three trials.
Figure 1. Priming stores with repetitive action potentials prepares pyramidal neurons to release calcium.
A, typical response of a neuron to tetanic stimulation. The image shows a cell filled with bis-fura-2 with three ROIs indicated. The cell was filled with indicator from the patch pipette on the soma, which also recorded the electrical response. The position of the stimulating electrode is also shown. Following tetanic stimulation (50 pulses at 10 ms intervals; 90 μA current for 100 μs), delayed [Ca2+]i increases were detected at the three locations. This event is the trial indicated with * in the second part of the figure. B, response to the same stimulation protocol at 2 min intervals. The pseudocolour images show a ‘line scan’ along the pixels indicated in the cell image. When Ca2+ release was evoked it occurred earliest at a location in the dendrites and spread as a wave in a restricted region of the cell. At four times during the experiment (indicated by ‘P’ next to the images) action potentials were evoked intrasomatically at 4 Hz for the duration of the 2 min intertrial interval. Following this priming protocol Ca2+ release was strongest. The short lines under each image indicate the time of tetanic stimulation. The 2.5 s scale bar applies to all the images.
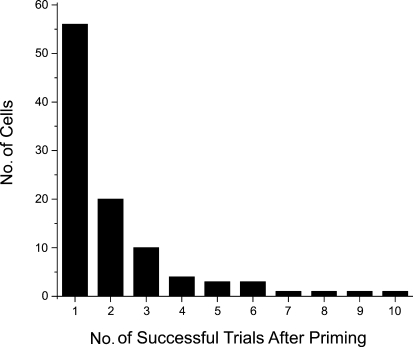
The number of successful trials following priming was variable. Figure 2 shows results from many cells using the priming protocol of 4 Hz for 2 min. In most cases priming only filled the internal stores sufficiently to release Ca2+ one time although there were a number of cells where release could be evoked successfully two or three times without the need to refill the stores.
Figure 2. Priming is usually effective for only a few trials.
Following a single episode of priming we recorded the number of trials when Ca2+ release was detected at near threshold stimulation using tetanic stimulation at 100 Hz for 0.5 s. In most cases successful release was only detected for one or two trials. However, there were a few cells where release was detected for many trials without further priming.
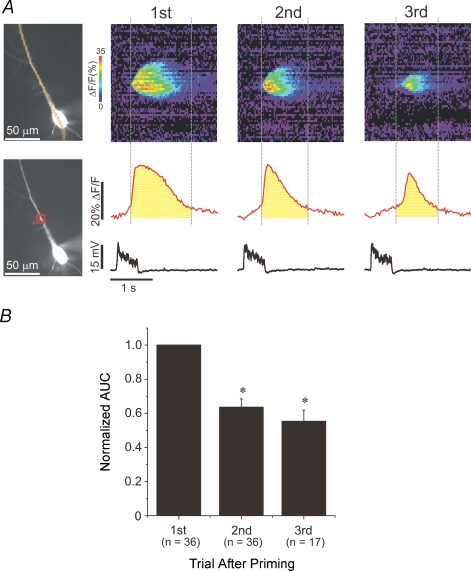
Figure 3A shows an example where release occurred in multiple trials following a single episode of priming. The amplitude of the release event decreased with successive trials. This result parallels our previous observation that later release events were less spatially extended than the transient evoked immediately after priming (Watanabe et al. 2006). The amplitude of the [Ca2+]i increase is only an approximate measure of the amount of Ca2+ released since the duration of release is comparable to the recovery time of the transient. Another way of estimating the magnitude of Ca2+ release is to measure the area under the curve (AUC) of the ΔF/F trace at the initiation site of the wave (shaded area in figure). This measure takes into account variations in the duration of the release transient. In addition, it partially compensates for the saturation of the indicator, which often occurs with Ca2+ release transients (Nakamura et al. 2000; Larkum et al. 2003), and which therefore leads to an underestimation of the variation in the amplitude of the [Ca2+]i changes in different trials. We compared the AUC of the first three successive trials following priming to the area of the first trial immediately following priming. We found (Fig. 3B) that at the site of wave initiation the mean AUC of the first trial immediately following priming was significantly greater than the mean AUC of the second and third subsequent trials (F= 34.5, P≤ 0.05; one-way ANOVA and Tukey's multiple means comparison).
Figure 3. The effect of priming declines over successive trials.
A, the fluorescence change of three successive trials following priming in a representative cell. The region used to calculate the area under the curve (AUC) in the red ROI is indicated under each curve. The areas were calculated between the times when the waves began and an estimate of the times when they ended. B, histogram of the AUCs of the first three successive trials following priming for those cells where release occurred for three or more trials. The AUC values of the 2nd and 3rd trials were normalized to the AUC value of the first trial. The values of the AUC of the second and third trials were significantly lower compared to the first trials. (One-way ANOVA, F= 34.5, P≤ 0.05.)
Interestingly, there were a few cells (4 out of 56) where, in the beginning of the experiment, Ca2+ release waves could be evoked in three or more trials without priming. Supplemental Fig. 1A (see online Supplemental material) shows the results from one of these cells (15 s intertrial interval). Release was evoked nine times following the initial store loading. Furthermore, the magnitude and spatial extent of the Ca2+ release wave did not change dramatically during these nine events, suggesting that the store content before stimulation did not change much between trials.
Since most of the multiple successive trials that evoked Ca2+ release occurred in the earlier stages of the experiments, we compared the success rate of release only in unprimed trials (excluding the trial immediately following priming) in the 1st and 2nd halves of the experiments on an individual cell (Supplemental Fig. 1B). We analysed the experiments in this way because each cell varied in the total number of release trials evoked and the duration for which a cell was patched, factors which may contribute to the observed decline with time in the capacity of the cell to release calcium. We found that the success rate of unprimed trials in the 1st half of the trials (59%) was significantly greater than the success rate of unprimed trials in the 2nd half (15%). We do not know the specific reason for this difference, but it probably involves a combination of the adjustment of store content and gradual cell deterioration during the experiment.
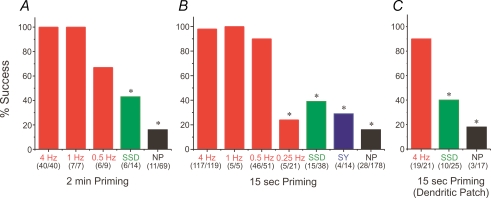
To more precisely determine the conditions for effective AP priming we varied the frequency and intertrial interval in different experiments (Fig. 5 and Supplemental Fig. 2). We found that priming with action potentials was effective using intervals as short as 15 s (Fig. 5B). Spike firing at frequencies of 4 Hz, 1 Hz and 0.5 Hz were all effective using either 2 min or 15 s intertrial intervals (Fig. 5A and B). However, at 0.25 Hz, the success rate plummeted to the success rate of the unprimed trials, suggesting that the effective lower limit of the frequency of action potential priming is somewhere below 0.5 Hz. Similar conclusions followed from an analysis of the AUCs using different priming protocols (Supplemental Fig. 2).
Figure 5. Priming with action potentials is much more effective than other modes of priming, even at low frequencies.
A, B and C: histograms of percentage success of all trials sorted by the various priming protocols applied before evoking release. Trials using regular action potential spiking at different frequencies are in red. Trials using SSD are in green. Trials using synaptic trains of 50 pulses at 100 Hz, delivered repetitively at 0.5 Hz or 1 Hz are in blue (SY). The trials with no priming (NP) before evoking release are in black. The success rates of the different priming protocols were compared using the χ2 test with 1 degree of freedom and statistical significance set at P≤ 0.05; * denotes significant statistical difference compared to action potential priming protocols of 4 Hz, 1 Hz and 0.5 Hz. The number of successful trials over the number of total trials is shown below. A, intertrial interval of 2 min. Priming with APs at 0.5–4 Hz or SSD was significantly more successful than no priming. B, intertrial interval of 15 s. Priming with APs at 0.5–4 Hz was significantly more successful than priming with spikes at 0.25 Hz, SSD, or SY. Priming with APs at 0.25 Hz or SY was not significantly different from NP. C, the cells were patched on the main apical dendrite about 50–70 μm from the soma. Intertrial interval of 15 s. Priming with APs at 4 Hz was effective while priming with SSD was not.
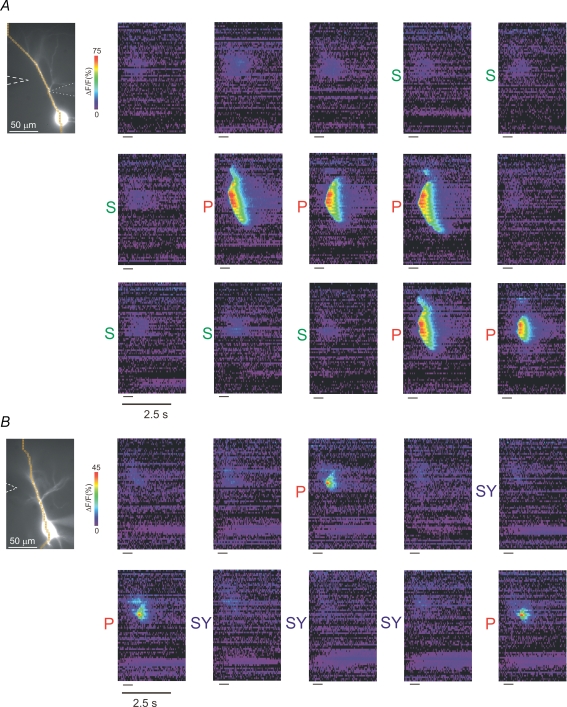
In previous experiments on rat amygdalar projection neurons Power & Sah (2005) found that sustained subthreshold depolarization (SSD) was a more successful priming protocol than action potential (AP) stimulation. Consistent with this result they found that subthreshold depolarization or synaptic stimulation evoked significant [Ca2+]i increases in the somatic and dendritic compartments of these amygdalar neurons, a result they contrasted with the smaller increases previously found in CA1 pyramidal neurons (Magee et al. 1996). When we tested this protocol we found different results in hippocampal CA1 pyramidal neurons; action potentials were much more effective than SSD. Figure 4A shows an experiment where we compared the efficacy of priming with either sustained depolarization or action potentials. The cell was tested every 15 s, during which the cell was either not primed, primed with action potentials (P) or primed with a subthreshold depolarizing pulse (S) sustained throughout the entire intertrial interval. The cell was patched on the main apical dendrite near the site of initiation of the calcium wave because we wanted to leave no doubt that the membrane potential was depolarized to just below the action potential threshold at the location where the Ca2+ release occurred. On average, the membrane potential was depolarized to 2.6 ± 0.6 mV below the spike firing threshold (n= 17). We also note that Golding et al. (2005) showed that the space constant for a steady somatic depolarization is about 240 μm in these cells. Therefore, the membrane voltage at the sites of Ca2+ release (50–100 μm from the soma) should be almost at the same level even when the patch electrode was placed in the soma.
Figure 4. Priming with action potentials is more effective than priming with a sustained depolarizing pulse (SSD) or repetitive subthreshold synaptic stimulation (SY).
A, SSD. The cell on the left was patched on the main apical dendrite about 50 μm from the soma. The pseudocolour images are ‘line scans’ of successive trials with an intertrial interval of 15 s, ordered sequentially. The horizontal line on the lower left of each image represents the tetanic synaptic stimuli (50 pulses at 10 ms intervals, 40 μA). The white dashed arrow on the image indicates the position of the stimulating electrode. The scale bar of 2.5 s applies to all the images. The images preceded by a P represent trials in which the cell was primed with action potentials at 4 Hz during the intertrial interval before the cell was stimulated synaptically. The images preceded by an S represent trials in which the cell was injected with a constant current pulse to bring the membrane potential just below the threshold for spike firing (2 mV below threshold in this example) during the intertrial interval. Successful Ca2+ release occurred in trials primed with action potentials while there were no trials with successful release in trials primed with sustained subthreshold depolarization. B, SY. The images preceded by SY represent trials in which the cell was stimulated synaptically during the 15 s intertrial interval at 0.5 Hz with the same tetanic stimulus train used for evoking release (30 μA) except at a lower current (20 μA), which was below the threshold for spike firing and did not elicit a Ca2+ release wave. Successful Ca2+ release occurred in trials primed with action potentials at 0.5 Hz while there were no trials with successful release in trials primed with repetitive synaptic stimulation.
The summary data for these experiments are shown in Fig. 5 and Supplemental Fig. 2. Priming with sustained subthreshold depolarization was only partially effective in refilling the stores, even though it generated a higher success rate than unprimed trials (NP). The success rate following priming using APs was much higher than other methods of priming in intertrial intervals of either 2 min or 15 s in both somatic and dendritic patch recordings. Not only was the success rate much higher with APs than with SSD, but the average integrated area of the Ca2+ release wave in successful trials was significantly larger compared to the integrated area of the release waves in successful trials that were primed with other methods or without priming (Supplemental Fig. 2).
We also compared the efficacy of priming with repetitive subthreshold synaptic stimulation to the efficacy of priming with action potentials. Figure 4B shows an example of such an experiment. There was no release when the cell was primed with a series of 500 ms 100 Hz tetanic stimulus trains at 0.5 Hz (SY) during the intertrial interval of 15 s as well as in trials with no priming. However, there was prominent release in trials that were primed with action potentials at 0.5 Hz (P). As shown in the summary data in Fig. 5 and Supplemental Fig. 2, the success rate or AUC of SY priming was not significantly higher than NP or SSD priming. In fact, there was no significant difference in the AUC of SSD and SY compared to the AUC in the unprimed condition (NP).
To further quantify the differences among the priming protocols the success rates of the different protocols were multiplied by their respective mean normalized AUC values to yield a weighted measure of the efficacy of the priming protocols (Supplemental Fig. 2). The resulting weighted success rate of trials primed with action potentials was dramatically higher than the weighted success rates of trials primed using SSD or SY.
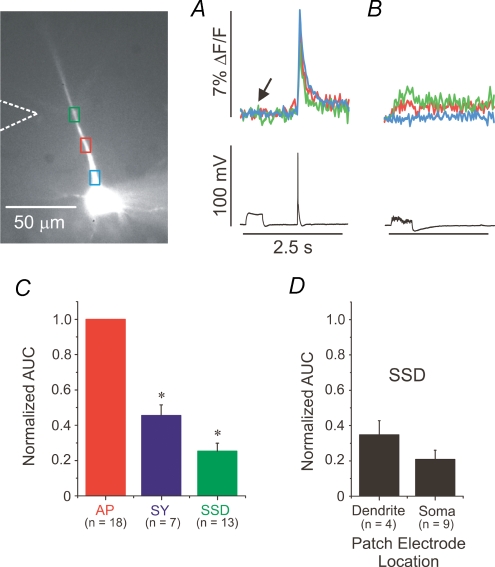
To investigate the basis for the high efficacy of priming with action potentials we compared the AUCs of Ca2+ transients evoked by a single action potential, a 0.5–1 s SSD pulse, and synaptic stimulation for 500 ms at 100 Hz. Figure 6A and B shows an example of such an experiment. In Fig. 6A the small [Ca2+]i change corresponding to a 500 ms subthreshold current injection is indicated by the arrow. In contrast, there is a prominent [Ca2+]i increase in response to the single backpropagating action potential. The [Ca2+]i change resulting from a single synaptic tetanus also was small (Fig. 6B). The [Ca2+]i increase following subthreshold synaptic stimulation is presumably by Ca2+ entry through low-threshold voltage-gated Ca2+ channels (Magee et al. 1996) since the density of spines is low on the main apical dendrite (Megias et al. 2001) and the stimulating electrode was placed near the oblique dendrites. One caution is that the total amount of Ca2+ entering the stores cannot easily be determined from these experiments since Ca2+ both enters the cytoplasm and is pumped out of the cell and into the stores, while the experiment measures the instantaneous [Ca2+]i, not the flux.
Figure 6. The increase in [Ca2+]i resulting from a single action potential is significantly higher than the increase due to either a sustained subthreshold depolarizing pulse or a tetanic synaptic train.
A, [Ca2+]i increase evoked by a 500 ms subthreshold pulse and an AP. Ten trials were averaged. B, [Ca2+]i increases generated by tetanic synaptic stimulation that did not evoke Ca2+ release and which was just subthreshold for generating an action potential. Ten trials were averaged. C, the AUC of the ΔF/F traces (as illustrated in A and B) were compared to the AUC in response to a single AP. The sample sizes are indicated in parentheses below each condition. The AUC of AP was significantly higher than both SSD and SY (*, one-way ANOVA, F= 166, P≤ 0.01, data taken from green ROI, opposite stimulating electrode). The AUC following SY was significantly greater than the AUC following SSD. D, the normalized AUC values of SSD were sorted and compared according to whether the cell was patched on the dendrite or on the soma. The values were not significantly different.
The integrated area of the [Ca2+]i changes following SSD or SY were normalized to the AUC of an AP-evoked Ca2+ transient in each cell and the group means of the AUC values were compared (Fig. 6C and D). The mean AUC of SSD- and SY-primed cells were significantly less than the mean AUC of AP-primed neurons (one-way ANOVA, F= 166, P≤ 0.01). We also confirmed that the AUC from a subthreshold depolarizing pulse in a somatic patch was not different from the AUC evoked with a dendritic patch (Fig. 6D).
Priming following Ca2+ release evoked by uncaging IP3
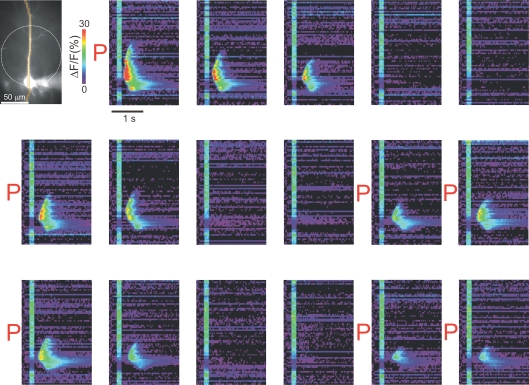
The assumption in these experiments is that priming works by refilling the stores in the ER. However, it is possible that priming works by up-regulating the efficiency of PLCβ as was suggested for Ca2+ release in cerebellar Purkinje neurons (Canepari & Ogden, 2006). To test this possibility we did experiments where Ca2+ waves were evoked by uncaging IP3 instead of by tetanic synaptic stimulation. This protocol bypasses the production of IP3 through the activation of mGluRs and the stimulation of PLCβ. The first panel in Fig. 7 shows that a UV flash over the apical dendrites of a pyramidal neuron loaded with caged IP3 evoked a Ca2+ wave that had a clear initiation site within the flash region. The amplitude and time course of this wave was similar to a synaptically activated wave in the same cell (data not shown). However, repeated UV flashes evoked smaller release waves and soon failed to evoke release. We found that we could restore the ability to generate waves by priming the cell with spikes in the intertrial interval. Priming at 4 Hz for 15 s was clearly successful (n= 43/45 trials), priming at 0.5 Hz for 15 s was usually successful (n= 18/22 trials), and priming at 0.25 Hz for 15 s was not effective (n= 1/6 trials). These are the same requirements that we found for synaptically evoked waves. Therefore, we conclude that priming works downstream from the production of IP3, probably by loading the stores (see Discussion). Power & Sah (2005) used a similar technique to arrive at the same conclusion in their experiments with SSD priming in amygdalar pyramidal neurons.
Figure 7. Priming is necessary to evoke repetitive Ca2+ release waves following the uncaging of IP3.
The first panel shows the image of the cell filled with 300 μm Oregon Green Bapta-5N and 450 μm caged IP3. The dotted circle is the approximate region of the uncaging UV flash. The next sequence of panels shows the responses in successive trials to the same 150 ms flash (vertical bars in panels). Ca2+ waves were evoked for several trials after priming at 4 Hz for 15 s but later trials showed no response without priming. Priming with the same protocol restored the response to the uncaging flash.
Duration of priming
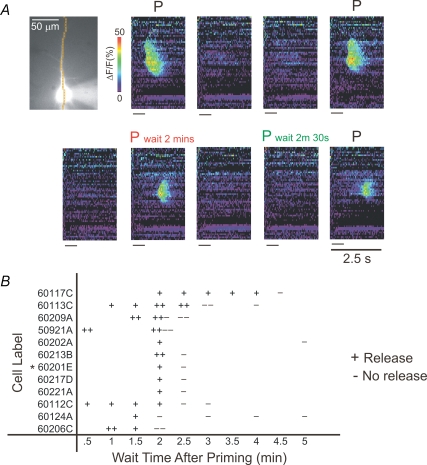
In another series of experiments we examined the time it takes for the effect of a single episode of priming to dissipate. After establishing conditions for consistent release after priming, we waited for a variable period of time after priming before trying to evoke release. In each case we bracketed the trial following the test period with trials where we evoked release immediately after priming (no delay) and we required that these bracketing trials successfully evoke release. Figure 8A, for example, shows a cell that produced a release wave when stimulated 2 min after priming, but not 2 min 30 s after priming. Figure 8B shows the summary data from 12 tested cells. Plus (+) indicates success and minus (−) indicates failure at the indicated test delay. Most cells were tested several times. While there was some variability it is apparent that in the majority of cells release events could be evoked up to 2–3 min after priming but not past that time period.
Figure 8. The effect of priming lasts for about 2–3 min.
A, example of a cell in which the effect of priming lasted for 2 min. Ca2+ release was synaptically evoked with stimulation of 35 μA current (50 pulses at 10 ms intervals) without priming (no label above the pseudocolour image), immediately after priming for 15 s at 4 Hz (black P), waiting 2 min after priming for 15 s at 4 Hz (red P), or waiting 2 min 30 s after priming for 15 s at 4 Hz (green P). Release was present when the cell was stimulated 2 min after priming but absent when stimulated 2 min 30 s after priming. The absence of release was not a result of a rundown of the cell because in the subsequent trial release was again detected when stimulated immediately after priming. B, scatter plot of the results of all release trials in individual cells tested with different delays following priming. ‘+’ represents a successful release trial and ‘−’ represents a failure. The * is next to the cell shown in A. The majority of +'s lie to the left of the 3 min mark.
These data show the results for the best cells, where internal controls showed that the cells responded consistently throughout the duration of the experiment. In some cells (n= 4; data not shown), the effective time period of priming could not clearly be determined due to the steady decline of the capability of the cell to release Ca2+ following synaptic stimulation. In these cells the effective time period of priming was variable over the course of the experiment, usually becoming shorter towards the end of the experiment. These data were not included in the final analysis.
We note that these results apply for the particular priming conditions of this experiment, i.e. 0.5–4 Hz for 15 s. It is possible that more intense action potential priming or priming by a different method (e.g. high K+ solution for a brief period) would be effective for longer periods. Approximately the same duration was found in prefrontal cortical pyramidal neurons (Hagenston et al. 2007) using a different priming protocol and a different assay for release.
Other stimulation protocols
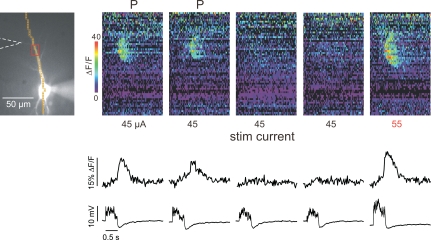
In the above experiments the stimulation intensity or the UV flash duration was held constant for all the trials on an individual cell. The only parameters that were varied were whether or not priming preceded a trial and the rate and the duration of spike firing in the priming protocol. For some experiments we tested whether this was the only critical parameter determining whether Ca2+ release would occur. Figure 9 shows an experiment where, instead of priming the cell to recover release we increased the stimulation intensity. In this cell (and four others) we found that increasing the current by 10–20 μA also was effective in generating Ca2+ release. Presumably, the extra IP3 in the dendritic region generated by the additional active presynaptic fibres overcame the low store Ca2+ level in determining the release threshold. This result is reminiscent of previous results (Nakamura et al. 1999), where we showed that voltage-dependent Ca2+ entry could affect the Ca2+ release threshold when stimulation intensity was held constant. Thus, the extent to which Ca2+ stores are filled is not the only important parameter in the generation of a successful Ca2+ release wave. However, a detailed investigation of other such parameters is beyond the scope of the experiments presented here.
Figure 9. Increasing stimulation intensity can substitute for priming in increasing the likelihood of synaptically evoking Ca2+ release.
Five trials are shown. The cell was primed with action potentials at 0.5 Hz for 15 s before each of the first two trials (indicated with a ‘P’ above the pseudocolour images). Synaptic stimulation with 45 μA current (50 pulses at 10 ms intervals) generated Ca2+ release in the dendrites as shown in the first two pseudocolour images and the optical trace below. No priming was used before each of the next two trials and no Ca2+ release was detected following the same stimulation protocol. However, when the stimulation current was raised to 55 μA (last panel) strong Ca2+ release was evoked.
Discussion
The main result of these experiments is that a low rate of action potential generation (as low as 0.5 Hz) for a short time (15 s) is sufficient to maintain pyramidal neurons in a primed state capable of repetitive Ca2+ release following constant levels of synaptic stimulation. Since a single action potential evokes a [Ca2+]i increase of about 0.3 μm that lasts about 50 ms in the primary apical dendrites (Helmchen et al. 1996), while a Ca2+ release wave evokes a [Ca2+]i increase more than 20 times as large that lasts longer than 1 s at that location (Nakamura et al. 2000; Larkum et al. 2003), it is clear that the Ca2+ entry during minimally effective priming is only a small fraction of the Ca2+ released; the stores are primarily replenished by recovering the Ca2+ released. This resembles the situation in cardiac and skeletal muscle (Bers, 2000) although the mechanism of release is different.
An interesting result is that action potentials are much more effective in pyramidal cells at filling stores than sustained subthreshold depolarization either by direct current injection or by synaptic activation. This result is different from that found in amygdalar projection neurons by Power & Sah (2005); they found that subthreshold depolarization was an important priming mechanism in those cells. This observation reinforces the conclusion that cell properties cannot be generalized without caution. In one sense the result was surprising since previous experiments (Magee et al. 1995, 1996) showed that there is measurable Ca2+ entry through voltage-dependent Ca2+ channels at rest and following subthreshold depolarization in hippocampal pyramidal cells. Our results do not contradict this finding. Indeed, Fig. 6 shows that we could detect subthreshold Ca2+ entry in pyramidal neurons. Rather, this Ca2+ entry is much less significant than that following action potential generation and consequently less effective in reloading the internal stores in these neurons.
Mechanism of priming
The simplest explanation for the restorative effect on Ca2+ release capability by priming is that some of the Ca2+ that enters the cell is pumped into the ER and that when the stores are fully loaded it is easier to evoke release. In principle, however, there are other explanations. Ca2+ could affect several enzymes involved in the production of IP3; Ca2+ could directly affect the sensitivity of the IP3 receptor (IP3R) to IP3; Ca2+ could indirectly affect the sensitivity of the IP3R. Our experiments do not completely eliminate these other possibilities, but they make most of them unlikely.
Ca2+ is known to up-regulate PLCβ (e.g. Rhee & Choi, 1992). Therefore, the transient elevation of [Ca2+]i caused by spikes could increase the amount of IP3 generated by synaptic activation of mGluRs. In particular, Canepari & Ogden (2006) suggested that this was the mechanism of priming in Purkinje neurons. However, we found that Ca2+ released by uncaging IP3 required exactly the same level of priming as synaptically activated Ca2+ release (Fig. 7). Therefore, all steps prior to the generation of IP3 are not important components of priming in pyramidal neurons.
Ca2+ is a known cofactor for the activation of the IP3R (Iino, 1990; Bezprozvanny et al. 1991; Finch et al. 1991). Indeed, the synergistic activation of spikes and synaptic stimulation is known to enhance the release of Ca2+ from stores (Nakamura et al. 1999). However, the time window for this synergism is less than 2 s, with spikes required to come after synaptic stimulation (Nakamura et al. 1999), and spike-evoked Ca2+ transients typically last less than 100 ms (Helmchen et al. 1996). In contrast, our experiments show that the effect of priming typically lasts about 2–3 min (Fig. 8). Therefore, priming cannot be due to the direct effect of Ca2+ on the IP3R.
A third possibility is that Ca2+ indirectly up-regulates the sensitivity of the IP3R to IP3 and that this increased sensitivity lasts several minutes. Our experiments do not directly address this possibility. Ca2+-dependent phosphorylation of the IP3R has been studied in many biochemical experiments (Ferris et al. 1991; Nakade et al. 1994; Straub et al. 2004). There are conflicting results as to whether phosphorylation by protein kinases leads to enhanced Ca2+ release in response to stimuli. Furthermore, most experiments used continuous application of drugs instead of synaptic stimulation and used non-neuronal assays for the effect on IP3Rs. Therefore, it is unclear at this time whether this mechanism could contribute to priming.
In addition to these considerations some aspects of the priming process in our experiments remain unclear. We do not know why some few cells show release for many trials without priming (Fig. 2). It is possible that there is a subset of neurons where the refilling of stores is particularly robust and almost all of the calcium released in one trial is pumped back into the stores. Also, in some cases (e.g. Fig. 1B, bottom row) a trial without preceding priming appears to release slightly more calcium than the previous trial. This may reflect normal fluctuations including variations in the synaptic release of glutamate, fluctuations in IP3R sensitivity or possible defects in our assay for the magnitude of calcium release. Further experiments, possibly including direct measurements of [Ca2+]i levels in the stores, may clarify these points.
Physiological significance
The reported spontaneous firing rates in vivo in CA1 pyramidal hippocampal neurons (e.g. Hirase et al. 2001) exceed the lowest rate at which priming was found to be effective in our experiments. Therefore, it is likely that in most situations the endoplasmic reticulum in pyramidal neurons is in a state ready to release Ca2+ if an appropriate stimulus is received by the cell. This conclusion may not apply to all regions of the CNS. Although we found similar synaptically induced Ca2+ release waves in pyramidal neurons from the neocortex (Larkum et al. 2003) recent studies suggest that spontaneous cortical neuron firing rates may be lower than previously thought (as low as 0.15 Hz; Margrie et al. 2002) and may not be sufficient to maintain these cells in a primed state in all conditions. Related to this issue is our observation that a single episode of priming lasts about 2–3 min. This suggests that the state of store filling is modulated by the ongoing firing rate of the neuron with a filter that has a time constant of several minutes. Another way of looking at this result is to say that the generation of Ca2+ release waves is a plastic synaptic property, modulated by ongoing postsynaptic firing rates. It will be important to test this idea with in vivo experiments.
In these experiments we found a greater dependence on priming to get effective release than we found in some of our previous experiments (Nakamura et al. 1999, 2002). In those experiments we were often able to get Ca2+ release in the same neuron without resorting to a priming protocol between trials, while, as shown in Fig. 2, Ca2+ release could only be evoked a few times without priming in these experiments. There are several reasons for this difference. First, in the previous experiments we did not make a consistent effort to prevent spike firing during the tetanic stimulation that evoked Ca2+ release. In these new experiments we always held the cells at a potential where the synaptic response did not evoke spikes. Presumably, the few spikes generated in those early experiments helped to supply enough Ca2+ to reload the stores to a threshold level to support regenerative Ca2+ release. Second, the duration of the previous experiments was shorter than in the experiments presented here. Since release becomes harder to evoke without priming as the experiment is prolonged, the reliance on priming to evoke release was not so obvious in those experiments. Third, in the older experiments we would often increase the stimulation intensity to evoke release if the previous trial was not successful, while in these new experiments we maintained the stimulation intensity at a constant level. As shown in Fig. 9, increasing the stimulation intensity can often substitute for priming in promoting release. Presumably, the level of Ca2+ in the internal stores is not the only parameter determining whether stimulation will evoke regenerative release. Increasing the amount of IP3 in a region of the dendrites also contributes. How the level of IP3, the [Ca2+] in the internal stores, the amount of voltage-dependent Ca2+ entry, and possibly other parameters, all combine to determine the release threshold needs to be investigated in greater detail.
Acknowledgments
This work was supported in part by NIH Grant NS16295. We thank Dr Fidel Santamaria for his advice regarding some technical aspects of the uncaging experiments.
Supplementary material
Online supplemental material for this paper can be accessed at:
http://jp.physoc.org/cgi/content/full/jphysiol.2007.137661/DC1 and http://www.blackwell-synergy.com/doi/suppl/10.1113/jphysiol. 2007.137661
References
- Bers DM. Calcium fluxes involved in control of cardiac myocyte contraction. Circ Res. 2000;87:275–281. doi: 10.1161/01.res.87.4.275. [DOI] [PubMed] [Google Scholar]
- Bezprozvanny I, Watras J, Ehrlich BE. Bell-shaped calcium response curves of Ins(1,4,5)P3- and calcium-gated channels from endoplasmic reticulum of cerebellum. Nature. 1991;351:751–754. doi: 10.1038/351751a0. [DOI] [PubMed] [Google Scholar]
- Canepari M, Ogden D. Kinetic, pharmacological and activity-dependent separation of two Ca2+ signalling pathways mediated by type 1 metabotropic glutamate receptors in rat Purkinje neurons. J Physiol. 2006;573:65–82. doi: 10.1113/jphysiol.2005.103770. [DOI] [PMC free article] [PubMed] [Google Scholar]
- Ferris CD, Cameron AM, Bredt DS, Huganir RL, Snyder SH. Inositol 1,4,5-trisphosphate receptor is phosphorylated by cyclic AMP-dependent protein kinase at serines 1755 and 1589. Biochem Biophys Res Commun. 1991;175:192–198. doi: 10.1016/s0006-291x(05)81219-7. [DOI] [PubMed] [Google Scholar]
- Finch EA, Augustine GJ. Local calcium signaling by inositol-1,4,5-trisphosphate in Purkinje cell dendrites. Nature. 1998;396:753–756. doi: 10.1038/25541. [DOI] [PubMed] [Google Scholar]
- Finch EA, Turner TJ, Goldin SM. Calcium as a coagonist of inositol 1,4,5-trisphosphate-induced calcium release. Science. 1991;252:443–446. doi: 10.1126/science.2017683. [DOI] [PubMed] [Google Scholar]
- Fiorillo CD, Williams JT. Glutamate mediates an inhibitory postsynaptic potential in dopamine neurons. Nature. 1998;394:78–82. doi: 10.1038/27919. [DOI] [PubMed] [Google Scholar]
- Garaschuk O, Yaari Y, Konnerth A. Release and sequestration of calcium by ryanodine-sensitive stores in rat hippocampal neurones. J Physiol. 1997;502:13–30. doi: 10.1111/j.1469-7793.1997.013bl.x. [DOI] [PMC free article] [PubMed] [Google Scholar]
- Golding NL, Mickus TJ, Katz Y, Kath WL, Spruston N. Factors mediating powerful voltage attenuation along CA1 pyramidal neuron dendrites. J Physiol. 2005;568:69–82. doi: 10.1113/jphysiol.2005.086793. [DOI] [PMC free article] [PubMed] [Google Scholar]
- Hagenston AM, Fitzpatrick JS, Yeckel MF. Cereb Cortex. 2007. MGluR-mediated calcium waves that invade the soma regulate firing in layer V medial prefrontal cortical pyramidal neurons. (in press); DOI: 10.1093/cercor/bhm075. [DOI] [PMC free article] [PubMed] [Google Scholar]
- Helmchen F, Imoto K, Sakmann B. Ca2+ buffering and action potential-evoked Ca2+ signaling in dendrites of pyramidal neurons. Biophys J. 1996;70:1069–1081. doi: 10.1016/S0006-3495(96)79653-4. [DOI] [PMC free article] [PubMed] [Google Scholar]
- Hirase H, Leinekugel X, Czurko A, Csicsvari J, Buzsaki G. Firing rates of hippocampal neurons are preserved during subsequent sleep episodes and modified by novel awake experience. Proc Natl Acad Sci U S A. 2001;98:9386–9390. doi: 10.1073/pnas.161274398. [DOI] [PMC free article] [PubMed] [Google Scholar]
- Iino M. Biphasic Ca2+ dependence of inositol 1,4,5-trisphosphate Ca release in smooth muscle cells of the guinea pig taenia caeci. J Gen Physiol. 1990;95:1103–1122. doi: 10.1085/jgp.95.6.1103. [DOI] [PMC free article] [PubMed] [Google Scholar]
- Jaffe DB, Brown TH. Metabotropic glutamate receptor activation induces calcium waves within hippocampal dendrites. J Neurophysiol. 1994;72:471–474. doi: 10.1152/jn.1994.72.1.471. [DOI] [PubMed] [Google Scholar]
- Larkum ME, Watanabe S, Nakamura T, Lasser-Ross N, Ross WN. Synaptically activated Ca2+ waves in layer 2/3 and layer 5 rat neocortical pyramidal neurons. J Physiol. 2003;549:471–488. doi: 10.1113/jphysiol.2002.037614. [DOI] [PMC free article] [PubMed] [Google Scholar]
- Lasser-Ross N, Miyakawa H, Lev-Ram V, Young SR, Ross WN. High time resolution fluorescence imaging with a CCD camera. J Neurosci Methods. 1991;36:253–261. doi: 10.1016/0165-0270(91)90051-z. [DOI] [PubMed] [Google Scholar]
- Magee JC, Avery RB, Christie BR, Johnston D. Dihydropyridine-sensitive, voltage-gated Ca2+ channels contribute to the resting intracellular Ca2+ concentration of hippocampal CA1 pyramidal neurons. J Neurophysiol. 1996;76:3460–3470. doi: 10.1152/jn.1996.76.5.3460. [DOI] [PubMed] [Google Scholar]
- Magee JC, Christofi G, Miyakawa H, Christie B, Lasser-Ross N, Johnston D. Subthreshold synaptic activation of voltage-gated Ca2+ channels mediates a localized Ca2+ influx into the dendrites of hippocampal pyramidal neurons. J Neurophysiol. 1995;74:1335–1342. doi: 10.1152/jn.1995.74.3.1335. [DOI] [PubMed] [Google Scholar]
- Margrie TW, Brecht M, Sakmann B. In vivo, low-resistance, whole-cell recordings from neurons in the anaesthetized and awake mammalian brain. Pflugers Arch. 2002;444:491–498. doi: 10.1007/s00424-002-0831-z. [DOI] [PubMed] [Google Scholar]
- Megias M, Emri Z, Freund TF, Gulyas AI. Total number and distribution of inhibitory and excitatory synapses on hippocampal CA1 pyramidal cells. Neuroscience. 2001;102:527–540. doi: 10.1016/s0306-4522(00)00496-6. [DOI] [PubMed] [Google Scholar]
- Misquitta CM, Mack DP, Grover AK. Sarco/endoplasmic reticulum Ca2+ (SERCA)-pumps: link to heart beats and calcium waves. Cell Calcium. 1999;25:277–290. doi: 10.1054/ceca.1999.0032. [DOI] [PubMed] [Google Scholar]
- Morikawa H, Khodakhah K, Williams JT. Two intracellular pathways mediate metabotropic glutamate receptor-induced Ca2+ mobilization in dopamine neurons. J Neurosci. 2003;23:149–157. doi: 10.1523/JNEUROSCI.23-01-00149.2003. [DOI] [PMC free article] [PubMed] [Google Scholar]
- Nakade S, Rhee SK, Hamanaka H, Mikoshiba K. Cyclic AMP-dependent phosphorylation of an immunoaffinity-purified homotetrameric inositol 1,4,5-trisphosphate receptor (type I) increases Ca2+ flux in reconstituted vesicles. J Biol Chem. 1994;269:6735–6742. [PubMed] [Google Scholar]
- Nakamura T, Barbara JG, Nakamura K, Ross WN. Synergistic release of Ca2+ from IP3-sensitive stores evoked by synaptic activation of mGluRs paired with backpropagating action potentials. Neuron. 1999;24:727–737. doi: 10.1016/s0896-6273(00)81125-3. [DOI] [PubMed] [Google Scholar]
- Nakamura T, Lasser-Ross N, Nakamura K, Ross WN. Spatial segregation and interaction of calcium signalling mechanisms in rat hippocampal CA1 pyramidal neurons. J Physiol. 2002;543:465–480. doi: 10.1113/jphysiol.2002.020362. [DOI] [PMC free article] [PubMed] [Google Scholar]
- Nakamura T, Nakamura K, Lasser-Ross N, Barbara JG, Sandler VM, Ross WN. Inositol 1,4,5-trisphosphate (IP3)-mediated Ca2+ release evoked by metabotropic agonists and backpropagating action potentials in hippocampal CA1 pyramidal neurons. J Neurosci. 2000;20:8365–8376. doi: 10.1523/JNEUROSCI.20-22-08365.2000. [DOI] [PMC free article] [PubMed] [Google Scholar]
- Parekh AB. Store-operated Ca2+ entry: dynamic interplay between endoplasmic reticulum, mitochondria and plasma membrane. J Physiol. 2003;547:333–348. doi: 10.1113/jphysiol.2002.034140. [DOI] [PMC free article] [PubMed] [Google Scholar]
- Power JM, Sah P. Nuclear calcium signaling evoked by cholinergic stimulation in hippocampal CA1 pyramidal neurons. J Neurosci. 2002;22:3454–3462. doi: 10.1523/JNEUROSCI.22-09-03454.2002. [DOI] [PMC free article] [PubMed] [Google Scholar]
- Power JM, Sah P. Intracellular calcium store filling by an L-type calcium current in the basolateral amygdala at subthreshold membrane potentials. J Physiol. 2005;562:439–453. doi: 10.1113/jphysiol.2004.076711. [DOI] [PMC free article] [PubMed] [Google Scholar]
- Power JM, Sah P. Distribution of IP3-mediated calcium responses and their role in nuclear signalling in rat basolateral amygdala neurons. J Physiol. 2007;580:835–857. doi: 10.1113/jphysiol.2006.125062. [DOI] [PMC free article] [PubMed] [Google Scholar]
- Pozzo-Miller LD, Petrozzino JJ, Golarai G, Connor JA. Ca2+ release from internal stores induced by afferent stimulation of CA3 pyramidal neurons in hippocampal slices. J Neurophysiol. 1996;76:554–562. doi: 10.1152/jn.1996.76.1.554. [DOI] [PubMed] [Google Scholar]
- Putney JW., Jr Capacitative calcium entry: sensing the calcium stores. J Cell Biol. 2005;169:381–382. doi: 10.1083/jcb.200503161. [DOI] [PMC free article] [PubMed] [Google Scholar]
- Rhee SG, Choi KD. Regulation of inositol phospholipid-specific phospholipase C isozymes. J Biol Chem. 1992;267:12393–12396. [PubMed] [Google Scholar]
- Roos J, DiGregorio PJ, Yeromin AV, Ohlsen K, Lioudyno M, Zhang S, Safrina O, Kozak JA, Wagner SL, Cahalan MD, Velicelebi G, Stauderman KA. STIM1, an essential and conserved component of store-operated calcium channel function. J Cell Biol. 2005;169:435–445. doi: 10.1083/jcb.200502019. [DOI] [PMC free article] [PubMed] [Google Scholar]
- Sakmann B, Stuart G. Patch-pipette recordings from the soma, dendrites, and axon of neurons in brain slices. In: Neher E, Sakmann B, editors. Single Channel Recording. 2. New York: Plenum Press; 1995. pp. 199–211. [Google Scholar]
- Straub SV, Wagner LE, 2nd, Bruce JI, Yule DI. Modulation of cytosolic calcium signaling by protein kinase A-mediated phosphorylation of inositol 1,4,5-trisphosphate receptors. Biol Res. 2004;37:593–602. doi: 10.4067/s0716-97602004000400013. [DOI] [PubMed] [Google Scholar]
- Stutzmann GE, LaFerla FM, Parker I. Ca2+ signaling in mouse cortical neurons studied by two-photon imaging and photoreleased inositol trisphosphate. J Neurosci. 2003;23:758–765. doi: 10.1523/JNEUROSCI.23-03-00758.2003. [DOI] [PMC free article] [PubMed] [Google Scholar]
- Walker JW, Somlyo AV, Goldman YE, Somlyo AP, Trentham DR. Kinetics of smooth and skeletal muscle activation by laser pulse photolysis of caged inositol 1,4,5-trisphosphate. Nature. 1987;327:249–252. doi: 10.1038/327249a0. [DOI] [PubMed] [Google Scholar]
- Watanabe S, Hong M, Lasser-Ross N, Ross WN. Modulation of calcium wave propagation in the dendrites and to the soma of hippocampal pyramidal neurons. J Physiol. 2006;575:455–468. doi: 10.1113/jphysiol.2006.114231. [DOI] [PMC free article] [PubMed] [Google Scholar]
- Yeckel MF, Kapur A, Johnston D. Multiple forms of LTP in hippocampal CA3 neurons use a common postsynaptic mechanism. Nat Neurosci. 1999;2:625–633. doi: 10.1038/10180. [DOI] [PMC free article] [PubMed] [Google Scholar]
- Zhou S, Ross WN. Threshold conditions for synaptically activating Ca2+ waves in hippocampal pyramidal neurons. J Neurophysiol. 2001;87:1799–1804. doi: 10.1152/jn.00601.2001. [DOI] [PubMed] [Google Scholar]
Associated Data
This section collects any data citations, data availability statements, or supplementary materials included in this article.


