

Abstract
Using an improved chromatin immunoprecipitation assay designed to increase immunoprecipitation efficiency, we investigated changes in RNA polymerase II (Pol II) density and carboxyl-terminal domain (CTD) phosphorylation during transcription of the cyclophilin A (PPIA), glyceraldehyde-3-phosphate dehydrogenase (GAPDH), and several androgen-responsive genes in LNCaP cells. As generally observed in higher eukaryotes, promoter proximal pausing of Pol II appeared to occur on the PPIA and GAPDH genes, but apparently not on the androgen-responsive genes PSA and NKX3-1. Unlike some mammalian studies, we found that the CTD of Pol II in promoter regions contains little phosphorylation at Ser-2 of the heptad repeat, suggesting that Ser-2 phosphorylation is not involved in polymerase exit from the promoter region. In contrast, Pol II near the promoter displayed high levels of Ser-5 phosphorylation, which decreased as polymerase transcribed beyond the promoter region of the PPIA and GAPDH genes. However, total Pol II levels appear to decrease as much or more, suggesting that Ser-5 phosphorylation is maintained. In support of this conclusion, a phosphoserine 5-specific antibody quantitatively immunoprecipitates native hyperphosphorylated Pol II, suggesting that all polymerase with phosphoserine 2 also contains phosphoserine 5. Given reports indicating that phosphoserine 5 is present during elongation in yeast, our data suggest that gross changes in CTD phosphorylation patterns during transcription may be more conserved in yeast and humans than recognized previously.
Phosphorylation of the carboxyl-terminal domain (CTD)1 of the largest subunit of RNA polymerase II (Pol II) plays an important role in regulating transcription and mRNA processing (1–4). In yeast and humans this domain is composed, respectively, of 26 or 52 seven-amino acid repeats with the consensus sequence YSPTSPS. Phosphorylation is predominantly at Ser-2 or Ser-5 of the repeat but also occurs at Tyr-1 and perhaps Ser-7 in mammals (3). In both yeast and humans, 19 consecutive repeats are completely conserved except for 1 of 133 amino acids in each species (5). This level of conservation, at 99.2% identity, rivals the most highly conserved globular proteins such as histones and occurs even though the CTD is sometimes regarded as unstructured (6). Recently, an evolutionary comparison of CTD kinases has suggested that conservation of the CTD was linked to the conservation of the CTD kinases, CDK7 in TFIIH and CDK8 in mediator (7).
A mechanistic role for CTD phosphorylation in transcription and mRNA processing is well established for the addition of the 5′-cap to nascent mRNA. Capping enzymes bind directly to the phospho-CTD and are also allosterically activated by pSer-5 in both yeast (8, 9) and mammals (10, 11). Phosphorylation of the CTD by CDK7, a kinase generally required for transcription (12), may not be uniquely responsible for enabling the capping process (13, 14); however, it is present at the promoter, processively phosphorylates the CTD after initiation (15–17), introduces pSer-5 as found in abundance near the promoter (5, 17–20), and is the only CTD kinase shown genetically to interact with capping enzymes in yeast (18, 21).
Although Ser-5 phosphorylation clearly plays an important role in 5′-capping, the role of CTD phosphorylation in the transition of polymerase into productive mRNA synthesis is less clear. In yeast, a role for pSer-5 and capping in the entry of Pol II into productive elongation is implied by one study that showed that specific inhibition of CDK7 and CDK8 can reduce transcription (14). In mammals and Drosophila, 5′-capping may be connected to the phenomena of promoter proximal pausing of Pol II because these events occur at similar positions, 20–75 bp from the transcription initiation site (22). Further, Pol II transcripts at pause locations closer to the transcription initiation site appear to be less capped than transcripts at pause locations slightly downstream (23). Two complexes, DSIF and NELF, have been implicated in promoter proximal pausing. If these complexes are central, pausing may be relieved by phosphorylation of Ser-2 by CDK9 (kinase subunit of P-TEFb) (24–26). Capping enzyme itself could also inhibit transcription and lead to pausing (27), but confusingly, active and inactive capping enzyme can displace NELF and increase transcription (28).
Although the processes necessary for exit from the promoter region are not well established, it has been known for some time that Pol II engaged in productive elongation of mRNA is generally hyperphosphorylated on the CTD (29–31). More recently, the elongation-competent hyperphosphorylated state has been shown to include pSer-2 (19, 20), although pSer-5 is also likely to be present in both yeast (32) and mammals (20, 33). An increasing body of evidence suggests that CTD phosphorylation is directly linked to numerous events during mRNA synthesis, including splicing (34, 35), 3′-end formation (36), histone modification (37–39), and DNA modification (40). Putative kinase orthologs, CTK1 in yeast and CDK9 in multicellular eukaryotes, are strongly implicated in the phosphorylation of elongating polymerases. Deletion of CTK1 (41) or inhibition of CDK9 (42) results in decreased pSer-2 but not pSer-5 levels on the CTD of elongating polymerase and causes defects in 3′-end formation. Although evidence from yeast suggests that pSer-2 is introduced only after Pol II has left the promoter region, data in human cells are more limited and controversial with studies showing that pSer-2 may or may not be present near gene promoters (20, 43).
Using a simple whole cell ChIP procedure with increased immunoprecipitation (IP) efficiency, we have analyzed CTD phosphorylation patterns during transcription in prostate-derived LNCaP cells. On most genes, Pol II near promoters contained high levels of pSer-5 and very little pSer-2, whereas elongating polymerases appeared to be phosphorylated at both Ser-2 and Ser-5. This pattern of phosphorylation is similar to that observed in yeast. Despite this similarity, some mammalian genes display obvious promoter proximal pausing, a behavior yet to be observed in yeast (22). Although the housekeeping genes cyclophilin A (PPIA) and GAPDH both appear to display promoter proximal pausing, we found that the androgen-inducible genes NKX3-1 and possibly PSA did not. The presence or absence of pausing on these mammalian genes provides additional evidence of distinct transcriptional states as suggested by prior work in Drosophila (30, 31).
EXPERIMENTAL PROCEDURES
Materials
RPMI 1640 medium and penicillin/streptomycin (15140-122) were from Invitrogen, and heat-inactivated fetal calf serum (SH30071.03) was from Hyclone. PMSF, NaF, sodium orthovanadate (Na3VO4, S-6508), sodium deoxycholate (D-6750), glycogen (G-8751), bovine serum albumin (A-2153), and formaldehyde (F1268) were from Sigma. Protein G-agarose (1 719 416), Complete protease inhibitor tablets (1 836 145), proteinase K (3 115 879), Nonidet P-40 (1 754 599), and anti-mouse IgM-horseradish peroxidase conjugate (605 22) were from Roche Applied Science. Dry milk (170-6404) and polyvinylidene difluoride (162-0177) were from Bio-Rad. Herring sperm DNA (D181B) was from Promega. Goat IgG anti-mouse IgM (M-8644) was from Sigma. 8WG16, H5, and H14 were from BabCO. Pol II N20 (sc-899), A10 (sc-17798), and H224 (sc-9001) were from Santa Cruz Biotechnology.
Preparation of Partially Purified Mammalian RNA Pol II from Heart
A liquid nitrogen-frozen heart from a female Sprague-Dawley rat and 10 ml of frozen solubilization buffer (50 mM Tris, pH 7.5, at 25 °C, 150 mM NaCl, 1% Nonidet P-40, 0.5% sodium deoxycholate, phosphatase inhibitors (1 mM Na3VO4, 10 mM Na4P2O2, and 10 mM NaF), and 1 × Complete protease inhibitor mixture (PIC)) were placed into an industrial Waring blender and ground at high speed for a total of 2 min with liquid nitrogen present. The frozen dust was put in a small beaker until thawing had begun, and an additional 10 ml of room temperature lysis buffer was added followed by incubation in 25 °C water to thaw the entire sample quickly. The sample was spun at 25,000 × g for 5 min at 5 °C, and 10 ml of the supernatant was immediately loaded onto a 100-ml Sephacryl S-500 (Amersham Biosciences) column preequilibrated with solubilization buffer. The column was run rapidly (~1 h at 5 °C), and each 10-ml fraction was aliquoted, frozen in liquid nitrogen, and stored at −80 °C. Hyperphosphorylated RNA Pol II was almost entirely in elution fraction 8 counting load as fraction 1.
Preparation of Antibody Beads
Protein G-agarose was bound to IgG antibodies by incubation of each antibody with a 5% matrix slurry for 1 h at 25 °C with rotation in IP dilution buffer (10 mM Tris, pH 7.5, at 25 °C, 1% Nonidet P-40, 0.5% sodium deoxycholate, 150 mM NaCl, protease inhibitors (1 mM PMSF and 1 × Complete PIC), phosphatase inhibitors (1 mM Na3VO4, 10 mM Na4P2O7, and 10 mM NaF)). Buffers with protease inhibitor mixture were assumed to be stable and stored for 36 h at 4 °C (Roche product information); however, in all cases PMSF was added from a 200 mM stock in absolute ethanol within 1 h of solution use. For each 10 μl of matrix the amount of antibody loaded was 10 μg of goat anti-mouse, 5 μg of Pol II N20, 5 μg of Pol II A-10, and 12.5 μl of 8WG16 (raw ascites fluid). After adsorption, beads were pelleted at 500 × g for 1 min and washed with 1 ml of IP dilution buffer. The mouse IgM antibodies, H5 and H14 (12.5 μl of raw ascites fluid) were loaded similarly onto 10 μl of preloaded goat anti-mouse IgM/protein G-agarose. Beads were stored overnight at 4 °C in IP dilution buffer or for ChIP in ChIP blocking buffer (IP dilution buffer supplemented with 1 mg/ml bovine serum albumin and 1 mg/ml herring sperm DNA). Except for antibody adsorption all IP steps were carried out at 4 °C.
Immunoprecipitation and Western Blotting of the Largest Subunit of RNA Polymerase II
Beads (10 μl) with Pol II N20, 8WG16, H14, or H5 were combined with 500 μl of partially purified RNA Pol II to which 0, 0.02, or 0.1% SDS had been added and incubated for 2 h with inversion mixing. Beads were pelleted at 500 × g for 1 min, and all but the beads and 15 μl of the supernatant was moved to a new tube, and both samples were frozen in liquid nitrogen. To limit potential CTD dephosphorylation samples were thawed, combined with 2 × SDS sample buffer with 20 mM dithiothreitol, and immediately heated to 95 °C for 5 min. Samples were run on precast 4–15 or 4–20% precast gels and transferred in transfer buffer with 15% methanol onto 0.2 μm of polyvinylidene difluoride using a minitrans-Blot unit (Bio-Rad instructions). Western blots were done at room temperature, and buffers were typical (10 mM Tris, pH 8.0, 150 mM NaCl, 0.1% Tween 20 for washes plus 5% dry milk with antibodies) except for the addition of phosphatase inhibitors (1 mM Na3VO4, 10 mM Na4P2O2, and 10 mM NaF). Primary antibodies were at 1:1,000 dilution, whereas secondary anti-IgM horseradish peroxidase conjugate was at 1:10,000 and was visualized with Super Signal West Dura extended duration substrate (Pierce) and Biomax XR film (Kodak). Blocking, primary antibody, and secondary antibody steps were 1 h. Analysis of cross-linked ChIP extracts and IPs was similar except samples were heated for 20 min at 95 °C in SDS sample buffer to reverse cross-links prior to electrophoresis. Beads were sampled by pipetting 20 μl with a clipped pipette tip missing ~2 mm, following resuspension in wash buffers.
LNCaP Cell Growth and Preparation of ChIP Extracts
5 million LNCaP cells were plated in 15-cm culture dishes and grown for 2 days at 37 °C in 10% fetal calf serum in phenol red-free RPMI 1640 under a 5% CO2 atmosphere. The medium was removed quickly, and the cells were fixed with 1% formaldehyde in phosphate-buffered saline with gentle agitation for 10 min at 25 °C, after which cross-linking was stopped by replacing formaldehyde with 125 mM glycine in phosphate-buffered saline for 5 min at 25 °C. After solution removal, plates were placed on ice, and 2 ml of chilled (2 min on ice) lysis buffer (10 mM Tris, pH 7.5, at 25 °C, 0.5% SDS, protease inhibitors (1 mM PMSF and 5 × Complete PIC), phosphatase inhibitors as above) was added. The cells were rapidly scraped from the plate, and the solution (~2.3 ml) was transferred to a short 5-ml tube in ice water before sonication to an average fragment size of 1100–1300 bp using 12 5-s bursts on a Misonex 3000 with a microtip probe (Farmingdale, NY). After clarification by centrifugation at 10,000 × g for 5 min at 4 °C, supernatants were diluted about 20-fold with 38 ml of IP dilution buffer (10 mM Tris, pH 7.5, at 25 °C, 1% Nonidet P-40, 0.5% sodium deoxycholate, 150 mM NaCl, protease inhibitors (1 mM PMSF and 1 × Complete PIC), phosphatase inhibitors as above). The combined solution approximates ChIP buffer (IP dilution buffer with 0.025% SDS). Subaliquoted samples were frozen in 15-ml conical tubes using liquid nitrogen and stored at −70 °C until use. Each ml of extract represents about 400,000 cells.
Immunoprecipitation and Preparation of ChIP DNA
Prior to use in ChIP, antibody beads were washed for 2–3 h with 1 ml of blocking buffer plus 0.025% SDS followed by one wash with 10 vol of the same buffer. During the bead washing period LNCaP extracts were thawed in a 25 °C bath until melted and precleared for 1 h by incubation with 15 μl of protein G-agarose (preequilibrated for 1 h with blocking buffer plus 0.025% SDS)/ml of extract. Matrix was removed by centrifugation at 10,000 × g for 5 min. Precleared extract (1.5 ml) was added to tubes containing 10 μl of antibody beads and incubated for 2 h at 4 °C with mixing by slow inversion. Subsequently, for the standard ChIP procedure, beads were washed four times with 1 ml of ChIP buffer each time with 5-min inversions and recovery by centrifugation at 500 × g for 1 min. For the preliminary ChIP procedure, beads were washed one time with ChIP buffer, one time with 20 mM Tris, pH 7.5, at 25 °C, 500 mM NaCl, 1% Nonidet P-40, 0.5% deoxycholate, 0.025% SDS, 1× PIC, one time with 10 mM Tris, pH 7.5, at 25 °C, 250 mM LiCl, 1% Nonidet P-40, 0.5% deoxycholate, 1 × PIC, and two times with 1 × TE. In each case, after the last wash, beads were resuspended in 100 μl of ChIP buffer to which was added 2.5 μl of 10% SDS and 5 μl of 10 mg/ml proteinase K. Samples were mixed well and incubated for 2 h at 55 °C and then overnight at 65 °C. Samples were spun and the supernatant collected followed by a second extraction with 100 μl of TE that was combined with first supernatant. After phenol/chloroform/IA and then chloroform extraction, 2 μl of 10 μg/μl glycogen was added and the DNA precipitated with sodium acetate/EtOH. Total DNA was prepared similarly without glycogen. ChIPs were resuspended in water, and total DNA was placed into TE with 20 μg/μl RNase.
Analysis and Quantitation of ChIP DNA by PCR
Primers were designed using the program Oligo (Molecular Biology Insights) to have a melting temperature of about 70 °C and a high PE number (a proprietary measure of primer pair quality). Primers were obtained from Qiagen in an unpurified salt-free state. PCR was performed with platinum Taq as recommended but with 500 nM primer concentrations using a PTC-225 Tetrad DNA engine equipped with four independently controllable 96-well α sample blocks from M. J. Research (Waltham, MA). Reactions were “hot” started by incubation for 1.5 min at 94 °C followed by 35 cycles of 0.5 min at 94 °C, 0.5 min at 60 °C, and 1 min at 72 °C plus a final 10-min extension at 72 °C. After agarose gel electrophoresis in an Owl gel apparatus (model A6) with 25-well combs suited for use with a multichannel pipette, ethidium bromide-stained PCR products were quantitated with ImageQuant (Molecular Dynamics). The arbitrary pixel intensity units of PCR product bands from dilutions of total extract DNA (usually representing 1/4000, 1/20,000, 1/100,000, and 1/500,000 of the single precipitation) generated a nonlinear curve between input DNA and PCR product DNA. Appropriate amounts of ChIP DNA (1/200–1/2000 of a single precipitation) for each antibody were used to generate PCR products for each primer set so that product intensity values were generally within the range of the response curve. The fraction of DNA precipitated was estimated by interpolation between response curve values bracketing the sample signal. Linearity was not required; however, curves were regarded as invalid if the increase between points was not at least 30%. Interpolation beyond the highest curve concentrations was not done if the highest two concentration points differed by less than 50%, and these estimates were never more than 2.5-fold above that top concentration. For primer sequences see Supplemental Table 1.
RESULTS
ChIP has been used to estimate the density of Pol II and the phosphorylation state of the CTD along numerous genes mostly in yeast and Drosophila. In brief, the process involves in vivo formaldehyde cross-linking of the DNA and Pol II (or other proteins), extracting and breaking the DNA into 200–2000-bp fragments, immunoprecipitating the DNA·Pol II complex with antibodies to Pol II, and finally analyzing the amount of DNA precipitated using PCR. The precipitated DNA can also be “quantitated” by comparing the PCR product from immunoprecipitated chromatin with that from total DNA to obtain a relative measure of Pol II density, which depends on both cross-linking and IP efficiencies (44). Studies on the role of changing CTD phosphorylation have focused on highly expressed genes at least in part because most ChIP protocols currently in use are relatively insensitive and require a large number of cells. Given that PCR is exquisitely sensitive, it seemed possible that the lack of sensitivity observed in ChIP was a consequence of poor IP efficiency. For this reason, we initially investigated ways of improving the IP protocol.
Improving Immunoprecipitation Efficiency
Immunoprecipitation of Native RNA Pol II
Four commercially available antibodies, Pol II N20, 8WG16, H14, and H5, are generally used in ChIP to characterize the phosphorylation state of the CTD during transcription. The Pol II N20 antibody is directed against an amino-terminal peptide of the largest subunit of Pol II and provides a measure of total polymerase density. Of the antibodies directed at the CTD, 8WG16 binds the unphosphorylated consensus repeat, YSPTSPS, whereas H14 requires phosphorylation at Ser-5 (32, 45–47). H5 displays a strong preference for repeats phosphorylated at Ser-2 over Ser-5 (32, 45–47) but binds even more tightly to the doubly phosphorylated state (32). Although this lack of specificity might have made this antibody less useful, studies in yeast suggest that pSer-5 alone does not enable H5 binding during ChIPs because promoters bound to Pol II rich in pSer-5 yield very little signal with this antibody (19, 46).
To determine the ability of the commercially available antibodies to precipitate mammalian Pol II under conditions analogous to ChIP, native phosphorylated Pol II was partially purified on a size exclusion column into an SDS-free variation of radioimmunoprecipitation assay buffer (data not shown; see “Experimental Procedures”). To test IP under common ChIP conditions, the extract was brought to 0.1% SDS followed by IP of Pol II using each of the four antibodies stably prebound to protein G-agarose (for details, see “Experimental Procedures”). Precipitates were analyzed by Western blotting using H14 (pSer-5) as the primary antibody (Fig. 1A). Unsurprisingly, the H14 antibody precipitated Pol II with the H14 epitope most effectively, but each of the antibodies precipitated some phosphorylated Pol II (Fig. 1A, compare B lanes). However, when the IP was done in buffer containing only 0.02% instead of 0.1% SDS to test the effect of SDS on precipitation efficiency, precipitation of phospho-Pol II by H14, H5, and 8WG16 appeared to be nearly complete (Fig. 1B). Essentially the same result was observed during precipitations with no SDS (data not shown). Because improvement in precipitation efficiency with reduced SDS was clear, IPs in our ChIP protocol were done in 0.025% SDS. Although not anticipated, the nearly complete precipitation of the H14 epitope (pSer-5) by H5 (pSer-2/5 preference) and 8WG16 (no phospho-Ser required) is in fact consistent with data indicating significant affinity of H5 and 8WG16 for peptides with Ser-5 phosphorylation (32, 46).
Fig. 1. Decreased SDS allows nearly quantitative precipitation of hyperphosphorylated Pol II by antibodies against the CTD.

A, partially purified Pol II was immunoprecipitated in radioimmunoprecipitation assay buffer (0.1% SDS) with the antibodies Pol II N20, 8WG16, H14, and H5 prebound to beads. Western blot of partially purified Pol II (input, 1% of IP) along with supernatants (S, 1% of IP) and beads (B, 17% of IP) was analyzed with H14 (pSer5) as primary antibody. B, as above, except IP with 0.02% SDS. C, IP with 0.1% SDS analyzed by Western blot with H5 (pSer2/5) as primary antibody.
When the immunoprecipitates used above were reanalyzed by Western analysis now using H5 (pSer-2/5) as the primary antibody, both H5 and H14 were found to precipitate phosphorylated Pol II, but 8WG16 did not (Fig. 1C (0.1% SDS) and 0 or 0.02% SDS (data not shown)). This latter fact is consistent with the inability of pSer-2 peptides or phospho-CTDs with mutated Ser-2 to bind 8WG16, data that suggest that the unphosphorylated Ser-2 is required for the 8WG16 epitope. Given several reports that Ser-2 phosphorylation alone does not enable H14 binding (pSer-5) (32, 46, 47), the ability of H14 to precipitate almost all Pol II with pSer-2 implies that some pSer-5 is also present. As an aside, the epitope recognized by H5 (pSer-2/5) appears to need the protection of phosphatase inhibitors during Western analysis if a signal is to be maintained.2
Effect of Formaldehyde Cross-linking and Wash Stringency on Immunoprecipitation Efficiency
Given the efficacy of Pol II precipitation with reduced SDS, we were surprised when Western analysis of IPs done using a preliminary ChIP protocol revealed very little immunoprecipitated Pol II with any of the four antibodies (data not shown). To determine whether this dramatically decreased IP efficiency was caused exclusively by the formaldehyde cross-linking, we tested the effect of formaldehyde cross-linking time on IP efficiency using H14 (pSer-5) because this was the most effective antibody. As demonstrated in Fig. 2A, cross-linking dramatically decreased IP efficiency (compare lane B4 at 0, 5, or 10 min fix). However, even uncross-linked extracts (Fig. 2A, 0 min fix) displayed fairly poor IP efficiency using this preliminary ChIP protocol, which included high salt and LiCl washes (for details, see “Experimental Procedures”). To minimize loss of Pol II during the wash procedure we then choose to wash with minimal stringency (four washes with 100 vol of ChIP buffer) (Fig. 2B). With these wash conditions, we again observed nearly complete precipitation of Pol II containing the H14 epitope in uncross-linked extracts (Fig. 2B, 0 min fix). In contrast, precipitation was still significantly reduced by 5 min of formaldehyde cross-linking (Fig. 2B, 5 min fix) and decreased further with 10 min of cross-linking (Fig. 2B, 10 min fix). Unexpectedly, the minimal stringency wash used in this experiment was adequate to prevent significant background in ChIP (see below) and has been incorporated into our ChIP protocol. Signalling from the heavy chains of the IP antibodies (Fig. 2) results from recognition by the secondary anti-IgM horseradish peroxidase conjugate and provides an internal control on recovery of the IP antibodies.
Fig. 2. The high salt washes and formaldehyde cross-linking that are used in ChIP reduce IP efficiency of hyperphosphorylated Pol II.
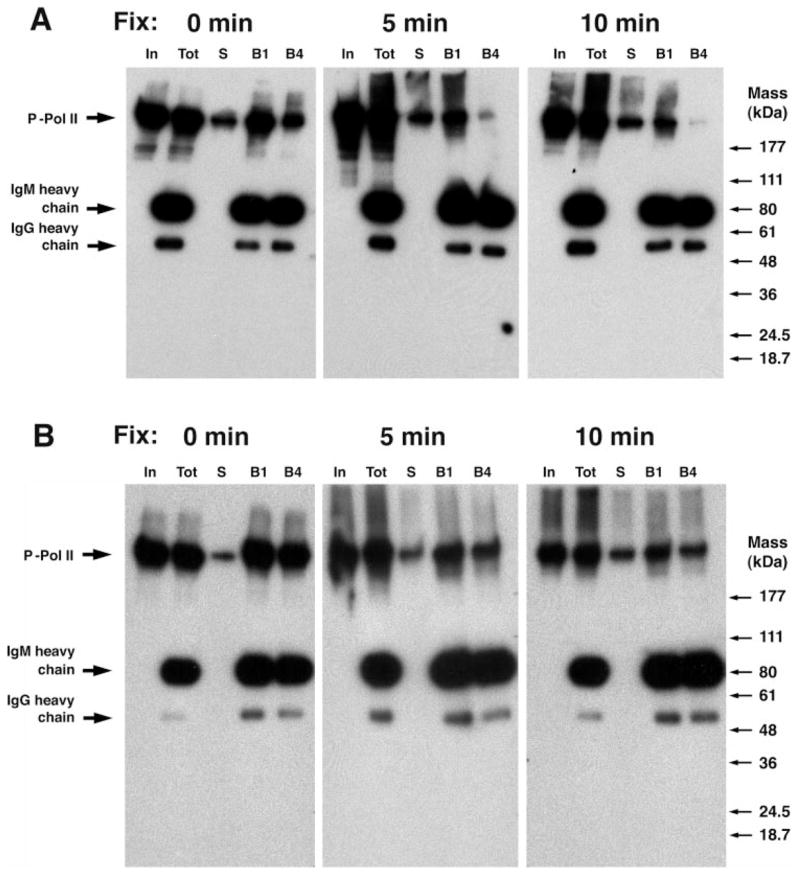
Extracts prepared from LNCaP cells using a whole cell ChIP procedure with 0, 5, or 10 min of formaldehyde cross-linking were immunoprecipitated with H14 prebound to beads and analyzed by Western blot with H14 as primary antibody. A, ChIP with high salt washes. Equal fraction (0.33%) of extract (In), extract + beads (Tot), supernatant (S), beads (1st wash, B1) and beads (4th wash, B4) analyzed by Western blot with H14 (pSer5) as primary antibody. B, ChIP with low stringency washes analyzed with H14 (pSer5) as primary antibody.
Analysis of CTD Phosphorylation Patterns Using ChIP
ChIP Assay
For mammalian cells, most ChIP experiments involving antibodies against the CTD have used a prepurification of the nuclei prior to sonication of the DNA (20, 33, 43, 48). However, Christova and Oelgeschlager (49) successfully used a whole cell extraction procedure to obtain quantitative ChIP data for many proteins involved in transcription, and their protocol has been adapted for use here. Major modifications include the addition of phosphatase inhibitors, use of only 0.025% SDS in IPs, and a less stringent bead washing procedure (for details, see “Experimental Procedures”). Although IP of partially purified Pol II was better with 5 min of cross-linking than 10 min (see Fig. 2), this advantage did not result in an increased signal in ChIP assays, perhaps because increased cross-linking of Pol II to DNA from the longer formaldehyde treatment compensated for lower IP efficiency.3 For this reason ChIP data from extracts cross-linked 5 and 10 min have been combined.
ChIP Analysis of the Highly Expressed Gene for Cyclophilin A
Extracts prepared from LNCaP cells were analyzed to determine the density and phosphorylation pattern of RNA Pol II along the PPIA (cyclophilin A) gene during growth in complete medium. Nine primer pairs across the PPIA gene (Fig. 3A) were used to amplify a dilution series of total DNA from a whole cell extract produced for ChIP (Fig. 3B). Using the same extract, DNA from ChIPs performed with the antibodies 8WG16 (unP), H14 (pSer-5), H5 (pSer-2/5), Pol II N20 (total Pol II), and IgG (nonspecific control) were analyzed concurrently (Fig. 3, C and D).
Fig. 3. ChIP analysis of Pol II phosphorylation during transcription of the PPIA gene.

A, schematic of the PPIA gene (cyclophilin A, NCBI accession number X52851) showing position of PCR products relative to the transcription initiation site (arrow) and the polyadenylation site (pA). B, PCR products for each PPIA primer set from decreasing amounts of the total DNA present in a standard ChIP (fraction indicated at left). Primers for C7, C12, and C8 are directed toward intergenic regions of human chromosomes 7, 12, and 8, respectively. DNA markers are 506/517, 396, 344, 298, and 220 bp. C, PCR products from representative reactions using ChIP DNA immunoprecipitated with 8WG16, H14, H5, and Pol II N20 (fraction of each ChIP indicated). Sporadic bands from IgG control not shown. D, quantitation of the percent of DNA precipitated by 8WG16, H14, H5, Pol II N20 and IgG control beads at each primer location. Data are the mean ± S.E. from four to seven PCRs from three independent ChIP extractions and IPs.
Examination of the qualitative pattern of product formation indicates that the 8WG16 antibody against the unphosphorylated CTD precipitates DNA near the promoter of the PPIA gene (Fig. 3C, 8WG16). It is important to note that unlike Ser-2 phosphorylation, Ser-5 phosphorylation does not block 8WG16 binding (32, 46). Consequently, Pol II precipitated by 8WG16 may contain pSer-5. Indeed, Ser-5 phosphorylation is high in the promoter region, although significant levels are also present across the gene (Fig. 3C, H14). In contrast, the epitope recognized by H5, which prefers repeats with pSer-2 and pSer-2/5, is very low in the promoter region but is maintained at high levels during the process of mRNA elongation (Fig. 3C, H5). Although the experiment in Fig. 3C shows some promoter-associated signal for the H5 (pSer-2/5) precipitation, 14 of 17 PCRs with H5 precipitates gave no product in the promoter region of the PPIA gene. The decreased ability of the 8WG16 antibody to precipitate Pol II downstream from the promoter regions also suggests very high pSer-2 levels. Although not obvious without quantitation, total Pol II density is high near the promoter but lower during the mRNA elongation (Fig. 3C, Pol II N20).
Although the qualitative changes in CTD phosphorylation are reproducible and reveal general polymerase behavior, quantitation of the density of Pol II and Pol II with each CTD phosphorylation state provides additional information. For the ChIP assay used here, averaging multiple estimates of the percentage of DNA precipitated at each PCR product position (for details, see “Experimental Procedures”) provided a reasonably precise estimate of Pol II and each CTD phosphorylation state along the gene (Fig. 3D). Note that the quantitation in Fig. 3D does not directly reflect the appearance of Fig. 3C because each primer pair has its own total DNA curve (Fig. 3B). For example, quantitation with H14 indicates that pSer-5 levels are significantly higher in the promoter region (Fig. 3D, H14) despite the appearance of fairly uniform PCR product generation across the gene (Fig. 3C, H14). From quantitation, it is also apparent that pSer-5 decreases moderately as mRNA synthesis progresses (Fig. 3D, H14). However, total polymerase decreases at least as much (Fig. 3D, Pol II N20), suggesting that pSer-5 levels are maintained or even increased during the elongation process. Unfortunately, the low IP efficiency of the Pol II N20 antibody often resulted in signals that were not significantly higher than nonspecific background values observed with IgG beads (Fig. 3D, Pol II N20). Attempts to use the additional Pol II antibodies (A10 and H-224) to measure total polymerase gave no better results (data not shown). Nevertheless, total Pol II occupancy at these locations must be at least as high as observed for ChIP with the H14 antibody (Fig. 3D) because H14 presumably binds only a portion of the polymerase present on the gene. This example points out that differences in ChIP efficiency among the various Pol II antibodies can reflect differences in IP efficiency. As a second type of negative control, we used three primer pairs located far from transcribed genes on chromosomes 7, 12, and 8, because Pol II should not precipitate DNA associated with these regions (Fig. 3, B–D, right three lanes). Some signal was occasionally observed from these intergenic primer pairs probably representing background. At this level of signal (<0.2%), product bands appeared only sporadically, and quantitative estimates of average product become unreliable.
Analysis of CTD Phosphorylation Patterns along the Highly Expressed Gene for GAPDH
To corroborate the observations made with PPIA, a second high expressing gene, GAPDH, was analyzed by ChIP (Fig. 4). The major characteristics of Pol II density and CTD phosphorylation state were very similar to those observed with PPIA, including unphosphorylated Pol II near the promoter (8WG16), a modest decrease in Ser-5 phosphorylation as transcription proceeds (H14), and minimal binding of H5 (pSer-2/5) near the promoter. Total polymerase density as indicated by the Pol II N20 was observed only near the promoter but at a lower level than for the PPIA gene (0.6 ± 0.2%, n = 4).
Fig. 4. ChIP analysis of Pol II phosphorylation during transcription of the GAPDH gene.

A, schematic of the GAPDH gene (NCBI accession number J04038) showing the position of PCR products relative to the transcription initiation site (arrow) and the polyadenylation site (pA). B, PCR products for each GAPDH primer set from decreasing amounts of the total DNA present in a standard ChIP (fraction indicated at left). * in lane 7 marks an artifactual product. Primers for, C12, C8, and C7 are directed toward intergenic regions of human chromosomes 12, 8, and 7, respectively. C, PCR products from representative reactions using ChIP DNA immunoprecipitated with 8WG16, H14, and H5 (fraction of each ChIP indicated). D, quantitation of the percent of DNA precipitated by 8WG16, H14, and H5 at each primer location. A significant signal from total Pol II (Pol II N20) was limited to the promoter (0.6 ± 0.2%, n = 4). Data are the mean ± S.E. from three PCRs from three independent ChIP extractions and IPs.
Analysis of CTD Phosphorylation Patterns for Genes Responsive to Androgen
For a ChIP protocol to be of use in the study of gene expression cascades such as the androgen activation response, it must be applicable to the genes regulated during the process even at low expression levels. To extend our results, we chose six genes up-regulated by androgen stimulation for analysis: PSA, MAF, ELL2, NKX3-1, FKBP5, and HPGD (50). Under cell culture conditions with 10% fetal bovine serum, these genes should be partially activated by endogenous androgen present in the serum. ChIP analysis of these genes indicates that PSA and NKX3-1 were highly expressed and is presented with parallel analysis of GAPDH and PPIA (Fig. 5). The similarity of gross changes in CTD phosphorylation including unphosphorylated repeats near the promoter, more evenly distributed pSer-5, and elongation-associated pSer-2, is again observed for NKX3-1 and PSA (Fig. 5C). However, quantitation of these values (Fig. 5D) suggests that there are significant differences. For example, although NKX3-1 displays the typical H5 (pSer-2/5) pattern (Fig. 5D, H5), it does not display increased Pol II near the promoter (Fig. 5D, Pol II N20), a finding supported by the even distribution of pSer-5 across the gene (Fig. 5D, H14). Interestingly, of the genes studied only PSA consistently exhibits significant H5 (pSer-2/5) precipitation of the promoter region (n = 4), an outcome that has been observed previously for this gene (51, 52).
Fig. 5. Comparison of CTD phosphorylation during transcription of GAPDH, PPIA, and high expressing androgen-sensitive genes.

A, genes GAPDH, PPIA, NKX3-1 (NK3 transcription factor related, locus 1, NCBI accession number AF055378), and PSA (accession number X14810), showing the positions of PCR products relative to the transcription initiation site (arrow) and the polyadenylation site (pA). B, PCR products for each primer set from decreasing amounts of the total DNA present in a standard ChIP (fraction indicated at left). C, PCR products from representative reactions using ChIP DNA immunoprecipitated with 8WG16, H14, and H5 (fraction of each ChIP indicated). *, unrepresentative; see quantitation. D, quantitation of the percent of DNA precipitated by 8WG16, H14, H5, Pol II N20, and IgG control beads at each primer location. Data are the mean ± S.E. for GAPDH (n = 5–7), PPIA (n = 7–11), NKX3-1 (n = 3–4), and PSA (n = 3–4) from the indicated number of PCRs done on three independent ChIP extractions and IPs.
Of the remaining androgen-sensitive genes, MAF, ELL2, FKBP, and HPGD, all but HPGD (NCBI accession number AF055378) give a clear signal with the H14 antibody, suggesting that pSer-5 is present on Pol II throughout the genes (Fig. 6B). Quantitation of ChIP with the Pol II N20 antibody was unusable; however, quantitative ChIP against unphosphorylated (8WG16) and Ser-2-phosphorylated (H5) repeats again suggest unphosphorylated repeats at the promoter (Fig. 6B, 8WG16) and doubly phosphorylated repeats associated with elongation (Fig. 6B, H5 and H14). These values are too low and standard errors too large for significance to be attached to relative quantitative differences between these lower expressing genes.
Fig. 6. CTD phosphorylation during transcription of low expressing androgen-sensitive genes.

A, genes MAF (musculoaponeurotic fibrosarcoma oncogene homolog (avian), NCBI accession number AF055378), ELL2 (elongation factor 2, NCBI accession number U88629), FKBP5 (FK506-binding protein 5, NCBI reference sequence NM 004117), showing positions of PCR products relative to the transcription initiation site (arrow) and the polyadenylation site (pA). B, quantitation of the percent of DNA precipitated by 8WG16, H14, and H5 at each primer location. Data are the mean ± S.E. for MAF, ELL2, and FKBP5 from three or four PCRs done on three independent ChIP extractions and IPs.
DISCUSSION
Despite the central role that CTD phosphorylation appears to play in the control of transcription and mRNA processing, only one report by Cheng and Sharp (20) in HeLa cells has extensively addressed even the grossest changes in CTD phosphorylation during transcription in mammals. Surprisingly, given the conservation of many mRNA-processing proteins, Pol II and the CTD, they observed quite different mammalian CTD phosphorylation patterns relative to yeast including much higher levels of pSer-2 at the promoter, significant retention of pSer-5 during elongation, and substantial enrichment of Pol II at promoters. Using a quantitative whole cell ChIP assay and prostate-derived LNCaP cells we have produced data that contrast sharply with the first of these findings but are consistent with the last two observations.
The quantitative ChIP assay used in the present studies was redesigned to increase sensitivity, simplify extract preparation, and limit opportunities for CTD dephosphorylation. Use of the whole cell ChIP extract directly addresses each of these goals while reducing the SDS concentration during ChIP, and eliminating the high salt washes greatly increases IP efficiency and therefore assay sensitivity. Most dramatically, elimination of the high salt washes increased the percentage of hyperphosphorylated Pol II retained on precipitating beads with the H5 antibody, to a significant fraction of that present in the total extract. Aside from the intrinsic value of increased sensitivity, higher precipitation efficiency decreases the potential that an uncharacteristic minority of Pol II will dominate ChIP results. Given the increased IP efficiencies, it is not too surprising that ChIP efficiencies near 50% can be obtained for the high expressing genes, GAPDH and PPIA. This level of cross-linking and IP efficiency is certainly possible, as quantitative nuclear run-on data from Drosophila suggest that nearly all GAPDH genes have a paused promoter proximal polymerase (53). In any case, ChIP only detects Pol II cross-linked to the DNA, providing only a relative measure of polymerase density in the absence of data on cross-linking efficiency. Without these data and an independent means of confirming quantitative values, interpretations here have been limited to comparison of relative values for a single antibody and have not attributed significance to absolute numbers. The relatively high IP efficiencies do suggest that poor IP efficiency rather than limited DNA/Pol II cross-linking causes the insensitivity that many studies have found for ChIP with Pol II.
A consistent aspect of our data is the relative absence of pSer-2 at the promoters of most genes as demonstrated by the inability of H5 (pSer-2/5) to precipitate promoter DNA. This behavior has been observed in yeast by many laboratories (19, 39, 46, 54) but contrasts with some mammalian studies (20, 48). On the other hand, the first mammalian study that examined Ser-2 phosphorylation throughout the transcriptional process, and thus allowed comparison of pSer-2 levels between the promoter and downstream regions, also observed a relative absence of promoter-associated Ser-2 phosphorylation (43). In this study, performed with the mammalian colorectal cancer cell line HCT116, much greater levels of pSer-2 were observed in distal regions for all four genes analyzed including Hsp70, Hsp89α, glucokinase, and proliferating cell nuclear antigen. ChIP data from Drosophila, however, suggest that pSer-2 is present at the promoter of genes including Hsp70 (55). It is not clear how to explain this apparent conflict in Hsp70-related Pol II phosphorylation; however, only two consensus repeats are present in Drosophila CTD, and binding of the H5 (pSer-2/5) and H14 (pSer-5) antibodies may be altered.
It is possible that a subset of human genes, perhaps including dihydrofolate reductase and γ-actin (20), do display high levels of pSer-2 in the CTD of polymerases near the promoters. Although six of seven genes we studied had very little promoter-associated pSer-2, the promoter for PSA consistently displayed a moderate level of pSer-2. This finding agrees with evidence from extensive studies of the PSA promoter region (51, 52).
Resolution of discrepancies concerning the presence of pSer-2 at mammalian promoters is complicated by evidence that the H5 antibody has some affinity for consensus repeats containing only pSer-5 (32, 46, 47). Although pSer-5 itself could potentially support H5 binding, all yeast ChIP studies of which we are aware have found that H5 has minimal ability to precipitate promoter DNA despite high levels of pSer-5 at promoters (19, 39, 46, 54). We can only suppose that the affinity of H5 for pSer-5 containing Pol II is inadequate to allow precipitation efficiencies comparable with those observed for CTDs with pSer-2 or pSer-2/5, at least during ChIP. Nevertheless, the ability of pSer-5 to support some H5 binding may be revealed in some circumstances. As others have noted (56), we find that pSer-2 has a tendency to dephosphorylate more readily than pSer-5.2 If dephosphorylation of pSer-2 during handling has exposed pSer-5 as the only available H5 epitope, this antibody might enable precipitation of enough promoter DNA to produce ChIP patterns similar to H14. Clearly, independent evidence will be necessary to determine definitively whether Ser-2 phosphorylation is introduced near the promoter. Nevertheless, the evidence presented here suggests that a relative absence of pSer-2 in Pol II near the promoter may be a common characteristic of many yeast and human genes. This does not necessarily indicate that there is no pSer-2 in promoter proximal Pol II, but rather that pSer-2 levels are generally insufficient for precipitation with the H5 antibody.
In yeast, a large body of work suggests that high levels of pSer-5 are present on the CTD near the promoter, which decreases as transcription proceeds. In contrast, data from our study strongly suggest that pSer-5 is maintained during transcription in mammals. Although the PPIA and GAPDH genes exhibit moderate decreases in levels of Ser-5 phosphorylated Pol II as transcription proceeds, this decrease is no greater than observed for total Pol II (Pol II N20). Although quantification of total Pol II in the distal gene regions is uncertain, levels are clearly much less than observed near the promoters. Decreased total Pol II levels are also consistent with the existence of pausing in higher eukaryotes, which generally results in increased promoter proximal Pol II (see below) (20, 22, 55). The concurrent decreases in total Pol II and pSer-5 containing Pol II on the PPIA and GAPDH genes suggest maintenance of pSer-5 during elongation and do not suggest pSer-5 dephosphorylation. In this regard, the two high expressing androgen-sensitive genes, NKX3-1 and PSA, are informative because neither showed much enrichment of Pol II in the promoter region relative to distal regions of the gene. Significantly, pSer-5 levels paralleled total polymerase levels, showing little decrease across these genes. Supporting evidence for the retention of pSer-5 during elongation can also be found in the ability of the H14 (pSer-5) antibody to immunoprecipitate hyperphosphorylated Pol II quantitatively with the H5 (pSer-2/5) epitope. Given that H14 (pSer-5) does not bind pSer-2 consensus peptides (32, 46, 47), this quantitative precipitation implies that all pSer-2 containing CTDs also contain pSer-5. Our finding that pSer-5 phosphorylation is maintained during elongation is potentially consistent with the observations of Cheng and Sharp (20), who found decreasing levels of Pol II with pSer-5 on distal regions of the dihydrofolate reductase and α-actin genes but also observed decreasing levels of total polymerase. Retention of pSer-5 during transcription is also observed in Drosophila (55).
Although some studies in yeast have observed little retention of pSer-5 during elongation (19, 39, 46), studies using quantitative approaches (41, 54) have found higher pSer-5 levels than the unquantitated data suggested. In addition, it has been demonstrated recently that the elongation-associated kinase, CTK1, can phosphorylate both Ser-2 and Ser-5 (32). Given other evidence suggesting significant pSer-5 levels (18), some amount of pSer-5 appears present during elongation in yeast. Nevertheless, the relatively even distribution of total Pol II across yeast genes (19, 46, 57) combined with the apparent drop in pSer-5 levels during transcription does suggest partial dephosphorylation of this residue. The unanswered question is whether this reflects a real distinction between mammalian and yeast transcription or a differential ability of H14 to precipitate hyperphosphorylated Pol II from different species. In any case, differences in retention of pSer-5 during transcript elongation in eukaryotes are likely to be ones of degree. In total, the evidence suggests that the CTD of elongating Pol II contains significant pSer-2 and pSer-5 in both yeast and humans.
The phenomenon of promoter proximal pausing of Pol II has been recognized for many years (58–60) and has been correlated with changes in CTD phosphorylation since O’Brien et al. (31) directly demonstrated that the elongation-competent form of Pol II was hyperphosphorylated (55). To the best of our knowledge promoter proximal pausing does not occur in yeast (22); however, the phenomenon has been established in Drosophila and human cell lines by techniques including permanganate labeling of DNA at polymerase bubbles (59, 61), nuclear run-on assays (58, 62), and ChIP (20, 55, 63). Probably because yeast does not display promoter proximal pausing, ChIP studies in yeast have shown Pol II to be distributed evenly across genes (19, 46, 57). In contrast, ChIP studies in Drosophila and human cells (20) have generally observed increased levels of promoter-associated Pol II with the lone exception of the Drosophila H1 gene, a gene that does not display promotor proximal pausing as determined by nuclear run-on assay (53). Thus without counter-example, promoter proximal pausing correlates with increased polymerase density near the promoter during ChIP analysis.
Consequently, our observation that the PPIA and GAPDH genes display higher levels of Pol II near the promoter relative to downstream regions is strong evidence Pol II is pausing near these promoters. This finding is also consistent with a prior observation of promoter proximal pausing at the Drosophila GAPDH1 and GAPDH2 genes (53). In contrast to the situation at these housekeeping genes, ChIP analysis of androgen-sensitive genes NKX3-1 and PSA provided little evidence of pausing, as promoter proximal primer pairs yielded about the same signal as downstream primer pairs. Because most human and Drosophila genes analyzed to date show evidence of polymerase pausing, the data for NKX3-1 and PSA suggest that abrogation of pausing may be a novel mechanism for activation of at least some androgen-activated genes.
In the present study we have observed a dynamic process of CTD phosphorylation in human LNCaP cells which at the gross level is similar to that observed in yeast. In both species, phosphorylation of the CTD on Ser-5 of the consensus repeat occurs at or near the promoter. In contrast, both in our system and in yeast, phosphorylation on Ser-2 is low or nonexistent until Pol II has left the promoter region and moved at least some distance away from the transcription initiation site. This suggests that pSer-2 is not involved in exit of the polymerase from the promoter region of these genes, but does not exclude the possibility that low but mechanistically important levels of Ser-2 phosphorylation are present. Evidence from yeast, as well as available evidence in human cells, suggests that some or most Ser-5 phosphorylation is maintained during mRNA elongation. Further, there is little reason to suppose that Ser-2 and Ser-5 phosphorylation is not present within a single repeat. Indeed, several lines of evidence suggest that doubly phosphorylated repeats are a functionally relevant state even in yeast, including the fact that many yeast phospho-CTD-binding proteins prefer such repeats (64) and the fact that yeast CTK1 phosphorylates either Ser-2 or Ser-5 and prefers substrates with previously phosphorylated repeats (32). Interestingly, the similarity in gross changes in CTD phosphorylation is observed despite the phenomenon of promoter proximal pausing which occurs in humans but not apparently in yeast. Factors that modulate pausing, as could be functioning on the PSA and NKX3-1 genes, may play a general role in gene regulation in human cells. The mechanistic connection between CTD phosphorylation and promoter proximal pausing as well as the regulatory role of pausing remains to be established.
Acknowledgments
Sincere thanks to Arno Greenleaf and Hemali Phatnani for many hours of constructive criticism. Thanks also to Rong Hu for technical help in establishing the equivalence of 5 and 10 min formaldehyde fixation times for ChIP.
Footnotes
The on-line version of this article (available at http://www.jbc.org) contains Supplemental Table 1.
The abbreviations used are: CTD, carboxyl-terminal domain; CDK, CTD kinase; ChIP, chromatin immunoprecipitation; GAPDH, glyceralde-hyde-3-phosphate dehydrogenase; IP, immunoprecipitation; PIC, protease inhibitor cocktail; PMSF, phenylmethylsulfonyl fluoride; Pol II, RNA polymerase II; PSA, prostate-specific antigen; pSer, phosphoserine.
D. Morris, unpublished result.
R. Hu and D. Morris, unpublished results.
References
- 1.Sims RJ, III, Belotserkovskaya R, Reinberg D. Genes Dev. 2004;18:2437–2468. doi: 10.1101/gad.1235904. [DOI] [PubMed] [Google Scholar]
- 2.Zorio DA, Bentley DL. Exp Cell Res. 2004;296:91–97. doi: 10.1016/j.yexcr.2004.03.019. [DOI] [PubMed] [Google Scholar]
- 3.Palancade B, Bensaude O. Eur J Biochem. 2003;270:3859–3870. doi: 10.1046/j.1432-1033.2003.03794.x. [DOI] [PubMed] [Google Scholar]
- 4.Orphanides G, Reinberg D. Cell. 2002;108:439–451. doi: 10.1016/s0092-8674(02)00655-4. [DOI] [PubMed] [Google Scholar]
- 5.Prelich G. Eukaryot Cell. 2002;1:153–162. doi: 10.1128/EC.1.2.153-162.2002. [DOI] [PMC free article] [PubMed] [Google Scholar]
- 6.Noble CG, Hollingworth D, Martin SR, Ennis-Adeniran V, Smerdon SJ, Kelly G, Taylor IA, Ramos A. Nat Struct Mol Biol. 2005;12:144–151. doi: 10.1038/nsmb887. [DOI] [PubMed] [Google Scholar]
- 7.Guo Z, Stiller JW. BMC Genomics. 2004;5:69. doi: 10.1186/1471-2164-5-69. [DOI] [PMC free article] [PubMed] [Google Scholar]
- 8.Cho EJ, Takagi T, Moore CR, Buratowski S. Genes Dev. 1997;11:3319–3326. doi: 10.1101/gad.11.24.3319. [DOI] [PMC free article] [PubMed] [Google Scholar]
- 9.Cho EJ, Rodriguez CR, Takagi T, Buratowski S. Genes Dev. 1998;12:3482–3487. doi: 10.1101/gad.12.22.3482. [DOI] [PMC free article] [PubMed] [Google Scholar]
- 10.McCracken S, Fong N, Rosonina E, Yankulov K, Brothers G, Siderovski D, Hessel A, Foster S, Shuman S, Bentley DL. Genes Dev. 1997;11:3306–3318. doi: 10.1101/gad.11.24.3306. [DOI] [PMC free article] [PubMed] [Google Scholar]
- 11.Ho CK, Sriskanda V, McCracken S, Bentley D, Schwer B, Shuman S. J Biol Chem. 1998;273:9577–9585. doi: 10.1074/jbc.273.16.9577. [DOI] [PubMed] [Google Scholar]
- 12.Holstege FC, Jennings EG, Wyrick JJ, Lee TI, Hengartner CJ, Green MR, Golub TR, Lander ES, Young RA. Cell. 1998;95:717–728. doi: 10.1016/s0092-8674(00)81641-4. [DOI] [PubMed] [Google Scholar]
- 13.Wen Y, Shatkin AJ. Genes Dev. 1999;13:1774–1779. doi: 10.1101/gad.13.14.1774. [DOI] [PMC free article] [PubMed] [Google Scholar]
- 14.Liu Y, Kung C, Fishburn J, Ansari AZ, Shokat KM, Hahn S. Mol Cell Biol. 2004;24:1721–1735. doi: 10.1128/MCB.24.4.1721-1735.2004. [DOI] [PMC free article] [PubMed] [Google Scholar]
- 15.Lu H, Zawel L, Fisher L, Egly JM, Reinberg D. Nature. 1992;358:641–645. doi: 10.1038/358641a0. [DOI] [PubMed] [Google Scholar]
- 16.Feaver WJ, Svejstrup JQ, Henry NL, Kornberg RD. Cell. 1994;79:1103–1109. doi: 10.1016/0092-8674(94)90040-x. [DOI] [PubMed] [Google Scholar]
- 17.Hengartner CJ, Myer VE, Liao SM, Wilson CJ, Koh SS, Young RA. Mol Cell. 1998;2:43–53. doi: 10.1016/s1097-2765(00)80112-4. [DOI] [PubMed] [Google Scholar]
- 18.Schroeder SC, Schwer B, Shuman S, Bentley D. Genes Dev. 2000;14:2435–2440. doi: 10.1101/gad.836300. [DOI] [PMC free article] [PubMed] [Google Scholar]
- 19.Komarnitsky P, Cho EJ, Buratowski S. Genes Dev. 2000;14:2452–2460. doi: 10.1101/gad.824700. [DOI] [PMC free article] [PubMed] [Google Scholar]
- 20.Cheng C, Sharp PA. Mol Cell Biol. 2003;23:1961–1967. doi: 10.1128/MCB.23.6.1961-1967.2003. [DOI] [PMC free article] [PubMed] [Google Scholar]
- 21.Rodriguez CR, Cho EJ, Keogh MC, Moore CL, Greenleaf AL, Buratowski S. Mol Cell Biol. 2000;20:104–112. doi: 10.1128/mcb.20.1.104-112.2000. [DOI] [PMC free article] [PubMed] [Google Scholar]
- 22.Lis J. Cold Spring Harbor Symp Quant Biol. 1998;63:347–356. doi: 10.1101/sqb.1998.63.347. [DOI] [PubMed] [Google Scholar]
- 23.Rasmussen EB, Lis JT. Proc Natl Acad Sci U S A. 1993;90:7923–7927. doi: 10.1073/pnas.90.17.7923. [DOI] [PMC free article] [PubMed] [Google Scholar]
- 24.Yamaguchi Y, Takagi T, Wada T, Yano K, Furuya A, Sugimoto S, Hasegawa J, Handa H. Cell. 1999;97:41–51. doi: 10.1016/s0092-8674(00)80713-8. [DOI] [PubMed] [Google Scholar]
- 25.Yamaguchi Y, Inukai N, Narita T, Wada T, Handa H. Mol Cell Biol. 2002;22:2918–2927. doi: 10.1128/MCB.22.9.2918-2927.2002. [DOI] [PMC free article] [PubMed] [Google Scholar]
- 26.Price DH. Mol Cell Biol. 2000;20:2629–2634. doi: 10.1128/mcb.20.8.2629-2634.2000. [DOI] [PMC free article] [PubMed] [Google Scholar]
- 27.Myers LC, Lacomis L, Erdjument-Bromage H, Tempst P. Mol Cell. 2002;10:883–894. doi: 10.1016/s1097-2765(02)00644-5. [DOI] [PubMed] [Google Scholar]
- 28.Mandal SS, Chu C, Wada T, Handa H, Shatkin AJ, Reinberg D. Proc Natl Acad Sci U S A. 2004;101:7572–7577. doi: 10.1073/pnas.0401493101. [DOI] [PMC free article] [PubMed] [Google Scholar]
- 29.Payne JM, Laybourn PJ, Dahmus ME. J Biol Chem. 1989;264:19621–19629. [PubMed] [Google Scholar]
- 30.Weeks JR, Hardin SE, Shen J, Lee JM, Greenleaf AL. Genes Dev. 1993;7:2329–2344. doi: 10.1101/gad.7.12a.2329. [DOI] [PubMed] [Google Scholar]
- 31.O’Brien T, Hardin S, Greenleaf A, Lis JT. Nature. 1994;370:75–77. doi: 10.1038/370075a0. [DOI] [PubMed] [Google Scholar]
- 32.Jones JC, Phatnani HP, Haystead TA, MacDonald JA, Alam SM, Greenleaf AL. J Biol Chem. 2004;279:24957–24964. doi: 10.1074/jbc.M402218200. [DOI] [PMC free article] [PubMed] [Google Scholar]
- 33.Eberhardy SR, Farnham PJ. J Biol Chem. 2001;276:48562–48571. doi: 10.1074/jbc.M109014200. [DOI] [PubMed] [Google Scholar]
- 34.Kornblihtt AR, de la Mata M, Fededa JP, Munoz MJ, Nogues G. RNA (N Y) 2004;10:1489–1498. doi: 10.1261/rna.7100104. [DOI] [PMC free article] [PubMed] [Google Scholar]
- 35.Goldstrohm AC, Greenleaf AL, Garcia-Blanco MA. Gene (Amst) 2001;277:31–47. doi: 10.1016/s0378-1119(01)00695-3. [DOI] [PubMed] [Google Scholar]
- 36.Proudfoot N. Curr Opin Cell Biol. 2004;16:272–278. doi: 10.1016/j.ceb.2004.03.007. [DOI] [PubMed] [Google Scholar]
- 37.Li J, Moazed D, Gygi SP. J Biol Chem. 2002;277:49383–49388. doi: 10.1074/jbc.M209294200. [DOI] [PubMed] [Google Scholar]
- 38.Li B, Howe L, Anderson S, Yates JR, III, Workman JL. J Biol Chem. 2003;278:8897–8903. doi: 10.1074/jbc.M212134200. [DOI] [PubMed] [Google Scholar]
- 39.Xiao T, Hall H, Kizer KO, Shibata Y, Hall MC, Borchers CH, Strahl BD. Genes Dev. 2003;17:654–663. doi: 10.1101/gad.1055503. [DOI] [PMC free article] [PubMed] [Google Scholar]
- 40.Carty SM, Greenleaf AL. Mol Cell Proteomics. 2002;1:598–610. doi: 10.1074/mcp.m200029-mcp200. [DOI] [PubMed] [Google Scholar]
- 41.Ahn SH, Kim M, Buratowski S. Mol Cell. 2004;13:67–76. doi: 10.1016/s1097-2765(03)00492-1. [DOI] [PubMed] [Google Scholar]
- 42.Ni Z, Schwartz BE, Werner J, Suarez JR, Lis JT. Mol Cell. 2004;13:55–65. doi: 10.1016/s1097-2765(03)00526-4. [DOI] [PubMed] [Google Scholar]
- 43.Mo X, Dynan WS. Mol Cell Biol. 2002;22:8088–8099. doi: 10.1128/MCB.22.22.8088-8099.2002. [DOI] [PMC free article] [PubMed] [Google Scholar]
- 44.Orlando V. Trends Biochem Sci. 2000;25:99–104. doi: 10.1016/s0968-0004(99)01535-2. [DOI] [PubMed] [Google Scholar]
- 45.Patturajan M, Schulte RJ, Sefton BM, Berezney R, Vincent M, Bensaude O, Warren SL, Corden JL. J Biol Chem. 1998;273:4689–4694. doi: 10.1074/jbc.273.8.4689. [DOI] [PubMed] [Google Scholar]
- 46.Cho EJ, Kobor MS, Kim M, Greenblatt J, Buratowski S. Genes Dev. 2001;15:3319–3329. doi: 10.1101/gad.935901. [DOI] [PMC free article] [PubMed] [Google Scholar]
- 47.Licatalosi DD, Geiger G, Minet M, Schroeder S, Cilli K, McNeil JB, Bentley DL. Mol Cell. 2002;9:1101–1111. doi: 10.1016/s1097-2765(02)00518-x. [DOI] [PubMed] [Google Scholar]
- 48.Soutoglou E, Talianidis I. Science. 2002;295:1901–1904. doi: 10.1126/science.1068356. [DOI] [PubMed] [Google Scholar]
- 49.Christova R, Oelgeschlager T. Nat Cell Biol. 2002;4:79–82. doi: 10.1038/ncb733. [DOI] [PubMed] [Google Scholar]
- 50.Nelson PS, Clegg N, Arnold H, Ferguson C, Bonham M, White J, Hood L, Lin B. Proc Natl Acad Sci U S A. 2002;99:11890–11895. doi: 10.1073/pnas.182376299. [DOI] [PMC free article] [PubMed] [Google Scholar]
- 51.Kang Z, Pirskanen A, Janne OA, Palvimo JJ. J Biol Chem. 2002;277:48366–48371. doi: 10.1074/jbc.M209074200. [DOI] [PubMed] [Google Scholar]
- 52.Louie MC, Yang HQ, Ma AH, Xu W, Zou JX, Kung HJ, Chen HW. Proc Natl Acad Sci U S A. 2003;100:2226–2230. doi: 10.1073/pnas.0437824100. [DOI] [PMC free article] [PubMed] [Google Scholar]
- 53.Rougvie AE, Lis JT. Mol Cell Biol. 1990;10:6041–6045. doi: 10.1128/mcb.10.11.6041. [DOI] [PMC free article] [PubMed] [Google Scholar]
- 54.Morillon A, O’Sullivan J, Azad A, Proudfoot N, Mellor J. Science. 2003;300:492–495. doi: 10.1126/science.1081379. [DOI] [PubMed] [Google Scholar]
- 55.Boehm AK, Saunders A, Werner J, Lis JT. Mol Cell Biol. 2003;23:7628–7637. doi: 10.1128/MCB.23.21.7628-7637.2003. [DOI] [PMC free article] [PubMed] [Google Scholar]
- 56.Bregman DB, Du L, van der Zee S, Warren SL. J Cell Biol. 1995;129:287–298. doi: 10.1083/jcb.129.2.287. [DOI] [PMC free article] [PubMed] [Google Scholar]
- 57.Kotovic KM, Lockshon D, Boric L, Neugebauer KM. Mol Cell Biol. 2003;23:5768–5779. doi: 10.1128/MCB.23.16.5768-5779.2003. [DOI] [PMC free article] [PubMed] [Google Scholar]
- 58.Rougvie AE, Lis JT. Cell. 1988;54:795–804. doi: 10.1016/s0092-8674(88)91087-2. [DOI] [PubMed] [Google Scholar]
- 59.Krumm A, Meulia T, Brunvand M, Groudine M. Genes Dev. 1992;6:2201–2213. doi: 10.1101/gad.6.11.2201. [DOI] [PubMed] [Google Scholar]
- 60.Krumm A, Meulia T, Groudine M. Bioessays. 1993;15:659–665. doi: 10.1002/bies.950151005. [DOI] [PubMed] [Google Scholar]
- 61.Giardina C, Perez-Riba M, Lis JT. Genes Dev. 1992;6:2190–2200. doi: 10.1101/gad.6.11.2190. [DOI] [PubMed] [Google Scholar]
- 62.Eick D, Kohlhuber F, Wolf DA, Strobl LJ. Anal Biochem. 1994;218:347–351. doi: 10.1006/abio.1994.1190. [DOI] [PubMed] [Google Scholar]
- 63.Gilmour DS, Lis JT. Mol Cell Biol. 1986;6:3984–3989. doi: 10.1128/mcb.6.11.3984. [DOI] [PMC free article] [PubMed] [Google Scholar]
- 64.Phatnani HP, Jones JC, Greenleaf AL. Biochemistry. 2004;43:15702–15719. doi: 10.1021/bi048364h. [DOI] [PMC free article] [PubMed] [Google Scholar]