

Abstract
Using short duration perturbations, previous attempts to measure the intrinsic ankle stiffness during human standing have revealed a substantial stabilizing contribution (65–90% normalized to load stiffness ‘mgh’). Others regard this method as unsuitable for the low-frequency conditions of quiet standing and believe the passive contribution to be small (10–15%). This latter view, consistent with a linear Hill-type model, argues that during standing, the contractile portion of the muscle is much less stiff than the tendon. Here, for upright subjects, we settle this issue by measuring the stiffness of the contractile portion of the passive calf muscles using low-frequency ankle rotations. Using ultrasound we tracked the changes in muscle contractile length and partitioned the ankle rotation into contractile and extra-contractile (series elastic) portions. Small ankle rotations of 0.15 and 0.4 deg show a contractile to series elastic stiffness ratio (Kce/Kse) of 12 ± 9 and 6.3 ± 10, respectively, with both elements displaying predominantly elastic behaviour. Larger, 7 deg rotations reveal the range of this ratio. It declines in a non-linear way from a high value (Kce/Kse= 18 ± 11) to a low value (Kce/Kse= 1 ± 0.4) as rotation increases from 0.1 to 7 deg. There is a marked transition at around 0.5 deg. The series elastic stiffness (Kse/mgh) remains largely constant (77 ± 13%) demonstrating the contractile component origin of passive, short range stiffness. The linear Hill-type model does not describe the range-related stiffness relevant to the progression from quiet standing to perturbed balance and movement and can lead to inaccurate predictions regarding human balance.
The results presented in the preceding companion paper (Loram et al. 2007) have extended current knowledge of passive ankle stiffness. The evidence clearly shows that the passive stiffness increases progressively as rotations decrease below 1 deg to 0.03 deg covering the range experienced by the small ankle rotations of quiet standing. A single non-linear relationship (stiffness α rotation0.33±0.04) approximates ankle stiffness for rotations extending from very small (0.03 deg) to larger (7 deg). This high short range stiffness is not a result of changes in sensory modulation but is an intrinsic property of the passive muscle–tendon unit.
The origin of this in vivo, short range ankle stiffness cannot be determined from the relationship between ankle torque and joint angle. Hence previous studies of ankle stiffness relevant to human standing (Gurfinkel et al. 1974; Kearney & Hunter, 1982; Mirbagheri et al. 2000; Loram & Lakie, 2002; Peterka, 2002; Cordo & Gurfinkel, 2004; Maurer & Peterka, 2004; Casadio et al. 2005) have not been able to judge whether standing ankle stiffness is primarily determined by the contractile portion or series elastic portion of the muscle–tendon unit or indeed whether the stiffness is a product of passive or active muscle. In fact, currently, there is a lack of information concerning the stiffness of the contractile portion of the human soleus and gastrocnemius muscles under postural conditions even to the extent of knowing whether the contractile tissue is stiffer or more compliant than the tendon. Table 1 records a definition of terms regarding stiffness.
Table 1.
Terms and definitions
| Term | Definition |
|---|---|
| Ankle stiffness | Stiffness of the whole ankle joint |
| Intrinsic stiffness | Stiffness that is present with no neural modulation |
| Contractile stiffness Kce | Stiffness of the contractile element in the Hill model; Fig. 1B |
| Series elastic stiffness Kse | Stiffness of the series elastic element in the Hill model; Fig. 1B |
| Normalized stiffness | Stiffness divided by the load stiffness mgh |
The linear Hill-type model is a popular representation of the passive muscle–tendon unit (Winters et al. 1990; Maurer & Peterka, 2005a). This Hill-type model represents the passive (non-neural) component of the muscle–tendon unit as a contractile unit (parallel spring and damper) in series with a series elastic component (SEC, spring) (Fig. 1B). This model predicts that the combined stiffness of the SEC and contractile element is independent of the size of ankle rotation, but highly dependent on the frequency of ankle rotation. At low frequency, the viscosity is negligible and the stiffness of the complete unit is determined by the series elastic stiffness and the contractile stiffness. At high frequency, the impedance of the contractile component would be high due to its viscosity and thus the high-frequency perturbations would effectively measure the tendon stiffness since the contractile portion of the muscle would not be stretched. Given the assumption of this model, it is a reasonable prediction that short-duration, high-frequency perturbations used in previous studies (Loram & Lakie, 2002; Casadio et al. 2005) would measure tendon stiffness rather than the ankle stiffness that prevails during the low-frequency (0.3–0.5 Hz) (Loram et al. 2005b) inverted pendulum-like sways of quiet standing.
Figure 1. Sonograph and model.

A, sonograph of the left gastrocnemius medialis and soleus muscles taken from the medial aspect. From top to bottom, groups of eight markers are placed proximally on gastrocnemius, distally on gastrocnemius, centrally on the aponeuroses leading to the Achilles tendon, distally on soleus and proximally on soleus. Markers placed either side of the central aponeuroses show independent motion. It is the differential motion between the distal and proximal markers for each muscle that represents changes in contractile length. A black scale marker is shown to indicate 1 cm of depth and longitude. B, the linear Hill-type model consists of a series elastic element (Kse), and a series contractile element containing parallel elastic (Kce) and viscous (Bce) components. Variables are footplate rotation (θ) and contractile displacement (θ0).
For this reason the values of ankle stiffness derived from the Loram & Lakie and Casadio et al. studies (90% and 65%mgh, respectively) have been held to be a consequence of the rapid perturbation and attributed to the tendon component (Maurer & Peterka, 2005a). It is the view of these researchers that overall passive ankle stiffness relevant to quiet standing is low (∼15%mgh (Peterka, 2002; Jeka et al. 2004; Maurer & Peterka, 2005b)). In attributing the high values obtained by Loram & Lakie and Casadio et al. to the tendon it then becomes necessary to attribute a low stiffness (∼15%mgh) to the passive contractile component. In the present investigation we measure the stiffness of the passive contractile component using low-frequency stretches resembling quiet standing. Resolving the issue of the minimal passive stiffness is important, for it can play a very significant role in stabilizing the body (preceding paper) thus changing the demands placed on the controlling nervous system.
The existing literature on muscle physiology does provide some insight to this debate. As described in the introduction of the preceding paper, contractile tissue is well known to have a high short range stiffness, higher than the long range stiffness, and which is independent of frequency, slightly dependent on stretch velocity, and primarily dependent on the amplitude of stretch (Hill, 1968; Rack & Westbury, 1974; Nichols & Houk, 1976), whereas tendon is known to have a stiffness that is low for low strains and which increases progressively with stretch (Maganaris, 2001, 2002). Regarding contractile tissue, what is uncertain is the extrapolation from animal work to human stretches in quiet standing, specially given that the velocity of muscle lengthening in quiet standing is very low and it is uncertain whether one would observe a short range stiffness or not.
Traditionally it has been assumed that contractile length signals joint ankle and that this information provides primary proprioceptive information via muscle spindles that is necessary for postural regulation. The recent ultrasound demonstration of paradoxical contractile movements in quiet standing (Loram et al. 2004, 2005a) has shown that contractile length is a poor indicator of instantaneous ankle joint angle during quiet standing and that this is a consequence of a series elastic component with stiffness less than 100%mgh where mgh is the load stiffness. However, those observations provided no insight into the relationship between imposed ankle rotation and mechanical stretch of the contractile tissue. Does contractile component length uniformly reflect changes in joint angle? Do the soleus and gastrocnemius muscles show equal mechanical sensitivity to joint rotation?
Here we use slow, low-frequency ankle rotations and ultrasound tracking of the resulting changes in contractile length to partition the applied rotation into contractile and extra-contractile portions. We address the following questions.
How does contractile component elongation and contractile component stiffness progress from short to long range ankle rotation?
-
At the ankle rotation size, speed and frequency that typify quiet standing,
is there an observable, steady state, short range contractile stiffness, and
which element, tendon or muscle, provides the limiting stiffness?
How valid are the frequency and amplitude predictions of the linear Hill-type model?
What are the implications for muscle spindle registration of ankle rotation?
Methods
The experiments reported here, including subjects, set-up, apparatus and procedure are those described in the preceding companion paper (Loram et al. 2007). Here we describe only the additional measurements and analysis relevant to this paper.
Additional apparatus and measurements
Rotation of the left shin relative to the ground was measured using a laser range finder (YT25MGV80, Wenglor Sensoric, Germany) with a resolution of < 200 μm and response time of 2 ms that was mounted on the apparatus frame and reflected off the left shin giving a typical angular resolution of < 0.03 deg. An ultrasound probe (5–10 MHz linear array probe, DIASUS, UK) was fixed along the left calf to provide a parasagittal-plane view of the underlying soleus and gastrocnemius medialis muscles (Fig. 1A). The customised DIASUS scanner writes a digital ‘avi’ file at 30 frames s−1 directly to its own hard disk and transmits a timing pulse to the data logging computer to mark the acquisition time of each frame. We recorded the first 40 s of each trial which included the first two unidirectional rotations of the 7 deg passive stretches. Independent changes in contractile length of the soleus and gastrocnemius medialis muscles were computed offline using a method previously described and assessed in detail (Loram et al. 2006).
Using an MRI scanner (0.2 Tesla, E-Scan, Esaote Biomedica, Genoa, Italy) we measured the Achilles tendon moment arm for 6 of the 10 subjects (Maganaris et al. 1998, 2004). Based on mean values from our own subjects (5.1 ± 0.4 cm) and from more extensive studies (Maganaris, 2004) an approximate mean value of 5 cm was used for the remaining subjects.
Data analysis
Definition of calculations
Footplate rotation coaxial with the ankle joint was converted into an equivalent linear measure along the line of action of the Achilles tendon and calf muscles using L=MA sin(A) where L, MA and A are linear displacement, moment arm of the Achilles tendon and footplate rotation, respectively.
Extra-contractile displacement (EL) was calculated using EL = L – CL where CL is contractile displacement.
For the long ankle rotations, for the first dorsiflexion, we calculated the magnitude changes in torque, footplate angle, contractile length and extra-contractile length and we calculated the contractile chord elongation ratio (Rc), extra-contractile chord elongation ratio (Rec), contractile chord stiffness (Kc) and extra-contractile chord stiffness (Kec) as:
 |
 |
Calculation of contractile to series elastic stiffness ratio from footplate rotation and contractile length
For every trial we used the applied footplate rotation and changes in muscle contractile length to calculate the ratio contractile stiffness/series elastic stiffness, and contractile viscosity/series elastic viscosity for each of the muscles soleus and gastrocnemius medialis. Since we are investigating this model, we used a Hill-type model (Fig. 1B) to partition ankle stiffness into contractile and series elastic components. We assume that all changes in contractile length are attributable to footplate rotation and no changes in contractile length arise from fluctuations in EMG. By equating the torque in the series elastic spring to the combined torque from the contractile spring and damper the transfer function relating contractile length θ0 to footplate angle θ is derived as:
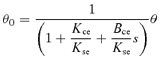 |
where Kce, Bce and Kse are contractile stiffness, contractile viscosity and series elastic stiffness, respectively, and s is the Laplace variable. Contractile length was converted from the linear measure recorded by the ultrasound tracking procedure to an angular measure using the moment arm of the subject.
The linear transfer function was used to predict the 40 s contractile length time series from footplate rotation. Using a non-linear line search algorithm (Powell, 1978) the two coefficients, the ratios Kce/Kse and Bce/Kse, were optimized to maximize the variance accounted for by this model. The coefficients were constrained to positive values below 50. This procedure was applied both to the soleus and gastrocnemius contractile length data.
Calculation of contractile stiffness, contractile viscosity and series elastic stiffness using footplate rotation, contractile length and ankle torque
For the short rotations only (< 0.5 deg), we used left ankle torque, applied footplate rotation and changes in muscle contractile length to calculate the contractile stiffness, contractile viscosity and series elastic stiffness for the calf muscles using in turn, the soleus and gastrocnemius medialis muscles as representative of the entire triceps surae group. We used the same linear Hill-type model (Fig. 1B) to predict changes in ankle torque and contractile length from footplate rotation. We applied the model in state-space form where state x, input u, and output y are related according to:
and
 |
where the variables are: θ0, contractile length; θ, footplate angle; and T, ankle torque, and the coefficients are Kce, Bce and Kse representing contractile stiffness, contractile viscosity and series elastic stiffness, respectively. Using this linear system, 40 s time series of ankle torque and contractile length of a single muscle (soleus or gastrocnemius medialis) were predicted (YLT and YCL, respectively) and compared with measured values (yLT and yCL). The error variable E was calculated using:
where VAF is the variance in the measured values accounted for by the predicted values (Mirbagheri et al. 2000). The mean VAF of ankle torque and contractile length was maximized by optimizing the four coefficients which were constrained to positive values less than 1000, 150, 150 and 20, respectively (Powell, 1978). This procedure was applied individually to soleus and gastrocnemius medialis.
We wanted to test whether irregular fluctuations in EMG in the representative muscle altered the estimated values of the coefficients. We repeated the optimization using a slightly more complex model, including filtered EMG from the single representative muscle. In state space form this model is expressed as follows,
 |
where E and k are filtered EMG and EMG gain from the representative muscle. The values of coefficients incorporating EMG were compared with those estimated without EMG.
Effect of possible shin displacement and knee rotation
We wanted to know whether possible knee movement would alter the transmission of footplate rotation to origin-insertion displacement of the soleus and gastrocnemius muscles. For every trial, using laser measurement of shin displacement and moment arm of the laser reflection, we calculated shank rotation relative to the ground. We subtracted the shank rotation from footplate rotation to calculate actual ankle joint rotation. Assuming the ankle–knee distance equals the knee–hip distance and assuming the hip did not move because the subject was strapped around the pelvis to the vertical support, then geometrically, knee rotation equals twice the shank rotation. Using ankle rotation (soleus) and ankle and knee joint rotation (gastrocnemius) we calculated the per cent change in origin to insertion distance using the regression equations of Grieve et al. (1977). For each muscle, we compared changes in origin to insertion distance, with and without considering shank rotation. For each trial, we used linear regression between origin–insertion displacement with and without shank rotation to calculate the ratio of footplate rotation transmitted to the origin–insertion displacement of the muscle.
Uncertainty in calculation of contractile length
The method for computing changes in contractile length (Loram et al. 2006) tracks the mean displacement of squares of pixels centred half a square length inside the boundary of the gastrocnemius and soleus muscles. This is to ensure that the measurement of each muscle is unaffected by structures exterior to that muscle and thus provides the best measurement of independent changes in contractile length using this approach. It is possible that this procedure underestimates the change in contractile length that occurs at the boundaries of the muscle defined by the aponeuroses. To estimate the maximum likely extent of this underestimate we extrapolated the position of the tracking markers to the proximal and distal aponeuroses and calculated the changes in contractile length from those extrapolated positions. All analyses were repeated using the extrapolated changes in contractile length and were compared with the original results.
Statistical analysis
Using multiple linear regression, all parameters calculated for the short rotation trials (< 0.5 deg) were regressed against rotation size and rotation speed. Where the combined regression model was significant, significant variation individually with size and speed was reported at the 95% confidence level. When values for gastrocnemius and soleus are statistically indistinguishable, we quote a single result for both muscles. The values of all measurements and coefficients are quoted as a mean ± standard deviation (s.d.) unless otherwise stated.
Results
The results presented here report the same experiments as the preceding companion paper. These additional data focus on the ultrasound tracking of contractile length so that the relative stiffness of the contractile and series elastic components can be determined.
Contractile displacement derived from ultrasound (Fig. 1A) and the use of the linear Hill-type model (Fig. 1B) allows the relative and absolute values of contractile and series stiffness to be estimated. The same representative subjects and same trials are presented to allow comparison of results with the first paper of the pair.
Long passive stretches
Typical features
With the subject vertical and the muscle inactive, ultrasound shows some passive stretch of the contractile component and rather static echo-genic features (Fig. 1A, movie in Supplemental material). When the ankle is rotated at constant speed, taking 20 s to dorsiflex the foot 7 deg (Fig. 2A) from a true starting angle of −1.5 deg relative to the horizontal, there is initially very little change in contractile length of either the soleus or gastrocnemius muscles (Figs 2B and 3A, and Supplemental movie). After a couple of seconds (Fig. 2A) and half a degree (Fig. 3A) there is a yield in contractile length followed by an inflexion. The ripples in contractile length diminish after 8 s progressing into a smoother but declining increase of contractile length with angle with gastrocnemius increasing more than soleus. Both muscles continue to increase in contractile length after the ramp reverses at 20 s leading to a maintained elongation of both muscles on completion of the cycle. The initial ripples and permanent elongation of contractile length were not associated with knee movement (Fig. 2A). The Hill-type model coarsely represents the gross changes in contractile length though it does not represent the initial, short range hold or the subsequent ripples (Fig. 2B). The extra-contractile displacement was greater than the contractile displacement (Fig. 2C versus 2B). The initial ripples in contractile length were seen in all subjects (Fig. 2D).
Figure 2. Representative long stretches through time.

Slow, 7 deg ramp, ankle rotations were applied. A, footplate rotation displacement (continuous line) relative to initial angle of −1.5 deg, true ankle joint rotation (upper dashed line) and knee rotation (lower broken line). The subject was supported at the true vertical. Positive angles are toes up and knee extended. B, gastrocnemius (upper continuous line) and soleus (lower continuous line) contractile component displacement (ml). Dotted lines represent model-predicted contractile component displacement (xML). C, extra-contractile component displacement calculated as linearized footplate displacement minus contractile displacement: gastrocnemius (continuous line) and soleus (dashed line). D, contractile component displacement of first 10 s from start of dorsiflexion for remaining 9 subjects: each offset by 4 s.
Figure 3. Representative long stretches with angle.

Slow, 7 deg ramp, ankle rotations were applied. Panels show same data as Fig. 1 but as changes with footplate angle: A, gastrocnemius (continuous lines) and soleus contractile component displacement (dotted lines). B, left ankle torque (LT) versus contractile displacement for gastrocnemius (continuous lines) and soleus (dashed lines). C, left ankle torque from start and from first reversal (20 s) versus gastrocnemius contractile component displacement, for each of remaining 9 subjects. In each case the first 10 s of the rotation is shown. Subjects offset. D, left ankle torque versus extra-contractile component displacement for gastrocnemius (continuous lines) and soleus (dashed lines).
We have already commented above on the non-linear contractile displacement with respect to footplate rotation (Fig. 3A). The contractile and extra-contractile portions show quite distinct displacement behaviour in relation to ankle torque. Plotting left ankle torque against contractile length reveals an initial, short range region of exceptionally high stiffness (gradient) leading to a sharp shoulder, followed by a long range region of low but increasing stiffness (Fig. 3B). At the ramp reversal, there is another region of high stiffness combined with what looks like an underlying tendency for contractile length to increase, followed by a more rounded shoulder and a return to an ankle torque that is lower than the starting value. These features were repeated in all subjects (Fig. 3C). Figure 3C shows the torque versus contractile displacement for the first two unidirectional rotations, presented from a common origin. Different subjects are offset for presentation purposes. Comparing Fig. 3D with Fig. 3B, plotting left ankle torque against extra-contractile displacement (Fig. 3D) shows a largely constant stiffness with some clear ‘hysteresis’ but without the prominent shoulders of the contractile displacement (Fig. 3B).
Summary of long stretches for all subjects
The contractile and extra-contractile components show different patterns of elongation with footplate rotation (Fig. 4). When the 7 deg dorsi-flexion of all subjects is combined on a log–log plot (Fig. 4A) then below 0.5 deg the contractile elongation is much less than the extra-contractile elongation and above 0.5 deg the elongation of both components is broadly similar. The portions which approximate straight lines on the log–log plot represent power relationships between tissue displacement and footplate rotation. Gastrocnemius contractile length (Fig. 4B, thick) elongates at approximately 70–100 μm deg−1 and 500 μm deg−1 in the short range and long range regions, respectively. By contrast, gastrocnemius extra-contractile length (Fig. 4B, thin) elongates more uniformly at approximately 800 μm deg−1 in the short range region which is reduced to 400 μm deg−1 in the long range region where it is ‘paying out’ an extra ∼400 μm per degree in the contractile tissue. For soleus contractile tissue (Fig. 4C, thick) values are slightly lower and more variable with a short range elongation ratio of 50–100 μm deg−1. Thus, while long rotations provide almost equal elongation of contractile and extra-contractile tissue, short rotations provide an order of magnitude lower elongation of the contractile tissue relative to extra-contractile tissue (Fig. 4B and C). Shin displacement had negligible systematic effect on the transmission of footplate rotation to gastrocnemius and soleus origin to insertion distance: Fig. 4D shows that the mean changes in origin to insertion distance taking shin motion into account (dashed, gastrocnemius; dotted, soleus) and not taking shin motion into account (continous) are barely distinguishable.
Figure 4. Summary of long stretches.

A, magnitude change in mean gastrocnemius contractile component length (thick continuous line) and extra-contractile length (thin continuous line) from the start of dorsiflexion versus magnitude change in footplate ankle. B, chord change in gastrocnemius contractile component length (thick continuous line) and extra-contractile length (thin continuous line) versus magnitude change in rotation angle. C, same as B but for soleus. D, change in ‘per cent origin–insertion distance’ (psl) using regression equation of Grieve et al. (1977) which takes into account ankle and knee rotation. Superimposed are the mean for all subjects of gastrocnemius (dashed line) and soleus (dotted line) incorporating shin rotation, and that attributed to footplate rotation with no shin movement (continuous line). The lines are almost indistinguishable. E, magnitude change in left ankle torque during first dorsiflexion versus gastrocnemius contractile component displacement (thick continuous line) and extra-contractile displacement (thin continuous line). F, gastrocnemius contractile (thick continuous line) and extra-contractile (thin continuous line) chord stiffness versus footplate rotation. For panels A–F, faint dotted lines show individual subjects. G and H, for all subjects from all trials, panels show the median, interquartile range (box edges), range (whisker ends) and outliers (crosses) for: G, the ratio contractile stiffness/series elastic stiffness for gastrocnemius and soleus and H, the ratio contractile viscosity/series elastic stiffness for gastrocnemius and soleus. Notches represent a robust estimate of the uncertainty about the medians for box-to-box comparison.
Ankle torque shows different relationships with contractile displacement (Fig. 4E, continuous) and extra-contractile displacement (Fig. 4E, thin) with a clear transition at displacements of around 300 μm (gastrocnemius shown). This is reflected in their relative stiffness; Fig. 4F shows that the contractile component is approximately 80 times stiffer for the smallest stretches declining to an equal stiffness for rotations beyond 1 deg. For rotations of 0.13 deg typical in standing (Loram et al. 2005b), the contractile tissue is 17 ± 11 times stiffer than extra-contractile tissue.
Using the Hill model without EMG, the long range ratio contractile stiffness/series elastic stiffness is 1.0 ± 0.5 and 1.3 ± 1.3 (median ±s.d.) for gastrocnemius and soleus, respectively (Fig. 4G). These values approximate closely to the long range ratio shown in Fig. 4F. The corresponding ratios of contractile viscosity/series elastic stiffness are 1.4 ± 2 and 4.2 ± 8 s (median ±s.d.) for gastrocnemius and soleus (Fig. 4H). This model predicted contractile length with R2 values of 95 ± 5% and 86 ± 24% for gastrocnemius and soleus, respectively.
We used extrapolated markers to estimate the likely maximum uncertainty in our calculation of contractile length and all subsequent calculations. Extrapolation causes values of contractile displacement to increase by 25%, caused increased variability and subsequent artefacts in the calculation of extra-contractile displacement and all subsequent calculations. Thus, is it likely that this procedure overestimates the uncertainty in contractile length. There was no change in reported trends in Figs 2–4. The main change is that the long range contractile stiffness/series elastic stiffness ratio decreases to and can be below unity giving 0.8 ± 0.4 and 1.2 ± 1.2 for gastrocnemius and soleus, respectively.
Short passive stretches
Typical changes with size of stretch
With the subject at their normal standing configuration, we applied continuous, constant speed, short ankle rotations of 0.06, 0.15 and 0.4 deg at durations of 1, 2 and 5 s. For these rotation amplitudes at a constant, mean speed of 0.08 deg s−1, Fig. 5 shows representative changes through time and Fig. 6 shows the same changes with contractile or extra-contractile displacement. Changes in contractile length (Fig. 5, rows 2 and 3) are not visible for the smallest ankle rotations though changes of 5–10 μm and 50–60 μm in gastrocnemius are visible for the 0.15 and 0.4 deg rotations, respectively. Changes in soleus contractile length (Fig. 5, row 3) are only clear for the largest ankle rotations. As rotation size increases, conversion of contractile displacement to angular rotation using the moment arm shows that contractile displacement occupies a greater portion of the applied rotation (Fig. 5, row 4) and that contractile stiffness relative to series elastic stiffness decreases with larger ankle rotations. The visible changes in contractile length appear predominantly elastic, i.e. synchronous with ankle rotation, although for the largest rotation the non-linear response is visible. The Hill-type ‘with EMG’ and ‘without EMG’ models predict ankle torque very closely (Fig. 5, row 1), predict gastrocnemius contractile displacement quite closely (Fig. 5, row 2) and predict soleus displacement more approximately (Fig. 5, row 3).
Figure 5. Representative short stretches through time varying size.

Short rotations of varying size at constant speed were applied. A, B and C show 0.06, 0.15 and 0.4 deg rotations for durations of 1, 2 and 5 s, respectively. The steady-state response is shown since 10 s of ramps have already elapsed. Rows in descending order show: (1) left ankle torque (continuous line) and Hill model predictions with and without using EMG (dashed line); (2) gastrocnemius contractile component displacement (continuous line) and Hill model predictions (dotted line); (3) same as row 2 but for soleus; (4) footplate rotation (continuous line) and rotational equivalent of gastrocnemius contractile component displacement (dashed line). The subject was at their normal standing angle. Zero degrees represents a horizontal footplate and positive angles are toes up.
Figure 6. Representative short stretches with contractile displacement varying size.

Short rotations of varying size at constant speed showing the same data as Fig. 5. A, B and C show 0.06, 0.15 and 0.4 deg rotations for durations of 1, 2 and 5 s, respectively. The steady-state response is shown since 10 s of ramps have already elapsed. Rows in descending order show: (1) left ankle torque versus contractile component displacement for gastrocnemius (continuous lines) and soleus (dotted lines). (Soleus is offset for ease of view); (2) left ankle torque versus extra-contractile component displacement for gastrocnemius (continuous lines) and soleus (dotted lines) with soleus offset.
By comparison of the torque versus displacement gradients, Fig. 6 shows clearly (i) that contractile stiffness (row 1) is greater than the extra-contractile stiffness (row 2), (ii) that contractile stiffness decreases with rotation amplitude, (iii) that extra-contractile stiffness is largely constant with rotation amplitude, and (iv) that the extra-contractile component shows more ‘hysteresis’ than the contractile component which is more purely elastic for the smaller rotations.
Summary of short stretches for all subjects
Since length changes of the contractile component could not be reliably observed for the smallest (0.06 deg) rotations, this rotation category was excluded from further analysis. Furthermore, we excluded all trials in which the variance accounted for by the first Hill-type model was less than 50%. From 60 trials including 2 rotation sizes, and 3 speeds for 10 subjects, this exclusion eliminated 9 trials for gastrocnemius and 13 trials from soleus, from predominantly the middle rotation size (0.15 deg). Since stiffer contractile tissue results in smaller movements, this criterion would most likely exclude cases of stiffer contractile tissue for smaller rotations.
The summary data of Fig. 7 and Table 2 show generally that contractile stiffness increases as rotation size decreases and that short range contractile stiffness is considerably greater than extra-contractile stiffness.
Figure 7. Summary of short stretches: variation with rotation size.

Panels show regression plots versus footplate rotation or bar chart showing the mean value for each subject at each rotation. A, ratio contractile stiffness/series elastic stiffness (Kce/Kse). B, mean ±s.e.m. (Kce/Kse) C, R2 for predicted gastrocnemius contractile component displacement using Hill model without EMG. D, ratio contractile viscosity/series elastic stiffness (Bce/Kse). E, normalized contractile stiffness (Kce). Mean gastrocnemius chord stiffness (continuous line) and 95% confidence values (dashed lines) from 7 deg rotations are shown for comparison with short stretches. F, mean ±s.e.m. normalized contractile stiffness (Kce/mgh). G, R2 for predicted gastrocnemius contractile displacement and ankle torque using Hill model without EMG. H, normalized series elastic stiffness (Kse/mgh). For panels A, D, E, H dots show gastrocnemius and crosses show soleus. Regression values are plotted from all subjects for all 0.15 and 0.4 deg rotations for which the R2 of the Hill model was greater than 50%. Dashed lines show the best fit and 95% confidence regression lines.
Table 2.
For each subject, the normalized contractile stiffness (Kce/mgh), gastrocnemius and soleus combined, derived from the ‘without EMG’ Hill model applied to the 0.15 and 0.4 deg rotations, was regressed against rotation size (θ) giving coefficients b1 and b2 using Kce/Kse=b1θ+b2. This model assumes a single contractile element for the entire triceps surae group and assumes that either gastrocnemius or soleus is representative of the single contractile element
| Subject | mgh | Kse/mgh | b1 | b2 | R2 | P |
|---|---|---|---|---|---|---|
| Nm deg−1 | deg−1 | |||||
| 1 | 7.9 | 0.75 ± 0.20 | — | 1.63 ± 1 | — | — |
| 2 | 10.6 | — | — | — | — | — |
| 3 | 12.8 | 0.77 ± 0.09 | −26.8 ± 15 | 13.5 ± 6 | 0.86 | 0.007 |
| 4 | 10.3 | 0.67 ± 0.05 | −23.9 ± 17 | 12.5 ± 5 | 0.49 | 0.01 |
| 5 | 8.9 | 0.87 ± 0.12 | −35.5 ± 12 | 17.5 ± 4 | 0.89 | 0.0004 |
| 6 | 15.5 | 0.68 ± 0.05 | — | 12.5 ± 5.4 | — | — |
| 7 | 11.0 | 0.86 ± 0.18 | −15.7 ± 6 | 8.1 ± 2 | 0.73 | 0.0001 |
| 8 | 9.0 | 0.62 ± 0.12 | −50.5 ± 6 | 25.9 ± 2 | 0.99 | 0.0001 |
| 9 | 13.8 | 0.65 | — | 12.6 | — | — |
| 10 | 10.0 | 0.94 ± 0.08 | — | 9.8 ± 6.3 | — | — |
| Mean | 11.0 | 0.77 | −28.9 ± 8 | 15.3 ± 3 | 0.46 | < 0.0001 |
| s.d. | 2.3 | 0.13 | — | — | — | — |
The table presents the load stiffness (mgh), series elastic stiffness (Kse), regression coefficients, coefficient of determination (R2) and confidence values (P) with ±95% confidence values. Values from the Hill model were only used when the variance accounted for by the Hill model was greater than 50%, hence values were not possible for some subjects. Where regression was not significant and sufficient values allow, a mean value is presented with 95% confidence intervals. The variance accounted for by the model is more likely to be low, and values missing from the table, when contractile stiffness is high and contractile displacement caused by the ankle rotation is small in relation to random movement. The penultimate row represents the coefficients when values from all subjects are combined.
Hill model predicting contractile displacement from footplate rotation
This model estimates contractile values relative to the series elastic component.
Contractile stiffness/series elastic stiffness(Fig. 7A)
For gastrocnemius this ratio was 6.3 ± 10 and 12 ± 9, respectively, for 0.4 and 0.15 deg rotations, which increased significantly as size decreased but did not vary with rotation speed (regression R2= 13%, P= 0.04). Values were considerably larger than for the 7 deg rotations (Fig. 7B). For soleus (Fig. 7A), this ratio was 5.1 ± 4.7 and 14 ± 15 for 0.4 and 0.15 deg rotations, respectively, and showed significant regression with size but not speed of rotation (regression R2= 0.18, P= 0.02).
Contractile viscosity/series elastic stiffness
For gastrocnemius this ratio showed no significant variation with size or speed giving a mean value 3.2 ± 4.6 s. For soleus, this ratio decreased significantly as speed increased and showed no variation with size (regression R2= 23%, P= 0.04) and gave a mean value of 4.0 ± 6 s.
For all 60 trials, this Hill model predicted contractile displacement with an R2 of 72 ± 26% and 61 ± 28% for gastrocnemius and soleus, respectively (Fig. 7C). This model did not use a ‘with EMG’ implementation.
Hill model predicting contractile displacement and ankle torque from footplate rotation
This model estimates absolute values of the contractile and series elastic components. The absolute values are then normalized to mgh.
Contractile stiffness normalized (Kce/mgh) (Fig. 7E and F)
For gastrocnemius values were 3.7 ± 3.4 and 12 ± 5 for 0.4 and 0.15 deg rotations. Regression showed significant variation with size of rotation but not for rotations of different speed (R2= 54%, P < 0.0001). Soleus showed no significant regression and a mean of 3.8 ± 3.
Contractile viscosity normalized (Bce/mgh) (Fig. 7D)
Both muscles showed significant regression with speed, increasing as speed decreased, but not with size of rotation (R2= 15%, 35%, P= 0.04, 0.004, respectively, for gastrocnemius and soleus). The respective mean values were 1.3 ± 2 and 1.8 ± 2 s.
Series elastic stiffness normalized (Kse/mgh) (Fig. 7H)
The two muscles were statistically indistinguishable (t test, N= 98, P= 0.44) and showed no variation with size or speed of rotation. The combined mean value was 0.77 ± 0.13.
For all 60 trials, this model without EMG predicted contractile displacement and ankle torque with a mean R2 of 60 ± 23% and 49 ± 20% for gastrocnemius and soleus, respectively (Fig. 7G). When EMG was included in the model, the mean R2 rose to 62 ± 22% and 54 ± 17% with negligible effect on the values quoted above.
Qualifications regarding contractile estimates
The uncertainty involved in calculating contractile displacement from the ultrasound movie made a small numerical difference to some of the calculations. As previously, we used extrapolated markers to estimate the likely maximum uncertainty in our calculation of contractile length and all subsequent calculations. Extrapolation causes values of contractile stiffness and contractile ratio values to decrease by up to 20% and normalized series elastic stiffness increased to 0.82 ± 0.22. There were no changes in R2.
The rotation of the footplate imparts a well-defined angular input at the ankle joint, and the linear equivalent of that is defined by the moment arm of the Achilles tendon. As a result of shin displacement, the consequent knee rotation and reduction in ankle joint rotation, we calculate that for the short rotations 92 ± 10% and 79 ± 26% of that linear input were ‘seen’ by origin to insertion displacement of the gastrocnemius and soleus, respectively. Using calculated origin to insertion displacement as the input and the model with EMG, the normalized series elastic component was estimated as 0.93 ± 0.41. This value is localized as the combined Achilles tendon stiffness rather than a kinematically distributed series elastic stiffness. The origin to insertion values of contractile stiffness/series elastic stiffness for gastrocnemius and soleus were lower by 8 and 10%, respectively, than the values without shin movement correction.
Discussion
On the basis of these slow, low-frequency ankle rotations and ultrasound tracking of contractile displacement, we can consider: (i) the progression of contractile elongation and contractile stiffness with ankle rotation, (ii) the contractile origin of short range stiffness, and (iii) the frequency and amplitude predictions of the Hill-type model.
The progression of contractile elongation and contractile stiffness with ankle rotation
Long rotations
The representative results (Figs 2 and 3) and summary results for all subjects (Fig. 4) show clearly that contractile displacement does not proceed uniformly with ankle rotation. For small rotations (< 0.5 deg) contractile elongation is approximately 6 times less sensitive to ankle rotation than for larger rotations (Fig. 4B). This result holds true for all subjects (Fig. 2D) and is not dependent on any modelling assumptions.
This implies that, as a sensory substrate, contractile tissue is insensitive to small joint rotations. However, it is well known that muscle spindles, which register contractile elongation, have enhanced receptivity to small displacements (Matthews & Stein, 1969; Matthews, 1972). It is a pleasing hypothesis that muscles spindles and contractile tissue are mutually adapted to provide a uniform registration of joint rotation. At the very least, contractile insensitivity to small rotations must offset the enhanced spindle sensitivity such that the complete system is not actually particularly sensitive to low-amplitude stimuli.
Ankle torque is not wholly transmitted through the soleus and gastrocnemius muscles. Nonetheless, the same portion will be transmitted through the contractile tissue and its series elastic (tendinous) element. When contractile displacement is plotted against ankle torque (Fig. 3B) and compared with series elastic displacement (Fig. 3D) it is clear that contractile tissue is exceptionally stiff for small displacements, and that this effect progresses quite abruptly to a lower long range stiffness, and also that series elastic tissue is of more uniform stiffness comparable to long range contractile stiffness. These observations hold true for all subjects (Figs 3C and 4F) and are not dependent on modelling assumptions.
The fact that the passive contractile element of the soleus and gastrocnemius muscles is of comparable long range stiffness to the series elastic component (primarily the tendon) is in agreement with the findings of Herbert et al. (2002) for the gastrocnemius muscle. This perhaps surprising fact can be explained by considering that for the triceps surae the tendon is approximately 6 times longer and has a cross-sectional area approximately 140 times less than the muscle fascicles and belly, respectively (Alexander & Vernon, 1975; Rack et al. 1985).
From our measurement of footplate rotation and contractile displacement we used a linear Hill-type model (Fig. 1B) to calculate the ratio contractile stiffness/series elastic stiffness (Kce/Kse). This model and procedure makes no assumptions about what the series elastic component represents. Strictly it includes all extra-contractile changes in length between the footplate and backboard. The lack of knee motion collinear with the footplate (Fig. 4D), implies that the series elastic component primarily represents the tendons and aponeuroses of the individual muscles in series with the compliant foot. An advantage of this model is that it is immune to assumptions about structures parallel to the muscles because this model does not predict changes in ankle torque. Taking into account some uncertainty regarding the calculation of contractile displacement, the long range ratio (Kce/Kse) is either slightly above or slightly below unity.
Short range stiffness
It is possible that the short range stiffness demonstrated in a single rotation would not be replicated as a steady-state phenomenon during repeated small ankle rotations. However, observation of regular passive rotations shows clearly that contractile displacements are disproportionately small for small rotations (Fig. 5), and that short range contractile stiffness is both considerably higher than series elastic stiffness and reduces with amplitude of rotation (Fig. 6). Application of the model just discussed reveals that these observations are sustained in general for all subjects and that the short range ratio of contractile to series elastic stiffness is substantially greater than the long range ratio (Fig. 7A and B). Depending on some uncertainty in the calculation of contractile displacement, the ratio Kce/Kse might alter by up to 20% but the trend to high contractile stiffness for short rotations is clear.
In addition to calculating the ratio Kce/Kse we wanted to estimate actual values of contractile and series elastic stiffness. In particular we wanted to establish whether an increase in the ratio Kce/Kse for smaller rotations resulted from the contractile element becoming stiffer or the series elastic element (tendon) becoming more compliant. This calculation requires additional assumptions and also requires that we use ankle torque information in addition to footplate rotation and contractile displacement. We used the same Hill-type model to represent a single muscle (Fig. 1B). For each application it was assumed that the muscle used represented the entire triceps surae group. It was also assumed that no changes in ankle torque arise from fluctuations in EMG in, or stretching of, other parallel muscles (e.g. other calf muscles or tibialis anterior) or parallel passive structures (e.g. parallel ligaments and fascia). The assumption of no EMG fluctuations in tibialis anterior was generally true. There may be some passive stiffness in parallel with the muscle–tendon unit and this is unlikely to be more than the long range passive stiffness revealed in Fig. 4D of the preceding companion paper (13%mgh) which places a likely upper limit on the inappropriateness of the model. Thus, the real combination of series elastic (Kse) and contractile (Kce) stiffness is likely to be slightly less than the estimate from this model. The estimates of contractile stiffness of soleus and gastrocnemius are estimates of the triceps surae modelled as a single muscle assuming either soleus or gastrocnemius, respectively, represents that muscle. In general, soleus shows smaller changes in contractile length than gastrocnemius and thus produces higher estimates of contractile stiffness. Thus, a truer estimate of a single triceps surae muscle would be a weighted mean of the soleus- and gastrocnemius-based estimates.
Using this approach, the estimates of normalized contractile stiffness (Kce/mgh) increase non-linearly to very high values (5–10) for small ankle rotation, in good agreement with the values derived from single 7 deg rotations (Fig. 7E). The normalized series elastic stiffness (Kse/mgh) is rather constant (0.77 ± 0.13). As before, the series elastic component includes all extra-contractile changes between the footplate and back support. Repeating the calculation using estimated origin–insertion displacement rather than footplate rotation produces a slightly higher estimate of normalized series elastic stiffness (0.93 ± 0.41). In this case, the value can be attributed to the Achilles tendon rather than a distributed series elastic element incorporating the foot, ankle, knee and hip. These values of series elastic stiffness and Achilles tendon stiffness are similar to values that we have estimated previously (0.91, Loram & Lakie, 2002; 0.9, Loram et al. 2005a; and 0.85, Loram et al. 2005b) and to those estimated by others (Hof, 1998; de Zee & Voigt, 2001). Taking into account the uncertainties of the calculation, the key result is that for small rotations the contractile tissue is much stiffer than the series elastic component. Thus, the tendon, not the muscle provides the weakest series link, limiting the ankle stiffness during the small, low-speed, low-frequency ankle rotations of quiet standing.
We used constant speed, triangular waveform rotations of varying size and duration. This enabled us to show that non-linearities in contractile elongation (Figs 2A and D, and 3A) were not a consequence of variation in rotation speed. The size and duration of the small rotations were chosen to represent those found during quiet standing (0.15 deg, 1 s, Loram et al. 2005b). We consistently found that contractile stiffness varied with the size but not the speed of rotation including the comparison between 7 deg and short rotations. This implies that for sinusoidal rotations in which speed varies during the cycle and also varies with frequency, contractile stiffness would depend on the amplitude and not on the frequency of rotation. This result is consistent with previous studies on isolated cat muscle (Rack & Westbury, 1974) and with previous studies of whole joint ankle stiffness (Kearney & Hunter, 1982).
Dependence of short and long range stiffness on torque level
Our conclusion that tendon, not the muscle, provides the weakest series link, limiting the ankle stiffness for small ankle rotations (Figs 4 and 7) is consistent with the observation that short range stiffness varies only weakly with torque level (Loram & Lakie, 2002). This predicts that increasing muscle activity will make only a slight difference to the low-frequency intrinsic stiffness in quiet standing. Our observation that muscle stiffness decreases to that of (or slightly less than) the tendon for rotations of more than 1 deg (Fig. 4) is consistent with experiments showing that stiffness for rotations of 1 deg or more varies convincingly with torque level (Hunter & Kearney, 1982; Mirbagheri et al. 2000; Casadio et al. 2005). In these cases variation in muscle–tendon stiffness is dominated by variation in contractile stiffness.
The contractile origin of short range stiffness
What is the origin of the short range stiffness that we have measured? We know that it is a property of contractile tissue rather than the tendon. We know that the contractile origin does not depend on the position of the ankle joint. We know that it is a steady-state effect in that it is repeated cycle after cycle of ankle rotation. The stiffness decreases with distance travelled from the previous reversal in ankle rotation. The stiffness reflects the known high stiffness of relaxed or activated muscle for small length changes – the short range elastic component ‘SREC’ (Hill, 1968; Lannergren, 1971) The existence of this stiffness has been amply confirmed in animal and human muscles (Rack & Westbury, 1974; Lakie et al. 1984; Whitehead et al. 2001) and it has been shown to occur in isolated muscle fibres (Campbell & Lakie, 1998; Campbell & Moss, 2002). There is disagreement about its causation, and a cross-bridge mechanism, titin and sarcomeric inhomogeneities have been proposed (reviewed by Proske & Morgan, 1999). The short range stiffness is traditionally thought to have some history dependence with a recovery time-constant of a few seconds (Lakie et al. 1984; Hufschmidt & Schwaller, 1987).
The Hill-type model
On the basis of the Hill-type model it was predicted that combined stiffness of the SEC and contractile element would not change with the amplitude of rotation but would change with the frequency of rotation. In fact the opposite is true. The similarity between the low-frequency values of passive stiffness presented in the preceding companion paper and the high-frequency values reported previously (Loram & Lakie, 2002; Casadio et al. 2005), and the constancy of ankle stiffness with frequency shown by Kearney & Hunter (1982) provides strong evidence that the frequency prediction of the Hill model is incorrect in this context. The stiffness of the complete unit is determined by the series elastic stiffness and the contractile stiffness and under low-frequency postural conditions, compatibility with a tendon of approximately 90%mgh (Loram et al. 2005a) and a low overall passive stiffness of 15%mgh (Peterka, 2002) demanded a contractile stiffness in the region of 15%mgh. The results of this study refute that prediction.
This Hill-type model was derived from large, fast contractions and is essentially inappropriate for describing the short range stiffness that is present during the small oscillations of postural sway (Zahalak, 1981, 1986; Zahalak et al. 1990). In the regime of short range elastic stiffness amplitude of stretch is all important (Rack & Westbury, 1974). An appropriate Hill-type model for human standing would either have local parameters appropriate for the mean, unidirectional sway size in that trial or would model the changing position of the previous sway reversal. This linear model does not represent the progression from the small sways of quiet standing to the larger sways of perturbed balance.
Conclusion
We have found that contractile elongation progresses non-uniformly with ankle rotation in a manner that complements the non-linear sensitivity of muscle spindles. During the small rotations of quiet standing, contractile stiffness is high and stiffness of the muscle tendon unit is determined by the weakest series link which is the tendon. Short range stiffness of whole muscle in vivo is a property of passive contractile tissue, dependent on the amplitude and not the speed or frequency of elongation. The linear Hill-type model makes inappropriate frequency domain predictions and fails to describe the non-linear range-related stiffness relevant to the progression from quiet standing to perturbed balance and movement
Acknowledgments
We would like to thank The Leverhulme Trust for their support of I.D.L. through this project. We would like to thank DIASUS, UK for their help in customizing the ultrasound scanner. We would also like to thank our students Sally Evans, Corrie Fenner, Pete Gunston and Lisa Mazzocchi for their detailed attention and help in carrying out these experiments.
Supplementary material
Online supplemental material for this paper can be accessed at:
http://jp.physoc.org/cgi/content/full/jphysiol.2007.140053/DC1 and http://www.blackwell-synergy.com/doi/suppl/10.1113/jphysiol.2007.140053
References
- Alexander RM, Vernon A. The dimensions of knee and ankle muscles and the forces they exert. J Hum Mov Stud. 1975;1:115–123. [Google Scholar]
- Campbell KS, Lakie M. A cross-bridge mechanism can explain the thixotropic short-range elastic component of relaxed frog skeletal muscle. J Physiol. 1998;510:941–962. doi: 10.1111/j.1469-7793.1998.941bj.x. [DOI] [PMC free article] [PubMed] [Google Scholar]
- Campbell KS, Moss RL. History-dependent mechanical properties of permeabilized rat soleus muscle fibers. Biophys J. 2002;82:929–943. doi: 10.1016/S0006-3495(02)75454-4. [DOI] [PMC free article] [PubMed] [Google Scholar]
- Casadio M, Morasso PG, Sanguineti V. Direct measurement of ankle stiffness during quiet standing: implications for control modelling and clinical application. Gait Posture. 2005;21:410–423. doi: 10.1016/j.gaitpost.2004.05.005. [DOI] [PubMed] [Google Scholar]
- Cordo PJ, Gurfinkel VS. Motor coordination can be fully understood only by studying complex movements. Prog Brain Res. 2004;143:29–38. doi: 10.1016/S0079-6123(03)43003-3. [DOI] [PubMed] [Google Scholar]
- de Zee M, Voigt M. Moment dependency of the series elastic stiffness in the human plantar flexors measured in vivo. J Biomech. 2001;34:1399–1406. doi: 10.1016/s0021-9290(01)00133-6. [DOI] [PubMed] [Google Scholar]
- Grieve D, Gavanagh P, Pheasant S. Prediction of gastrocnemius length from knee and ankle joint posture. In: Asmussen E, Jorgensen K, editors. Biomechanics. Baltimore: University Park Press; 1977. pp. 405–412. [Google Scholar]
- Gurfinkel VS, Lipshits MI, Popov KY. Is the stretch reflex the main mechanism in the system of regulation of the vertical posture of man? Biophysics. 1974;19:761–766. [PubMed] [Google Scholar]
- Herbert RD, Moseley AM, Butler JE, Gandevia SC. Change in length of relaxed muscle fascicles and tendons with knee and ankle movement in humans. J Physiol. 2002;539:637–645. doi: 10.1113/jphysiol.2001.012756. [DOI] [PMC free article] [PubMed] [Google Scholar]
- Hill DK. Tension due to interaction between the sliding filaments in resting striated muscle. The effect of stimulation. J Physiol. 1968;199:637–684. doi: 10.1113/jphysiol.1968.sp008672. [DOI] [PMC free article] [PubMed] [Google Scholar]
- Hof AL. In vivo measurement of the series elasticity release curve of human triceps surae muscle. J Biomech. 1998;31:793–800. doi: 10.1016/s0021-9290(98)00062-1. [DOI] [PubMed] [Google Scholar]
- Hufschmidt A, Schwaller I. Short-range elasticity and resting tension of relaxed human lower leg muscles. J Physiol. 1987;391:451–465. doi: 10.1113/jphysiol.1987.sp016749. [DOI] [PMC free article] [PubMed] [Google Scholar]
- Hunter IW, Kearney RE. Dynamics of human ankle stiffness: variation with mean ankle torque. J Biomech. 1982;15:747–752. doi: 10.1016/0021-9290(82)90089-6. [DOI] [PubMed] [Google Scholar]
- Jeka J, Kiemel T, Creath R, Horak F, Peterka R. Controlling human upright posture: velocity information is more accurate than position or acceleration. J Neurophysiol. 2004;92:2368–2379. doi: 10.1152/jn.00983.2003. [DOI] [PubMed] [Google Scholar]
- Kearney RE, Hunter IW. Dynamics of human ankle stiffness: variation with displacement amplitude. J Biomech. 1982;15:753–756. doi: 10.1016/0021-9290(82)90090-2. [DOI] [PubMed] [Google Scholar]
- Lakie M, Walsh EG, Wright GW. Resonance at the wrist demonstrated by the use of a torque motor: an instrumental analysis of muscle tone in man. J Physiol. 1984;353:265–285. doi: 10.1113/jphysiol.1984.sp015335. [DOI] [PMC free article] [PubMed] [Google Scholar]
- Lannergren J. The effect of low-level activation on the mechanical properties of isolated frog muscle fibers. J Gen Physiol. 1971;58:145–162. doi: 10.1085/jgp.58.2.145. [DOI] [PMC free article] [PubMed] [Google Scholar]
- Loram ID, Lakie M. Direct measurement of human ankle stiffness during quiet standing: the intrinsic mechanical stiffness is insufficient for stability. J Physiol. 2002;545:1041–1053. doi: 10.1113/jphysiol.2002.025049. [DOI] [PMC free article] [PubMed] [Google Scholar]
- Loram ID, Maganaris CN, Lakie M. Paradoxical muscle movement in human standing. J Physiol. 2004;556:683–689. doi: 10.1113/jphysiol.2004.062398. [DOI] [PMC free article] [PubMed] [Google Scholar]
- Loram ID, Maganaris CN, Lakie M. Active, non-spring-like muscle movements in human postural sway: how might paradoxical changes in muscle length be produced? J Physiol. 2005a;564:281–293. doi: 10.1113/jphysiol.2004.073437. [DOI] [PMC free article] [PubMed] [Google Scholar]
- Loram ID, Maganaris CN, Lakie M. Human postural sway results from frequent, ballistic bias impulses by soleus and gastrocnemius. J Physiol. 2005b;564:295–311. doi: 10.1113/jphysiol.2004.076307. [DOI] [PMC free article] [PubMed] [Google Scholar]
- Loram ID, Maganaris CN, Lakie M. Use of ultrasound to make noninvasive in vivo measurement of continuous changes in human muscle contractile length. J Appl Physiol. 2006;100:1311–1323. doi: 10.1152/japplphysiol.01229.2005. [DOI] [PubMed] [Google Scholar]
- Loram ID, Maganaris CN, Lakie M. The passive, human calf muscles in relation to standing: the non-linear decrease from short range to long range stiffness. J Physiol. 2007;584:661–675. doi: 10.1113/jphysiol.2007.140046. [DOI] [PMC free article] [PubMed] [Google Scholar]
- Maganaris CN. Force-length characteristics of in vivo human skeletal muscle. Acta Physiol Scand. 2001;172:279–285. doi: 10.1046/j.1365-201x.2001.00799.x. [DOI] [PubMed] [Google Scholar]
- Maganaris CN. Tensile properties of in vivo human tendinous tissue. J Biomech. 2002;35:1019–1027. doi: 10.1016/s0021-9290(02)00047-7. [DOI] [PubMed] [Google Scholar]
- Maganaris CN. Imaging-based estimates of moment arm length in intact human muscle-tendons. Eur J Appl Physiol. 2004;91:130–139. doi: 10.1007/s00421-003-1033-x. [DOI] [PubMed] [Google Scholar]
- Maganaris CN, Baltzopoulos V, Sargeant AJ. Changes in Achilles tendon moment arm from rest to maximum isometric plantarflexion: in vivo observations in man. J Physiol. 1998;510:977–985. doi: 10.1111/j.1469-7793.1998.977bj.x. [DOI] [PMC free article] [PubMed] [Google Scholar]
- Matthews PBC. Mammalian Muscle Receptors and Their Central Actions. London: Arnold; 1972. [Google Scholar]
- Matthews PBC, Stein RB. The sensitivity of muscle spindle afferents to small sinusoidal changes of length. J Physiol. 1969;200:723–743. doi: 10.1113/jphysiol.1969.sp008719. [DOI] [PMC free article] [PubMed] [Google Scholar]
- Maurer C, Peterka RJ. A new interpretation of spontaneous sway measures based on a simple model of human postural control. J Neurophysiol. 2004 doi: 10.1152/jn.00221.2004. 00221. [DOI] [PubMed] [Google Scholar]
- Maurer C, Peterka RJ. 21.12 A throw-and-catch pattern in postural sway doesnot exclude continuous feedback control. Gait Posture. 2005a;21:S140. [Google Scholar]
- Maurer C, Peterka RJ. A new interpretation of spontaneous sway measures based on a simple model of human postural control. J Neurophysiol. 2005b;93:189–200. doi: 10.1152/jn.00221.2004. [DOI] [PubMed] [Google Scholar]
- Mirbagheri MM, Barbeau H, Kearney RE. Intrinsic and reflex contributions to human ankle stiffness: variation with activation level and position. Exp Brain Res. 2000;135:423–436. doi: 10.1007/s002210000534. [DOI] [PubMed] [Google Scholar]
- Nichols TR, Houk JC. Improvement in linearity and regulation of stiffness that results from actions of stretch reflex. J Neurophysiol. 1976;39:119–142. doi: 10.1152/jn.1976.39.1.119. [DOI] [PubMed] [Google Scholar]
- Peterka RJ. Sensorimotor integration in human postural control. J Neurophysiol. 2002;88:1097–1118. doi: 10.1152/jn.2002.88.3.1097. [DOI] [PubMed] [Google Scholar]
- Powell M. A fast algorithm for nonlineary constrained optimisation calculations. In: Watson G, editor. Lecture Notes in Mathematics. Springer Verlag; 1978. [Google Scholar]
- Proske U, Morgan DL. Do cross-bridges contribute to the tension during stretch of passive muscle? J Muscle Res Cell Motil. 1999;20:433–442. doi: 10.1023/a:1005573625675. [DOI] [PubMed] [Google Scholar]
- Rack PMH, Barnes WJP, Gladden MH. Feedback and Motor Control in Invertebrates and Vertebrates. London: Croom-Helm Ltd; 1985. Stretch reflexes in man: the significance of tendon compliance. [Google Scholar]
- Rack PM, Westbury DR. The short range stiffness of active mammalian muscle and its effect on mechanical properties. J Physiol. 1974;240:331–350. doi: 10.1113/jphysiol.1974.sp010613. [DOI] [PMC free article] [PubMed] [Google Scholar]
- Whitehead NP, Gregory JE, Morgan DL, Proske U. Passive mechanical properties of the medial gastrocnemius muscle of the cat. J Physiol. 2001;536:893–903. doi: 10.1111/j.1469-7793.2001.00893.x. [DOI] [PMC free article] [PubMed] [Google Scholar]
- Winters JM, Winters JM, Woo SLY. Multiple Muscle Systems: Biomechanics and Movement Organization. New York: Springer-Verlag; 1990. Hill-based muscle models: a systems engineering perspective; pp. 69–93. [Google Scholar]
- Zahalak GI. A distribution-moment approximation for kinetic theories of muscular contraction. Math Biosci. 1981;55:89–114. doi: 10.1016/j.mbs.2020.108455. [DOI] [PubMed] [Google Scholar]
- Zahalak GI. A comparison of the mechanical behavior of the cat soleus muscle with a distribution-moment model. J Biomech Eng. 1986;108:131–140. doi: 10.1115/1.3138592. [DOI] [PubMed] [Google Scholar]
- Zahalak GI, Winters JM, Woo SLY. Multiple Muscle Systems: Biomechanics and Movement Organisation. New York: Springer Verlag; 1990. Modelling muscle mechanics (and energetics) pp. 1–23. [Google Scholar]
Associated Data
This section collects any data citations, data availability statements, or supplementary materials included in this article.