

Abstract
Previous results using paired-pulse transcranial magnetic stimulation (TMS) have suggested that the excitability of transcallosal (TC) connections between the hand areas of the two motor cortices is modulated by intracortical inhibitory circuits in the same way as corticospinal tract (CTS) projections to spinal motoneurons. Here we describe two further similarities in TC and CTS control using (1) an I-wave facilitation protocol and (2) preconditioning with rTMS. In experiment 1, excitability of TC pathways was measured using interhemispheric inhibition (IHI) and the ipsilateral silent period (iSP), whilst excitability of CTS pathways was measured by recording the EMG response evoked in the first dorsal interosseous muscle contralateral to the conditioning stimulus (cMEP). The intensity of the conditioning stimulus was first adjusted to threshold for evoking IHI and iSP, then pairs of conditioning stimuli were applied randomly at interstimulus intervals (ISIs) from 1.3 to 4.3 ms. IHI and iSP were facilitated at ISI = 1.5 ms and 3.0 ms, respectively, as was the MEP evoked by the conditioning stimuli in the contralateral hand. We suggest that TC projections receive I-wave-like facilitation similar to that seen in CTS projections. In experiment 2, short interval inhibition of the iSP (SICIiSP), and short interval intracortical inhibition of the cMEP (SICIcMEP) were examined before and after 600 pulses of 5 Hz rTMS at 90% resting motor threshold. Both SICIiSP and SICIcMEP were reduced, as was the iSP; the cMEP was unchanged. This shows that the population of inhibitory interneurons that control TC neurons respond in the same way to 5 Hz rTMS as those that control CTS neurons. Taken together, the data from the two experiments suggest that the layer III and layer V pyramidal neurons that give rise to TC and CTS pathways, respectively, are controlled by neuronal circuitry with similar properties.
Two output pathways from the primary motor cortex (M1) have been investigated using transcranial magnetic stimulation (TMS) – corticospinal output and transcallosal output. Corticospinal output gives rise to contralateral motor-evoked potentials (cMEP) and transcallosal output gives rise to inhibition of the contralateral primary motor cortex (Wassermann et al. 1991; Ferbert et al. 1992; Meyer et al. 1995; Gerloff et al. 1998). Transcallosal output can be measured either as a period of silence in ongoing electromyographic (EMG) activity (ipsilateral silent period; iSP) or as an inhibition of the amplitude of the cMEP evoked by a TMS pulse over the M1 of the contralateral hemisphere (interhemispheric inhibition; IHI). Both these effects have been shown to be absent in some patients with callosal lesions or agenesis of the corpus callosum, and as such they are believed to involve transcallosal pathways (Rothwell et al. 1991; Meyer et al. 1995, 1998; Boroojerdi et al. 1996).
Corticospinal output neurons receive input from several sets of intracortical interneuron networks which can be explored with paired-pulse protocols. Kujirai et al. (1993) used a paired-pulse protocol to demonstrate short-latency intracortical inhibition (SICI), which is probably mediated by GABAA inhibitory interneurons. Another paired-pulse protocol can produce short-interval intracortical facilitation (SICF) occurring at fixed intervals (Tokimura et al. 1996; Ziemann et al. 1998), probably representing short-interval summation of excitatory I-wave interneuron input onto pyramidal neurons (Tokimura et al. 1996; Ziemann et al. 1998; Di Lazzaro et al. 1999).
Recently Trompetto et al. (2004) provided evidence that transcallosal output receives a SICI-like projection suggesting that transcallosal pyramidal neurons have similar inhibitory control as corticospinal pyramidal neurons. In the present paper, we studied if there is an equivalent SICF-like effect in transcallosal pathways. We also asked if these intracortical circuits controlling transcallosal pyramidal neurons are modulated in the same way by the after-effects of 5 Hz rTMS. The data provide further evidence for similarities in control of these two projection systems suggesting that they form parallel output channels from the primary motor cortex.
Methods
Subjects
For experiment 1a, we studied 13 right-handed subjects (5 males and 8 females, mean age 29.2 ± 2.9 years, range 25–39 years). For experiment 1b, we studied 9 right-handed subjects (4 male and 5 female, mean age 32.0 ± 4.9 years, range 26–38 years). For experiment 2, we studied 8 right-handed subjects (5 males and 3 females, mean age 30.0 ± 3 years, range 25–35). All participants gave their written informed consent. The experiments conformed to the standards set by the Declaration of Helsinki and were carried out with approval of the local Ethics Committee. Subjects were seated in a comfortable reclining chair with a mounted head rest during the experiments.
Transcranial magnetic stimulation
Transcranial magnetic stimulation was performed with a pair of linked Magstim 2002 Bistim magnetic stimulators and a single Magstim 200 magnetic stimulator (Magstim Company, Whitland, Dyfed, UK). Two sizes of figure-of-eight coils were used depending on the protocol. For experiments 1a and 2, we used a large coil with wing diameters of 90 mm over the left hemisphere. For experiment 1b, we used two small coils with wing diameters of 70 mm (one over each hemisphere) to allow optimal contact with scalp. The magnetic stimuli produced a monophasic pulse with a rise-time of approximately 100 μs, decaying back to zero over approximately 0.8 ms. The coil was placed tangentially to the scalp with the handle pointing backwards and laterally at a 45 deg angle to the sagittal plane inducing a posterior–anterior current in the brain. This orientation was chosen based on the findings that the lowest motor threshold is achieved when the induced electrical current flows approximately perpendicular to the line of the central sulcus.
We determined the optimal position for activation of the first dorsal interosseus (FDI) muscles by moving the coil in 0.5 cm steps around the presumed motor hand area of the motor cortex of both hemispheres. The sites where stimuli of slightly suprathreshold intensity consistently produced the largest MEPs in corresponding FDI muscle (referred to as ‘motor hot spot’; M1) were marked with a red marker pen by drawing a crescent line following the anterior bifurcation of the coil and a straight line indicating the orientation of the coil.
EMG was recorded with silver disc surface electrodes and were placed in a tendon belly arrangement over the bulk of the FDI muscle and the first metacarpophalangeal joint bilaterally. The ground electrode was placed at the wrist. EMG signals were amplified and filtered (20 Hz to 1 kHz) with a D360 amplifier (Digitimer Limited, Welwyn Garden City, UK). The signals were sampled at 5000 Hz, digitized using a laboratory interface (Power1401, Cambridge Electronics Design (CED), Cambridge, UK) and stored on a personal computer for display and later off-line data analysis. Each recording epoch lasted 400 ms, of which 100 ms preceded the TMS.
Resting motor threshold (RMT) was defined as the minimum stimulus intensity that produced a cMEP of at least 50 μV in 5 out of 10 consecutive trials. Active motor threshold (AMT) was determined during voluntary tonic contraction at 5–10% of maximum voluntary contraction (MVC) and was defined as the minimum intensity which produced a cMEP of at least 200 μV in at least 3 out of 5 consecutive trials. Motor thresholds were expressed as a percentage of maximum stimulator output (MSO).
Repetitive transcranial magnetic stimulation
Focal rTMS was applied over the left M1 with a Magstim Rapid stimulator and a flat figure-of-eight coil with mean loop diameter of 9 cm. The magnetic stimulus had a biphasic waveform with a pulse width of approximately 300 μs. The handle of the coil pointed backwards and laterally at a 45 deg angle from the midline. The coil was placed tangentially to the scalp in the same position used for the single TMS. The RMT was assessed using the Magstim Rapid stimulator as the lowest intensity able to evoke a cMEP of more than 50 μV in at least 5 of 10 consecutive trials in the right relaxed FDI.
The rTMS protocols were in accordance with published safety recommendations (Wassermann, 1998). Background EMG of the right FDI muscle was continuously monitored with audio speakers throughout the entire rTMS session. We applied two conditioning trains of 5 Hz rTMS (600 stimuli in total). The intensity of rTMS was set at 90% RMT. We chose this protocol as Quartarone et al. (2005) demonstrated that it can selectively shape the excitability of the intracortical circuits without significantly affecting corticospinal excitability.
Study design for experiment 1: I-wave interaction
As the relationship between the ipsilateral silent period (iSP) and interhemispheric inhibition (IHI) are not clear, both protocols were examined in separate sub-experiments: experiment 1a for iSP and experiment 1b for IHI.
During experiment 1a, the subjects maintained a contraction of the left FDI at approximately 50% of maximum voluntary contraction (MVC) while the corresponding right FDI remained at rest. The level of contraction was controlled by visual feedback of ongoing EMG activity of the left FDI muscle. This setting allowed us simultaneously to assess MEPs in the right FDI from corticospinal stimulation and iSPs in the left FDI from transcallosal stimulation (Fig. 1).
Figure 1.

Study design of experiment 1a and experiment 1b A single or pair of equal intensity conditioning pulses were delivered to the right M1 during either a voluntary contraction of the right hand (to measure iSP in experiment 1a) or 40 ms before a test stimulus is delivered to the left M1 (to measure IHI in experiment 1b) and recordings were made from FDI muscles in both hands.
Paired-pulse stimulation was performed following a protocol similar to that described by Tokimura et al. (1996) in order to investigate the excitatory interactions that occur at short intervals between two stimuli of identical intensity. To study the iSP, the intensity of the stimuli was set at an intensity that is close to ‘threshold’ for the iSP; for most subjects this was around 150% AMT for both stimuli. Although the intensity used for both stimuli was higher than the one used by Tokimura et al. (1996), a recent study by Ilic et al. (2002) showed that this also could produce SICF. Nine interstimulus intervals (ISI) were studied (1.3, 1.5, 2.0, 2.3, 2.5, 3.0, 3.3, 3.5 and 4.3 ms). Blocks of 30 trials were performed consisting of three randomly intermixed conditions (10 trials for each condition: conditioning stimulus 1 (CS1) given alone and CS1 preceded by CS2 at two different intervals). The three stimulation conditions (CS1, CS2–CS1 at two different ISI) were tested in a pseudo-randomised order within each block. An example of one subject's testing is presented in Table 1.
Table 1.
Example of one subject's testing for experiment 1a
| Test block | CS1 | CS2–CS1 ISI | CS2–CS1 ISI |
|---|---|---|---|
| 1 | Tested | 1.5 ms tested | 2.0 ms tested |
| 2 | Tested | 1.3 ms tested | 2.5 ms tested |
| 3 | Tested | 3.0 ms tested | 4.3 ms tested |
| 4 | Tested | 2.3 ms tested | 3.3 ms tested |
| 5 | Tested | 3.5 ms tested | — |
The reason that all ISIs were not tested in one testing block together with test coil stimulation (TS) and CS1-TS trials was because this would result in a very long testing block (10 conditions × 10 trials each) with associated fluctuating levels of relaxation and brain state.
For experiment 1b, this was a conditioning-test design with a test stimulus preceded 40 ms before by either zero (TS), one (CS1 TS) or two (CS2–CS1 TS) conditioning stimuli of identical intensity to the opposite hemisphere with varying interstimulus intervals (ISI) between CS2 and CS1 (Fig. 1). Interhemispheric inhibition with ISI of 40 ms was chosen as this is believed to be more similar to the ipsilateral silent period than interhemispheric inhibition with shorter ISI (Chen et al. 2003); interhemispheric inhibition at ISI of 8–12 ms was not tested.
The ISI for CS1–CS2 measured in experiment 1b were 1.3, 1.5, 2.0, 2.5, 3.0, 3.3, 3.5 and 4.3 ms, similar to that described by Tokimura et al. (1996). For each interstimulus interval, the four stimulation conditions (TS, CS1 TS and CS2–CS1 TS at two randomly determined ISIs) were tested in a pseudo-randomised order within a testing block. An example of one subject's testing is presented in Table 2.
Table 2.
Example of one subject's testing for experiment 1b
| Test block | TS | CS1 ISI | CS2–CS1 ISI and TS | CS2–CS1 ISI and TS |
|---|---|---|---|---|
| 1 | Tested | Tested | 1.5 ms tested | 2.0 ms tested |
| 2 | Tested | Tested | 1.3 ms tested | 2.5 ms tested |
| 3 | Tested | Tested | 3.0 ms tested | 4.3 ms tested |
| 4 | Tested | Tested | 3.3 ms tested | 3.5 ms tested |
The reason that all ISIs were not tested in one testing block together with TS and CS1 TS trials was because this would result in a very long testing block (10 conditions × 10 trials each) with associated fluctuating levels of relaxation and brain state.
Both coils were used at an orientation to produce an antero-medial current over both M1. Intensity of test coil stimulation (TS) was set to produce a cMEP amplitude of ∼1.5 mV and the intensity of conditioning coil stimulation (CS1 and CS2) was set to 100% RMT. This level of stimulation was chosen so that neither IHI nor the evoked cMEP were saturated.
Study design for experiment 2: effect of rTMS
For experiment 2, a repeated-measures design was used with measurement blocks being conducted before and immediately after a session of rTMS. Short-interval intracortical inhibition was measured using a paired-pulse protocol (Kujirai et al. 1993; Trompetto et al. 2004). The test stimulus was set at an intensity between 150 and 200% AMT where there was a clear iSP recognizable in every trial. In order to evaluate the threshold of inhibition for both iSP and cMEP, various intensities of conditioning stimulus were measured (70, 90, 110 and 130% AMT), starting from 70% AMT that is known to be at or below threshold for inducing SICI (Kujirai et al. 1993; Trompetto et al. 2004).
Four blocks (one for every CS intensity) of 30 trials were performed consisting of three randomly intermixed conditions (10 trials for each condition): TS given alone and TS preceded by CS at two different intervals (2 ms and 3 ms). The four stimulation conditions of different CS intensities were tested in a pseudo-randomised order. iSP and cMEP measurements were carried out in an identical fashion to experiment 1a with contraction of the left FDI at approximately 50% of maximum force while maintaining the corresponding right muscle at rest. The test stimulus intensity was kept constant after rTMS for each subject as was the order of the testing of the conditioning stimuli intensity.
Data analyses of iSP
The method of analysing iSP has been described in previous work (Trompetto et al. 2004). Briefly, the onset and the end of the iSP was assessed in the trace obtained from the average of the 10 rectified EMG traces for each condition. The iSP onset was defined as the point after the cortical stimulation at which EMG activity became constantly (minimum duration of 10 ms) under the mean amplitude of EMG activity preceding the cortical stimulus (mean EMG). The iSP end was defined as the first point after iSP onset at which the level of EMG activity regained the mean EMG. The experimenter was not blinded to the condition during analysis and this was not considered necessary as the measurement of iSP used a standardized method that has been previously used (Trompetto et al. 2004) as follows:
For each condition, the area of the iSP was calculated, using the following formula, where aur_iSP is the area under rectified iSP:
Then, the iSP area was normalized against the level of contraction using the formula:
Finally, in experiment 1a, to compare the conditioned iSP against test iSP, the absolute difference between the normalized iSP area in both responses was used. This simple subtraction was used because the it is unknown whether iSP summates linearly or non-linearly.
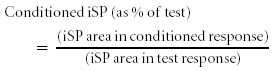
However, in experiment 2, as the inhibition of iSP was being measured (rather than a summation of iSP), we normalized the conditioned iSP against the test iSP and expressed the result as a percentage:
 |
Data analyses of IHI
Peak-to-peak amplitude of MEP contralateral to the test stimulus (i.e. ipsilateral to the conditioning pulses CS1 and CS2) was measured. Again, it is not known if the IHI would summate linearly or non-linearly. As such, conditioned IHI was analysed as raw peak-to-peak amplitude and absolute difference of peak-to-peak amplitude to unconditioned IHI.
Data analyses of cMEP
Peak-to-peak amplitude of cMEP contralateral to the conditioning pulses (CS1 and CS2) was measured. Although it is standard practice to normalize the conditioned cMEP to double the unconditioned cMEP to demonstrate SICF (Tokimura et al. 1996; Ziemann et al. 1998), it is not known if the facilitation is a linear or non-linear phenomenon particularly at the higher intensities used. As such, conditioned cMEP, like IHI was analysed as raw peak-to-peak amplitude and absolute difference of peak-to-peak amplitude to unconditioned cMEP.
Statistical analyses
For experiment 1a and 1b, two-factorial repeated-measures ANOVAs with factors ‘CS mode’ (CS1 and CS2–CS1) and ‘ISI’ (1.3, 1.5, 2.0, 2.3 2.5, 3.0, 3.3, 3.5 and 4.3 ms) were performed for iSP, IHI and cMEP on the raw peak-to-peak MEP amplitude or absolute iSP area. Note that data for CS1 were used twice when compared with two ISIs of CS2–CS1 as each testing block consisted of two ISIs (see above, Study design of experiment 1). One-factorial repeated-measures ANOVA with factor ‘ISI’ (1.3, 1.5, 2.0, 2.3 2.5, 3.0 ms, 3.3, 3.5 and 4.3 ms) was also performed with all the various methods of correction for cMEP, IHI and iSP (i.e. absolute differences between conditioned and baseline measures or normalized to baseline measure). For post hoc comparisons, a Tukey's least significant difference (LSD) test was used for all the various methods of correction for cMEP, IHI and iSP.
Correlations between conditioned IHI with the cMEP were calculated by Pearson's linear correlation representing conditioned IHI and conditioned cMEP as absolute difference or normalized.
Any correlations of conditioned cMEP with conditioned IHI or iSP were performed comparing equivalently corrected values (i.e. normalized cMEP with normalized IHI, absolute difference cMEP with absolute difference IHI). Also, for correlating the change in iSP area or duration with the change in the cMEP amplitude, only data from subjects in which the test iSP was reliably present from the test stimulus alone were used.
For experiment 2, two-tailed Student's paired t test was used to compare the single-pulse measures (the motor thresholds, iSP, the duration of the iSP and the amplitude of the cMEP) in the test responses before and after the rTMS.
The effect of the paired-pulse stimulation before rTMS was analysed using a two-factorial analysis of variance (ANOVA) for repeated measures using the factors ‘Intensity’ (70, 90, 110 and 130% AMT) and the ‘Mode of stimulation’ (single test-pulse, paired-pulse with 3 ms ISI and paired-pulse with 2 ms ISI). The analysis was performed with the raw data of iSP area and cMEP obtained before the rTMS. If ANOVA showed a significant effect, we performed post hoc comparisons using the Tukey's LSD test to compare directly the experimental conditions. This was to determine which intensities of conditioning stimulation produced significant effects on SICIiSP and SICIcMEP compared with baseline.
To analyse the effect of rTMS on paired-pulse stimulation, only intensities where there was SICIiSP and SICIcMEP at baseline (from above) were analysed using the normalized iSP and cMEP. A three-factorial ANOVA for repeated measures was performed using the factors ‘Intensity’ (intensities where there was significant SICIiSP or SICIcMEP at baseline), ‘Time’ (before rTMS, after rTMS) and ‘ISI’ (2 ms ISI, 3 ms ISI).
For all ANOVAs, the Greenhouse–Geisser method was used if necessary to correct for non-sphericity and post hoc Tukey's (LSD) tests were done for significant results to compare directly the experimental conditions.
Significance for all procedures was set at a level of 0.05. All statistical analysis was conducted with SPSS 12.0 (SPSS for Windows 12.0 Chicago: SPSS, 2004). Numerical data are mean ±s.d. unless otherwise stated.
Abbreviations
CTS, corticospinal; TC, transcallosal; CS, conditioning stimulus; TS, test stimulus; iSP: ispilateral silent period; IHI, interhemispheric inhibition; SICF, short-interval intracortical facilitation; SICIcMEP, short-interval intracortical inhibition of the corticospinal pathway; SICIiSP, short-interval intracortical inhibition of the transcallosal pathway; SICI2ms, short-interval intracortical inhibition with 2 ms interstimulus interval; SICI3ms, short-interval intracortical inhibition with 3 ms interstimulus interval; SICIcomb, short-interval intracortical inhibition averaged for 2 ms and 3 ms interstimulus intervals; cMEP, contralateral motor-evoked potential; MEP, motor-evoked potential; RMT, resting motor threshold; AMT, active motor threshold; MSO, maximum stimulator output; rTMS, repetitive transcranial magnetic stimulation; TMS, transcranial magnetic stimulation; FDI, first dorsal interosseus; ISI, interstimulus interval.
Results
None of the participants reported any adverse effect during the course of the study.
Experiment 1a: demonstration of SICF-like effects on iSP
As noted in the Methods, the intensity of the TMS pulses was adjusted in each subject so that CS2 alone produced a just visible iSP in the contracting FDI muscle. CS1 was applied at the same intensity. The mean intensity of the stimuli used was 44 ± 10% of the maximum stimulator output, or 156 ± 11% AMT. We measured the area and duration of the iSP as well as the amplitude of the MEP evoked by CS1 alone in the relaxed contralateral FDI (iSPCS1, cMEPCS1) and when conditioned by CS2 (iSPCS2CS1, cMEPCS2-CS1).
Figure 2 illustrates an example of the interaction between two stimuli of equal intensity delivered at different ISI on the cMEP and the iSP in a representative subject. It is clear that at specific intervals for both the cMEP and the iSP, the response to pairs of stimuli depended on the interstimulus interval between conditioning stimuli CS2 and CS1.
Figure 2.

Effect of two stimuli delivered at different ISI (1.5, 2 and 3 ms) on the contralateral MEP in the right relaxed FDI muscle (left panel) and on the iSP in the left FDI muscle during a contraction of about 50% of the maximal voluntary contraction (right panel) in experiment 1a The first trace represents the control response (due to the test stimulus alone) in the contralateral and ipsilateral muscle, while the other three traces represent the responses due to a paired stimulation (test stimulus + conditioning stimulus at 1.5, 2.0 and 3.0 ms interstimulus intervals).
Due to the difficulty determining the most suitable way to represent conditioned iSP to the test-iSP, various methods of analysis were used, as follows: (1) absolute values of conditioned iSP area and test iSP area (Fig. 3A); (2) absolute values of conditioned iSP duration and test iSP duration (Fig. 3B); (3) absolute difference between conditioned iSP area and test iSP area (Fig. 3D); (4) absolute difference between conditioned iSP duration and test iSP duration (Fig. 3E).
Figure 3.

The effect of paired-pulse stimulation on the iSP and cMEP A, ipsilateral silent period (iSP) area in the left first dorsal interosseus in response to single or paired transcranial magnetic stimulation to the right primary motor cortex (dashed lines, test iSP area mean ±s.e.m.; continuous line and triangles, conditioned iSP area, respectively); B, iSP duration in response to single or paired transcranial magnetic stimulation in the left first dorsal interosseus (test iSP duration, dashed lines; conditioned iSP duration, continuous line and triangles, respectively); C, peak-to-peak MEP amplitude of the right first dorsal interosseus in response to single or paired stimuli (dashed line, mean range of CS1; CS2–CS1, continuous line and triangles) measured simultaneous to (A–B); D, absolute difference of the MEP amplitude of the right first dorsal interosseus with CS2–CS1 stimulation (conditioned cMEP) and CS1 stimulation (baseline cMEP); E, absolute difference of the iSP duration of CS2–CS1 stimulation (conditioned iSP duration) with iSP duration of CS1 stimulation; F, absolute difference of the MEP amplitude of right first dorsal interosseus with CS2–CS1 stimulation (conditioned cMEP) with the MEP amplitude of CS1 stimulation (baseline cMEP). In all graphs, the abscissa indicates the blocks of interstimulus interval between CS2 and CS1, and the error bars represent s.e.m.Post hoc differences are described in Table 3 and not shown for simplicity. Number of subjects in all graphs was 13.
The various methods of analysis were also used for cMEP for consistency, as follows: (1) absolute values of conditioned cMEP and test cMEP (Fig. 3C); (2) absolute difference between conditioned cMEP and test cMEP (Fig. 3F).
From the above figures, it is clear that no matter how the data are expressed, all three measures depend on the ISI between CS2 and CS1. In summary, the area and duration of the iSP as well as the amplitude of the cMEP seem to peak at ISIs 1.5 and 3 ms. This was borne out in the statistical analysis summarized in Table 3. A two-factor ANOVA of repeated measures on the raw data (Fig. 3A–C) with ‘CS mode’ and ‘ISI’ as main factors revealed a significant interaction between ‘CS mode’ and ‘ISI’. Follow-up one-factor ANOVAs with ‘ISI’ as main factor showed significant effects for iSP area and cMEP amplitude, indicating that these measures depended on the interval between CS1 and CS2. Post hoc analysis of the data was conducted to test for intervals where paired CS2–CS1 conditioning produced significant differences to the effect of CS1 alone (Table 3C). The results varied depending on the method of analysis, but in general confirmed that maximum effects occurred with ISIs of 1.5 and 3 ms. It is not possible to compare the post hoc effects of cMEP as there was no consensus on how high-intensity stimulation of the CTS (∼150% AMT) would summate (linearly or non-linearly) but it is well established that whatever the manner of summation, the peaks of facilitatory interaction would occur at 1.5 ms and 3.0 ms (Tokimura et al. 1996; Ziemann et al. 1998).
Table 3A.
Two-way ANOVA with ‘CS mode’ and ‘ISI
| iSP area | iSP duration | cMEP | |||||||
|---|---|---|---|---|---|---|---|---|---|
| d.f. | F | P | d.f. | F | P | d.f. | F | P | |
| ‘CS mode’ | 1 | 31.127 | <0.001 | 1 | 22.691 | <0.001 | 1 | 17.221 | <0.001 |
| ISI′ | 8 | 2.869 | 0.039 | 8 | 2.236 | 0.089 | 8 | 3.048 | 0.035 |
| ‘CS mode’×’ISI’ | 8 | 2.685 | 0.048 | 8 | 1.759 | 0.160 | 8 | 7.846 | <0.001 |
Table 3C.
Post hoc tests
| ISI | Conditioned iSP area 3 vs. test iSP area |
|---|---|
| 1.3 ms | P = 0.001 |
| 1.5 ms | P < 0.001 |
| 2.0 ms | n.s. |
| 2.3 ms | n.s. |
| 2.5 ms | P = 0.006 |
| 3.0 ms | P = 0.001 |
| 3.3 ms | P = 0.024 |
| 3.5 ms | n.s. |
| 4.3 ms | P = 0.013 |
A, two-factorial ANOVA for experiment 1a with factors ‘CS mode’ and ‘ISI’ using peak-to-peak MEP amplitude for 11 subjects; B, one-factorial ANOVA for experiment 1a with factor ‘ISI’ comparing absolute differences of conditioned iSP area, iSP duration or cMEP with baseline test measures for 11 subjects; C, post hoc Tukey's t test comparing raw values of conditioned and unconditioned iSP area. n.s. indicates non-significance (P≥ 0.05).
Table 3B.
One-way ANOVA with factor ‘ISI’
| Conditioned iSP area Absolute Δ | Conditioned iSP duration Absolute Δ | Conditioned cMEP Absolute Δ | |
|---|---|---|---|
| d.f. | 8 | 8 | 8 |
| F | 2.685 | 1.759 | 7.846 |
| P | 0.048 | 0.160 | <0.001 |
A correlation analysis was performed to test whether absolute differences of conditioned iSP area or conditioned iSP duration correlated with the amplitude of the conditioned cMEP over all ISIs. Only subjects in whom CS2 alone evoked a measurable iSP in every trial were included in the analysis (n = 8 subjects out of 13 subjects). The data showed a significant linear correlation for conditioned iSP area (expressed as iSPCS2CS1– iSPCS1) (Fig. 4A, r = 0.262, P = 0.026, n = 72). Linear correlation for the absolute difference in conditioned iSP duration was not significant (Fig. 4B, r = 0.101, P = 0.398, n = 72).
Figure 4.

Correlations between iSP and cMEP Linear correlations of conditioned iSP area (A), or conditioned iSP duration (B) with conditioned cMEP represented as absolute difference between conditioned response and test response, for 9 interstimulus intervals (1.3, 1.5, 2.0, 2.3, 2.5, 3.0, 3.3, 3.5 and 4.3 ms) of 8 subjects with iSP reliably present in every trace with a single stimulus (13 subjects were tested in total but 5 did not have a reliable iSP). The continuous line represents the linear correlation; the dotted lines represent the 95% confidence interval of the correlation.
Experiment 1b: demonstration of SICF-like effects on IHI
In this experiment, TMS pulses (CS2, CS1) were applied to the right M1 in order to evoke IHI of test MEPs evoked from the left M1. We measured the amplitude of the contralateral MEPs from both hemispheres. Stimulus intensities were adjusted so that the test stimulus (TS) on the left hemisphere evoked a cMEP of about 1 mV; the conditioning intensity was adjusted to give a minimal amount of IHI with CS1 alone. The mean of intensity of TS was 116 ± 5% RMT and the mean of intensity of CS1 and CS2 was 99 ± 6% RMT (or 135 ± 10% AMT). The test stimulus alone produced a cMEP amplitude of 1.30 ± 0.13 mV, which was suppressed by the conditioning stimulus CS1 to 1.12 ± 0.15 mV (85.7 ± 9.7%) of the test stimulus; paired t test, P < 0.01, n = 9) (Fig. 5A).
Figure 5.

The effect of paired-pulse stimulation on IHI and cMEP A, peak-to-peak MEP amplitude of the left first dorsal interosseus in response to single, paired or triple stimuli (bold line, mean range of TS ±s.e.m.; dashed line, mean range of CS1 TS; CS2–CS1 TS, continuous line and triangles, respectively); B, peak-to-peak MEP amplitude of the right first dorsal interosseus in response to single or paired stimuli (dashed line, mean range of CS1; CS2–CS1, continuous line and triangles, respectively) measured simultaneous to (A–C); C, absolute difference of the MEP amplitude of the left first dorsal interosseus with CS2–CS1 TS stimulation (conditioned IHI) and CS1 TS stimulation (baseline IHI); D, absolute difference of the MEP amplitude of the right first dorsal interosseus with CS2–CS1 stimulation (conditioned cMEP) and CS1 stimulation (baseline cMEP). In all graphs, the abscissa indicates the interstimulus interval between CS2 and CS1, and the error bars represent s.e.m. Post hoc differences are described in Table 4 and are not shown for simplicity. Number of subjects was 9 in all graphs.
The principal finding was that the addition of CS2 increased the amount of interhemispheric inhibition over that seen with CS1 alone at specific intervals. Figure 5 shows measures of the (transcallosally inhibited) cMEP evoked from the right hemisphere (Fig. 5A and C), as well as the cMEP evoked by CS2 and CS1–CS2 from the left hemisphere (Fig. 5B and D). At the same intervals that the amount of IHI was maximal, the amplitudes of the cMEPs evoked by CS2–CS1 were largest. The top two graphs (A and B) plot absolute amplitudes of MEP, and the bottom two graphs (C and D) show the data expressed as differences in the amplitudes of responses with CS1 alone and CS2–CS1 together.
Table 4 gives the statistical analysis of the results. Two-way repeated measures ANOVA with factors ‘CS mode’ and ‘ISI’ for MEP amplitude showed a significant ‘CS mode’בISI’ interaction (Table 4A, P < 0.05). Post hoc one-way ANOVAs with ‘ISI’ as main factor (Table 4B) confirmed that no matter which way the data were analysed, the amount of IHI as well as the amplitude of the cMEP elicited from the right (CS2–CS1) hemisphere varied with ISI. Paired comparisons was performed and the ISI of largest differences of IHI was at ISIs of about 1.5 and 3 ms (Table 4C). Post hoc tests of ISI on cMEP were not performed as there was no consensus on how high-intensity stimulation of the CTS (∼135% AMT) would summate (linearly or non-linearly) but it is well established that whatever the manner of summation, the peaks of facilitatory interaction would occur at 1.5 ms and 3.0 ms (Tokimura et al. 1996; Ziemann et al. 1998).
Table 4A.
Two-way ANOVA with ‘CS mode’ and ‘ISI’
| IHI | cMEP | |||||
|---|---|---|---|---|---|---|
| d.f. | F | P | d.f. | F | P | |
| ‘CS mode’ | 1 | 14.316 | 0.005 | 1 | 34.120 | <0.001 |
| ‘ISI’ | 7 | 0.689 | 0.680 | 7 | 3.024 | 0.009 |
| ‘CS mode’×’ISI’ | 7 | 2.625 | 0.020 | 7 | 4.511 | <0.001 |
Table 4B.
One-way ANOVA with factor ‘ISI’
| Conditioned IHI Absolute Δ to baseline IHI | Conditioned cMEP Absolute Δ to 1 × baseline cMEP | |
|---|---|---|
| d.f. | 7 | 7 |
| F | 2.625 | 4.511 |
| P | 0.020 | <0.001 |
Table 4C.
Post hoc tests
| ISI | 1 × conditioned IHI versus 1 × baseline IHI |
|---|---|
| 1.3 ms | n.s. |
| 1.5 ms | P = 0.019 |
| 2.0 ms | n.s. |
| 2.5 ms | n.s. |
| 3.0 ms | P = 0.018 |
| 3.3 ms | P = 0.043 |
| 3.5 ms | P = 0.037 |
| 4.3 ms | n.s. |
A, two-factorial ANOVA for experiment 1b with factors ‘CS mode’ and ‘ISI’ using peak-to-peak MEP amplitude of baseline IHI and conditioned IHI or baseline cMEP and conditioned cMEP for 9 subjects. B, one-factorial ANOVA for experiment 1b with factor ‘ISI’ comparing conditioned IHI or cMEP and baseline IHI and cMEP for 9 subjects. C, post hoc Tukey's t test comparing peak-to-peak MEP amplitudes of conditioned IHI to baseline IHI. n.s. indicates non-significance (P > 0.05).
As with the iSP, we next asked whether ISI affected IHI and cMEP in the same way. The conditioned IHI (CS2–CS1 TS) and the conditioned cMEP (CS2–CS1) showed a significant negative correlation across the eight interstimulus intervals in all subjects regardless of method for data analysis (Fig. 6, P < 0.05, n = 72).
Figure 6.

Correlation between IHI and cMEP Linear correlations of conditioned IHI amplitude with conditioned cMEP amplitude represented as absolute difference measures, respectively, for 8 interstimulus intervals (1.3, 1.5, 2.0, 2.5, 3.0, 3.3, 3.5 and 4.3 ms) of all 9 subjects. The continuous line represents the linear correlation; the dashed lines represent the 95% confidence interval of the correlation.
Experiment 2: effect of rTMS on SICI-like conditioning of the iSP and cMEP
Here we ask whether these two effects are influenced in the same way by pre-conditioning M1 with rTMS at 5 Hz. rTMS was applied at an intensity of 90% RMT, which was equal to 39 ± 5% maximal stimulator output (MSO). The TS intensity was set to evoke a cMEP of approximately 1 mV; this intensity was the same before and after rTMS (63 ± 6.8% MSO before and 62 ± 7.7% MSO after). Pre-conditioning with rTMS decreased the area of the iSP evoked by TS alone (P < 0.01) but had no effect on the amplitude of the cMEP (Table 5).
Table 5.
Active and resting motor threshold, resting MEP amplitudes, resting iSP area and duration of the iSP before and after 600 stimuli of subthreshold 5 Hz rTMS to the left M1
| Parameter | Before rTMS | After rTMS | t test |
|---|---|---|---|
| RMT (% of maximal stimulator output) | 33.1 ± 6.1 | 33.8 ± 6.2 | n.s. |
| AMT (% of maximal stimulator output) | 25.3 ± 4.9 | 25.0 ± 4.6 | n.s. |
| Mean cMEP amplitude during ipsilateral contraction (mV). | 3.1 ± 1.9 | 3.2 ± 1.9 | n.s |
| Mean iSP area (mv.ms) | 0.16 ± 0.07 | 0.14 ± 0.06 | P < 0.01 |
| iSP duration (ms) | 33.5 ± 9.2 | 30.5 ± 10.4 | n.s. |
RMT, resting motor threshold; AMT, active motor threshold; n.s., not significant; each value corresponds to the mean (±s.e.m.) of nine subjects.
In the ‘classical’ SICI protocol of Kujirai et al. (1993), a subthreshold conditioning stimulus (CS) is used to suppress the cMEP evoked 2–3 ms later by a suprathreshold test stimulus (TS); we refer to this as SICIcMEP. Trompetto et al. (2004) recently showed that the CS also had a similar effect in reducing the area of the iSP evoked in the ipsilateral contracting muscle by the TS (SICIiSP). We reproduced this finding at baseline pre-rTMS (Fig. 7, Table 6) showing that SICIcMEP and SICIiSP occur at 90 to 130% AMT but not at 70% AMT (Fig. 7, Table 6A and B). The two-factorial repeated measures ANOVA for ‘Conditioning intensity BLOCK’ and ‘Mode of stimulation’ and the post hoc analysis (Table 6A and B) clearly indicate that the threshold for inducing SICIcMEP and SICIiSP during contraction was 90% AMT and above. This lack of conditioning effect at 70% AMT is similar to the original finding where SICIcMEP and SICIiSP were only reliably found at 80% RMT (Trompetto et al. 2004).
Figure 7.

A and B, effect of the conditioning stimulus on the cMEP (A) and iSP area (B) before and after the rTMS combined for 2 ms and 3 ms ISI. Abscissa indicates the CS intensity expressed as a percentage of the active motor threshold. Ordinate indicates the size of the conditioned response, expressed as a percentage of the unconditioned test response (continuous line pre-rTMS, dotted line post-rTMS).
Table 6A.
Two-factorial ANOVA of SICIcMEPand SICIiSPbefore rTMS
| Factor(s) | Absolute cMEP | Absolute iSP area | ||
|---|---|---|---|---|
| F | P | F | P | |
| ‘Conditioning intensity block’ | 0.6 | 0.618 | 0.3 | 0.852 |
| ‘Mode of stimulation’ | 10.2 | 0.011* | 12.3 | 0.001* |
| ‘Conditioning intensity block’×’Mode of stimulation’ | 7.5 | <0.001* | 3.2 | 0.01* |
Table 6B.
Post hoc analysis
| Factor | Comparison | cMEP | iSP area |
|---|---|---|---|
| ‘Mode of stimulation’ | Test pulse only vs. 2 ms paired-pulse | 0.004* | 0.007* |
| Test pulse only vs. 3 ms paired-pulse | 0.018* | 0.002* | |
| ‘Conditioning intensity block’ × ’Mode of stimulation’ | |||
| 70% AMT (2 ms paired-pulse vs. test pulse only) | 0.399 | 0.067 | |
| 70% AMT (3 ms paired-pulse vs. test pulse only) | 0.528 | 0.943 | |
| 90% AMT (2 ms paired-pulse vs. test pulse only) | 0.008* | 0.007* | |
| 90% AMT (3 ms paired-pulse vs. test pulse only) | 0.047* | 0.005* | |
| 110% AMT (2 ms paired-pulse vs. test pulse only) | 0.027* | 0.023* | |
| 110% AMT (3 ms paired-pulse vs. test pulse only) | 0.032* | 0.030* | |
| 130% AMT (2 ms paired-pulse vs. test pulse only) | 0.005* | 0.044* | |
| 130% AMT (3 ms paired-pulse vs. test pulse only) | 0.013* | 0.010* |
A, two-factorial ANOVA with repeated measures of absolute cMEP amplitude or absolute iSP area before rTMS using the following factors: ‘Conditioning intensity block’ (70% AMT, 90% AMT, 110% AMT, 130% AMT) and ‘Mode of stimulation’ (test pulse only, 2 ms paired-pulse, 3 ms paired-pulse) for 8 subjects. B, post hoc analysis of the significant interactions indicating that the conditioning intensity 70% AMT was significantly different from 90–130% AMT and was not significantly different from test pulse alone. For both parts of the table
indicates significant effect of at least P < 0.05.
Effect of rTMS on SICIcMEP and SICIiSP
The next question was whether 600 stimuli of 5 Hz rTMS at 90% RMT affected SICIcMEP and SICIiSP. As there was no SICIcMEP and SICIiSP at 70% AMT (as shown by Table 6A and B), 70% AMT was excluded from the ANOVA analysis. Six hundred stimuli of 5 Hz rTMS at 90% RMT decreased SICIcMEP (Fig. 8, Table 7) This was confirmed by a significant effect of ‘Time’ (F(1) = 6.84, P = 0.035) in a 3-factor ANOVA with ‘Time’, ‘Intensity’ and ‘ISI’ as factors. rTMS also decreased SICIiSP (Fig. 8, Table 7), again with a main effect of ‘Time’ (F = 10.71, P = 0.014) in a 3-factor ANOVA (note that in Fig. 7, SICIcMEP and SICIiSP were shown as averaged for both ISIs for simplicity as ISI did not produce any significant interaction with itself or any other factors in Table 7).
Figure 8.

Effect of varying ISI of the conditioning stimulus on the cMEP before rTMS (A), cMEP after rTMS (B), iSP area before rTMS (C) and iSP area after rTMS (D) Abscissa indicates the CS intensity expressed as a percentage of the active motor threshold. Ordinate indicates the size of the conditioned response, expressed as a percentage of the unconditioned test response (continuous line and squares, SICI2ms, dotted line and triangles, SICI3ms).
Table 7.
Three-factorial ANOVA of SICIcMEPand SICIiSPbefore and after rTMS
| Factor(s) | cMEP | iSP area | ||
|---|---|---|---|---|
| F | P | F | P | |
| ‘Time’ | 6.81 | 0.035* | 10.72 | 0.014* |
| ‘Intensity’ | 24.78 | < 0.001* | 1.89 | 0.187 |
| ‘ISI’ | 4.39 | 0.074 | 0.11 | 0.752 |
| ‘Time’ × ’Intensity’ | 0.32 | 0.730 | 0.10 | 0.908 |
| ‘Time’ × ’ISI’ | 0.83 | 0.391 | 3.08 | 0.122 |
| ‘ISI’ × ’Intensity’ | 3.39 | 0.630 | 1.25 | 0.316 |
| ‘Time’ × ’Intensity’ × ’ISI’ | 1.10 | 0.360 | 0.86 | 0.446 |
Three factorial ANOVA with repeated measures using the following factors: ‘Time’ (pre-rTMS, post-rTMS); ‘Intensity’ (90% AMT, 110% AMT, 130% AMT) and ‘ISI’ (2 ms paired-pulse, 3 ms paired-pulse) for 8 subjects. 70% AMT conditioning intensity was excluded from the analysis as Table 6 shows that there are no SICI effects at that intensity.
Significant effect of at least P < 0.05.
To compare the effects of rTMS on SICIcMEP and SICIiSP, we applied a three-factorial ANOVA of repeated measures using the following factors: ‘Measure’ (cMEP, iSP area), ‘Time’ (pre-rTMS, post-rTMS) and ‘Intensity’ (90% AMT, 110% AMT, 130% AMT) (Table 8). This showed a significant effect of ‘Time’ as well as a significant ‘Measure’×’Intensity’ interaction (F = 4.93, P = 0.024) with a post hoc significant difference at a conditioning intensity of 130% AMT. In Fig. 8A and B at 130% AMT, SICIiSP saturates unlike SICIcMEP which is confirmed on post hoc analysis showing at 130% AMT (P = 0.037) There is however, no significant interaction for ‘Measure’בTime’ (F = 3.46, P = 0.105) and ‘Measure’בTime’בConditioning intensity’ (F < 0.0001, P = 0.999), suggesting that there are no large differences in effect of rTMS on SICIiSP and SICIcMEP.
Table 8A.
Three-factorial ANOVA directly comparing SICIcMEPwith SICIiSP
| Factor(s) | F | P |
|---|---|---|
| ‘Measure’ | 2.67 | 0.147 |
| ‘Time’ | 24.64 | 0.002* |
| ‘Intensity’ | 16.24 | <0.001* |
| ‘Measure’ × ‘Time’ | 3.46 | 0.105 |
| ‘Measure’ × ’Intensity’ | 4.93 | 0.024* |
| ‘Time’ × ’Intensity’ | 0.377 | 0.693 |
| ‘Measure’ × ‘Time’ × ’Intensity’ | <0.0001 | N/A |
Table 8B.
Post hoc analysis
| Factor(s) | Comparison | P |
|---|---|---|
| ‘Measure’ × ‘Intensity’ | cMEP at 90% AMT vs. iSP at 90% AMT | 0.991 |
| cMEP at 110% AMT vs. iSP at 110% AMT | 0.410 | |
| cMEP at 130% AMT vs. iSP at 130% AMT | 0.037* |
A, three factorial ANOVA with repeated-measures using the following factors: ‘Measure’ (cMEP, iSP area) ‘Time’ (pre-rTMS, post-rTMS) and ‘Conditioning intensity’ (90% AMT, 110% AMT, 130% AMT) for 8 subjects. B, post hoc analysis of the significant interactions indicating that at 130% AMT, SICIiSP appears to saturate but not SICIcMEP. For both parts of the table,
indicates significant effect of at least P < 0.05.
Discussion
TMS of the motor cortex evokes activity in the corticospinal system that is detected by measuring the amplitude of MEPs. The excitability of this system is controlled by a number of intrinsic cortical circuits that have been explored with paired-pulse TMS methods. Of these, the best described are short interval intracortical inhibition (SICI) and short interval intracortical facilitation (SICF) that are thought to be due to activity in local GABAA inhibitory interneurons and repetitive facilitatory I-wave input, respectively. In their turn these inputs are modulated by other factors; for example, SICI is suppressed for several minutes after a short train of subthreshold rTMS at 5 Hz to motor cortex (Peinemann et al. 2000; Di Lazzaro et al. 2002; Quartarone et al. 2005).
In addition to activation of the corticospinal output, motor cortex stimulation can evoke activity in transcallosal projections. These produce a silent period in the EMG of contracting ipsilateral muscles (iSP) as well as interhemispheric inhibition (IHI) of MEPs evoked from the opposite motor cortex. Recently Trompetto et al. (2004) showed that transcallosal outputs from motor cortex receive inhibitory input analogous to corticospinal SICI. We refer to this as SICIiSP to distinguish it from the usual corticospinal SICI (SICIcMEP). The present experiments extend these similarities between corticospinal and transcallosal systems by showing that (1) transcallosal outputs have SICF-like properties, and (2) SICIiSP is reduced by 5 Hz rTMS in the same way as SICIcMEP. We suggest that the data are compatible with a model in which the transcallosally projecting pyramidal neurones of cortical layer III are controlled by circuits similar to those that control layer V pyramidal neurones of the corticospinal tract. However, it should be noted that there are multiple interhemispheric effects. We only tested IHI at an ISI of 40 ms; IHI at short intervals (8–12 ms) may have a different mechanism (Chen et al. 2003). In addition, very low-intensity conditioning pulses evoke a weak interhemispheric facilitation that has another mechanism (Ugawa et al. 1993; Hanajima et al. 2001). No firm conclusions can be made about interneuronal control of these other pathways.
Site of facilitatory interaction
We investigated transcallosal output with two methods: the ipsilateral silent period (iSP), and paired-pulse interhemispheric inhibition (IHI). As noted in the introduction, there is good evidence that both effects are mediated predominantly by pathways running through the corpus callosum, presumably in the transcallosal axons of layer III pyramidal neurones (Jacobson & Trojanowski, 1974; Jones et al. 1979).
Experiments 1a and 1b showed that if the intensity of the conditioning stimulus was reduced to threshold levels for iSP or IHI, pairs of stimuli at intervals of around 1.5 and 3.0 ms consistently produced much greater transcallosal inhibition than for other intervals. Since this time course is exactly the same as SICF on cMEP (Tokimura et al. 1996; Ziemann et al. 1998), the most parsimonious explanation is that a similar mechanism is involved.
As it is unknown if IHI and iSP summates linearly or non-linearly, post hoc tests were done on absolute data. As such, cautious interpretation of post hoc tests is necessary. However, whatever the method of analysis, it is clear that the interstimulus intervals where post hoc differences are consistently largest are interstimulus intervals of 1.5 ms and 3.0 ms; conversely, whatever the method of analysis, the interstimulus intervals where there were no post hoc differences in iSP area, iSP duration and IHI were 2.0 ms.
Nevertheless whatever the method of data analysis for iSP and IHI, the interstimulus intervals where post hoc differences are consistently present in all cases are interstimulus intervals of 1.5 ms and 3.0 ms. The relationship between SICF in iSP and SICF in IHI with SICF in cMEP are also confirmed by correlation analysis indicating the presence of a positive linear correlation for iSP area with cMEP amplitude and a negative linear correlation of IHI with cMEP amplitude. iSP duration was not correlated with cMEP amplitude, and this probably reflects that duration of inhibition is not equivalent to degree of inhibition.
The question arises as to the location of the paired-pulse interaction on iSP/IHI. This could occur either within the stimulated hemisphere, or, since each individual pulse was strong enough to activate a threshold transcallosal effect, it could also have occurred in the opposite hemisphere, or even in the spinal cord. In the absence of direct recordings of activity at each site it is difficult to be certain. However, transcallosal axons are smaller diameter than the larger corticospinal axons, and therefore will have a longer refractory period after firing an action potential. Direct measurements show that the absolute refractory period of corticospinal axons is about 1 ms, with the relative refractory period lasting for at least a further 2 ms (Deletis et al. 2001; Novak et al. 2004). This means that at the first peak of paired-pulse facilitation of iSP/IHI (1.3–1.5 ms), transcallosal axons are likely to be still refractory from the first TMS pulse, and therefore difficult to recruit by a second identical stimulus. Thus, we conclude that at the least the first peak of interaction at 1.5 ms is likely to have occurred within the stimulated hemisphere rather than at any other site.
Nature of facilitatory interaction
I-waves are believed to result from rhythmic excitatory trans-synaptic input of corticospinal neurons (Amassian & Cracco, 1987; Ziemann & Rothwell, 2000) the timing of which may be due to properties of the neurons, synapses or the interneuron network stimulated. Our experiment indicates that excitatory input onto transcallosal neurons also has the same rhythmic timing as I-waves on corticospinal neurons. This suggests that both these networks of excitatory interneurons have similar properties. It is also worthwhile to note that in a recent paper (Koch et al. 2006), the premotor cortex appears to have a different SICF-like rhythmicity (0.8 ms rather than 1.5 ms) which suggests that this rhythmicity is specific to the primary motor cortex.
The similar rhythmicity of I-wave interaction may suggest that the corticospinal and transcallosal neurons share a common excitatory interneuron network. On the other hand, it may also suggest that I-waves are a shared network property of the excitatory interneuronal networks rather than a shared network of neurons. It is not possible to exclude either of these possibilities based on our study.
It is interesting to note the low level of correlation between the corticospinal SICF and the transcallosal SICF (r2= 0.069–0.075 depending on the measure used for transcallosal inhibition). It could be extrapolated from this that the intracortical circuits responsible for SICF in TC neurons and CTS neurons are only minimally overlapping as mentioned above; however, it could also suggest that SICF (via transcallosal inhibition) has only a minor inhibitory effect on contralateral corticospinal neuronal excitability. Once more, it is not possible to exclude either of these possibilities based on our study.
Effect of rTMS on corticospinal and transcallosal neurons
As reported previously, 5 Hz rTMS reduced SICIcMEP whilst having no effect on the amplitude of corticospinal cMEPs evoked by a single pulse TMS (Di Lazzaro et al. 2002; Quartarone et al. 2005). There were two findings in the present experiment. The first confirmed previous observations of Trompetto et al. (2004) that SICIcMEP and SICIiSP were measurable during ipsilateral muscle activation with conditioning intensity of 90% AMT and above, and SICIcMEP and SICIiSP both increased with increasing intensity of the conditioning stimulus over a range from 90 to 130% AMT (Table 6A and B). It may seem surprising that SICIcMEP could be elicited in view of the ongoing contraction of the opposite FDI that was required for measurement of the iSP. Muellbacher et al. (2000) had reported that SICI was greatly depressed in such conditions. However, as in experiment 1, the intensity of the test pulse had been adjusted to evoke a clear iSP. This meant that the contralateral MEP was larger than the usual 1 mV peak to peak conventionally used to evaluate SICIcMEP (Kujirai et al. 1993; Chen, 2004). Larger MEPs are associated with increased SICIcMEP (Sanger et al. 2001), therefore our experimental protocol may favour demonstrating SICIcMEP. It is also interesting to note that SICIiSP (but not SICIcMEP) appears to saturate at about 130% AMT (Fig. 8A and C and Table 8). This is difficult to interpret; it may indicate that interneurons of SICIcMEP and interneurons of SICIiSP are distinct, but it is important to stress that at such high intensities, the conditioning stimulus is suprathreshold for producing both corticospinal volleys and SICF-like phenomena, which complicate the interpretation.
The second finding was that 5 Hz rTMS reduced SICIiSP in the same way as it did SICIcMEP. We note that although SICIcMEP was less effective after 5 Hz rTMS, it was not completely abolished as reported by Quartarone et al. (2005). One possible reason for the discrepancy is that we found preserved SICIcMEP after rTMS only when we used relatively high-conditioning pulse intensities (110% and 130% AMT) which were not tested in the previous studies.
SICIiSP was reduced by 5 Hz rTMS in parallel with SICIcMEP (Table 4). Furthermore the effect was the same at all intensities of the conditioning stimulus. This implies that the inhibitory interneurons that synapse onto transcallosal neurons are regulated in a similar manner by rTMS as the inhibitory interneurons that synapse onto the corticospinal cells.
There was one difference between the effect of 5 Hz rTMS on cMEP and iSP: it had no effect on cMEP, whereas there was a small reduction in the depth of iSP. This effect was unexpected as we had anticipated that high-frequency rTMS would, if anything, increase (rather than decrease) the excitability of transcallosal neurons (Cincotta et al. 2005). One possible explanation may relate to the fact that the transcallosal effects between the hemispheres are not purely inhibitory; there is also a low-threshold facilitatory pathway that is more difficult to study and whose effect is usually masked by the higher threshold and stronger inhibition (Ugawa et al. 1993; Hanajima et al. 2001). Five hertz rTMS at 90% RMT may have preferentially affected the lower threshold transcallosal facilitatory neurons, increasing their excitability thus producing an apparent reduction in iSP. Whatever the case, the effect of 5 Hz rTMS on iSP is small.
Conclusion
In summary, our data demonstrate that the control of transcallosal connections between the two hand areas of motor cortex is very similar to that described for the corticospinal outputs from the same area of cortex. Thus, there is evidence for I-wave facilitatory interaction of transcallosal projections as well as short-interval inhibitory inputs explored by SICI. Additionally, the population of SICI-like interneurons that control the transcallosal neurons appear in many ways to behave similarly to those that control corticospinal neurons after subthreshold 5 Hz rTMS. We conclude that intracortical circuits which synapse onto transcallosal and corticospinal neurons in layer III and V of the cortex have similar network properties, and that this may be relevant for effective control of bilateral hand movement.
References
- Amassian VE, Cracco RQ. Human cerebral cortical responses to contralateral transcranial stimulation. Neurosurgery. 1987;20:148–155. [PubMed] [Google Scholar]
- Boroojerdi B, Diefenbach K, Ferbert A. Transcallosal inhibition in cortical and subcortical cerebral vascular lesions. J Neurol Sci. 1996;144:160–170. doi: 10.1016/s0022-510x(96)00222-5. [DOI] [PubMed] [Google Scholar]
- Chen R. Interactions between inhibitory and excitatory circuits in the human motor cortex. Exp Brain Res. 2004;154:1–10. doi: 10.1007/s00221-003-1684-1. January. [DOI] [PubMed] [Google Scholar]
- Chen R, Yung D, Li JY. Organization of ipsilateral excitatory and inhibitory pathways in the human motor cortex. J Neurophysiol. 2003;89:1256–1264. doi: 10.1152/jn.00950.2002. [DOI] [PubMed] [Google Scholar]
- Cincotta M, Giovannelli F, Borgheresi A, Balestrieri F, Zaccara G, Inghilleri M, Berardelli A. Modulatory effects of high-frequency repetitive transcranial magnetic stimulation on the ipsilateral silent period. Exp Brain Res. 2005;171:490–496. doi: 10.1007/s00221-005-0296-3. [DOI] [PubMed] [Google Scholar]
- Deletis V, Isgum V, Amassian VE. Neurophysiological mechanisms underlying motor evoked potentials in anesthetized humans. Part 1. Recovery time of corticospinal tract direct waves elicited by pairs of transcranial electrical stimuli. Clin Neurophysiol. 2001;112:438–444. doi: 10.1016/s1388-2457(01)00461-8. [DOI] [PubMed] [Google Scholar]
- Di Lazzaro V, Oliviero A, Mazzone P, Pilato F, Saturno E, Dileone M, Insola A, Tonali PA, Rothwell JC. Short-term reduction of intracortical inhibition in the human motor cortex induced by repetitive transcranial magnetic stimulation. Exp Brain Res. 2002;147:108–113. doi: 10.1007/s00221-002-1223-5. [DOI] [PubMed] [Google Scholar]
- Di Lazzaro V, Rothwell JC, Oliviero A, Profice P, Insola A, Mazzone P, Tonali P. Intracortical origin of the short latency facilitation produced by pairs of threshold magnetic stimuli applied to human motor cortex. Exp Brain Res. 1999;129:494–499. doi: 10.1007/s002210050919. [DOI] [PubMed] [Google Scholar]
- Ferbert A, Priori A, Rothwell JC, Day BL, Colebatch JG, Marsden CD. Interhemispheric inhibition of the human motor cortex. J Physiol. 1992;453:525–546. doi: 10.1113/jphysiol.1992.sp019243. [DOI] [PMC free article] [PubMed] [Google Scholar]
- Gerloff C, Cohen LG, Floeter MK, Chen R, Corwell B, Hallett M. Inhibitory influence of the ipsilateral motor cortex on responses to stimulation of the human cortex and pyramidal tract. J Physiol. 1998;510:249–259. doi: 10.1111/j.1469-7793.1998.249bz.x. [DOI] [PMC free article] [PubMed] [Google Scholar]
- Hanajima R, Ugawa Y, Machii K, Mochizuki H, Terao Y, Enomoto H, Furubayashi T, Shiio Y, Uesugi H, Kanazawa I. Interhemispheric facilitation of the hand motor area in humans. J Physiol. 2001;531:849–859. doi: 10.1111/j.1469-7793.2001.0849h.x. [DOI] [PMC free article] [PubMed] [Google Scholar]
- Ilic TV, Meintzschel F, Cleff U, Ruge D, Kessler KR, Ziemann U. Short-interval paired-pulse inhibition and facilitation of human motor cortex: the dimension of stimulus intensity. J Physiol. 2002;545:153–167. doi: 10.1113/jphysiol.2002.030122. [DOI] [PMC free article] [PubMed] [Google Scholar]
- Jacobson S, Trojanowski JQ. The cells of origin of the corpus callosum in rat, cat and rhesus monkey. Brain Res. 1974;74:149–155. doi: 10.1016/0006-8993(74)90118-8. [DOI] [PubMed] [Google Scholar]
- Jones EG, Coulter JD, Wise SP. The commissural columns in the sensory-motor cortex of monkeys. J Comp Neurol. 1979;188:113–135. doi: 10.1002/cne.901880110. [DOI] [PubMed] [Google Scholar]
- Koch G, Franca M, Mochizuki H, Marconi B, Caltagirone C, Rothwell JC. Interactions between pairs of transcranial magnetic stimuli over the human left dorsal premotor cortex differ from those seen in primary motor cortex. J Physiol. 2006;578:551–562. doi: 10.1113/jphysiol.2006.123562. [DOI] [PMC free article] [PubMed] [Google Scholar]
- Kujirai T, Caramia MD, Rothwell JC, Day BL, Thompson PD, Ferbert A, Wroe S, Asselman P, Marsden CD. Corticocortical inhibition in human motor cortex. J Physiol. 1993;471:501–519. doi: 10.1113/jphysiol.1993.sp019912. [DOI] [PMC free article] [PubMed] [Google Scholar]
- Meyer BU, Roricht S, Grafin von Einsiedel H, Kruggel F, Weindl A. Inhibitory and excitatory interhemispheric transfers between motor cortical areas in normal humans and patients with abnormalities of the corpus callosum. Brain. 1995;118:429–440. doi: 10.1093/brain/118.2.429. [DOI] [PubMed] [Google Scholar]
- Meyer BU, Roricht S, Woiciechowsky C. Topography of fibers in the human corpus callosum mediating interhemispheric inhibition between the motor cortices. Ann Neurol. 1998;43:360–369. doi: 10.1002/ana.410430314. [DOI] [PubMed] [Google Scholar]
- Novak K, de Camargo AB, Neuwirth M, Kothbauer K, Amassian VE, Deletis V. The refractory period of fast conducting corticospinal tract axons in man and its implications for intraoperative monitoring of motor evoked potentials. Clin Neurophysiol. 2004;115:1931–1941. doi: 10.1016/j.clinph.2004.03.016. [DOI] [PubMed] [Google Scholar]
- Peinemann A, Lehner C, Mentschel C, Munchau A, Conrad B, Siebner HR. Subthreshold 5-Hz repetitive transcranial magnetic stimulation of the human primary motor cortex reduces intracortical paired-pulse inhibition. Neurosci Lett. 2000;296:21–24. doi: 10.1016/s0304-3940(00)01616-5. [DOI] [PubMed] [Google Scholar]
- Quartarone A, Bagnato S, Rizzo V, Morgante F, Sant’angelo A, Battaglia F, Messina C, Siebner HR, Girlanda P. Distinct changes in cortical and spinal excitability following high-frequency repetitive TMS to the human motor cortex. Exp Brain Res. 2005;161:114–124. doi: 10.1007/s00221-004-2052-5. [DOI] [PubMed] [Google Scholar]
- Rothwell JC, Colebatch J, Britton TC, Priori A, Thompson PD, Day BL, Marsden CD. Physiological studies in a patient with mirror movements and agenesis of the corpus callosum. J Physiol. 1991;438:34P. [Google Scholar]
- Sanger TD, Garg RR, Chen R. Interactions between two different inhibitory systems in the human motor cortex. J Physiol. 2001;530:307–317. doi: 10.1111/j.1469-7793.2001.0307l.x. [DOI] [PMC free article] [PubMed] [Google Scholar]
- Tokimura H, Ridding MC, Tokimura Y, Amassian VE, Rothwell JC. Short latency facilitation between pairs of threshold magnetic stimuli applied to human motor cortex. Electroencephalogr Clin Neurophysiol. 1996;101:263–272. doi: 10.1016/0924-980x(96)95664-7. [DOI] [PubMed] [Google Scholar]
- Trompetto C, Bove M, Marinelli L, Avanzino L, Buccolieri A, Abbruzzese G. Suppression of the transcallosal motor output: a transcranial magnetic stimulation study in healthy subjects. Exp Brain Res. 2004;158:133–140. doi: 10.1007/s00221-004-1881-6. [DOI] [PubMed] [Google Scholar]
- Ugawa Y, Hanajima R, Kanazawa I. Interhemispheric facilitation of the hand area of the human motor cortex. Neurosci Lett. 1993;160:153–155. doi: 10.1016/0304-3940(93)90401-6. [DOI] [PubMed] [Google Scholar]
- Wassermann EM. Risk and safey of repetitive transcranial magnetic stimulation: report and suggested guidelines from the International Workshop on the Safety of Repetitive Transcranial Magnetic Stimulation, June 5–7, 1996. Electroencephalogr Clin Neurophysiol. 1998;108:1–16. doi: 10.1016/s0168-5597(97)00096-8. [DOI] [PubMed] [Google Scholar]
- Wassermann EM, Fuhr P, Cohen LG, Hallett M. Effects of transcranial magnetic stimulation on ipsilateral muscles. Neurology. 1991;41:1795–1799. doi: 10.1212/wnl.41.11.1795. [DOI] [PubMed] [Google Scholar]
- Ziemann U, Rothwell JC. I-waves in motor cortex. J Clin Neurophysiol. 2000;17:397–405. doi: 10.1097/00004691-200007000-00005. [DOI] [PubMed] [Google Scholar]
- Ziemann U, Tergau F, Wassermann EM, Wischer S, Hildebrandt J, Paulus W. Demonstration of facilitatory I wave interaction in the human motor cortex by paired transcranial magnetic stimulation. J Physiol. 1998;511:181–190. doi: 10.1111/j.1469-7793.1998.181bi.x. [DOI] [PMC free article] [PubMed] [Google Scholar]