Abstract
The absorption spectra of N-acetyl-L-tryptophanamide in various solvents were resolved into the sums of the 1La and 1Lb components. The relative intensities of the 0-0 transitions of the 1Lb bands correlate linearly with the solvent polarity values . A novel strategy, which utilizes a set of the experimental 1Lb bands, was employed to resolve the near-UV CD spectra of tryptophanyl residues. Resolved spectral parameters from the single-tryptophan mutants of tear lipocalin (TL), F99W and Y87W, corroborate the fluorescence as well as structural data of TL. Analysis of the 1Lb bands of the Trp CD spectra in proteins is a valuable tool to obtain the local features. The “DMSO-like” 1Lb band of Trp CD spectra may be used as a “fingerprint” to identify the tryptophanyl side chains in situations where the benzene rings of Trp have van der Waals interactions with the side chains of its nearest neighbor. In addition, the signs and intensities of the components hold information about the side-chain conformations and dynamics in proteins. Combined with Trp mutagenesis, this method we call site-directed circular dichroism is broadly applicable to various proteins to obtain the position-specific data.
Keywords: tear lipocalin, Lipocalin-1, von Ebner’s gland protein, Trp, vibronic band, circular dichroism, near-UV CD, site-directed circular dichroism
Introduction
Trp fluorescence is highly sensitive to the local environment of its side chain. Advances made in Trp photophysics have revealed the local features (such as polarity, proximity of quenching groups, etc) of proteins that effect quantum yield, λmax and lifetime distribution of the fluorescence [1–6]. Trp has become a reliable chromophore (label) for studies of the structure-function relationship of the proteins. The solution structure of human tear lipocalin (TL), has been resolved with site-directed tryptophan fluorescence (SDTF) [7] and, later, verified by x-ray crystallography [8]. Trp is also utilized extensively by other spectroscopic techniques, such as absorption and circular dichroism (CD) spectroscopies [9, 10].
The side chain of Trp possesses unique features that make CD spectroscopy valuable as a tool for the studies of the conformations of proteins. In proteins, Trp fluorescence almost exclusively originates form the excited electronic state 1La [5, 11]. However, the near-UV CD spectra of Trp residues of proteins reflect both the 1La and 1Lb electronic transitions. The intensities and signs of the CD spectra for these transitions vary independently. As a result, the near-UV CD spectra of Trp, representing the sums of various types of overlapping 1La and 1Lb bands, are very complex. The indole moiety of Trp is inherently optically inactive. A variety of mechanisms that may induce the near-UV CD bands have been implicated for aromatic side chains [12]. The interaction of the Trp side chain with another aromatic side chain (His, Tyr, Trp, Phe) or with amide groups within about 10 Å may give appreciable CD intensity [12]. The spatial arrangement of these groups in the protein determines the sign and intensity of the CD band. Therefore, the near-UV CD spectra of proteins reflect the conformation of the protein. In contrast, the nearest environment of the indole ring has the most impact on the quantum yield and lifetime distribution of Trp fluorescence [2, 13].
Previously, a few attempts have been made to resolve the near-UV CD spectra of Trp by fitting the spectra to the sum of the 1La and 1Lb components [14, 15]. It has been shown that one type of the 1Lb spectrum is not sufficient for the fitting of certain types of tryptopan CD spectra. Some success has been achieved in resolving the near-UV CD spectra of Trp by varying the relative intensity of the 0-0 transition of 1Lb in the fitting procedure. Relative intensities of vibronic bands of 1Lb vary for Trp in buffer compared with that included in a protein structure [14]. The 1Lb transition, in contrast to the 1La, is quite sensitive to the methyl or methoxy substitutions on the indole ring, particularly at positions 4, 6, and 7. This results in changes of the relative intensities of the vibronic transitions [5, 16]. It is reasonable to expect similar effects, although much smaller in scale, for Trp in instances where its benzene ring interacts with other side chains. Therefore, it is rational that various types of the 1Lb bands would be required for the spectral fitting of the near-UV spectra of Trp included in protein structures. The λmax of the 1La band is much more sensitive to the environment compared with that of the 1Lb. However, because of the high degree of inhomogeneous broadening, the vibronic bands of the 1La are not resolved. In addition, for all observed 1La spectra, the maximum of the absorption appears far from the 0-0 transition [5]. Accordingly, in proteins, the overall spectral shift of one kind of 1La band is likely to be adequate for the spectral fitting of the near-UV CD spectra of Trp. The challenge is to provide the experimental basis to resolve various types of the 1Lb bands that can be linked to the local features of proteins.
In this paper, we describe a novel strategy for the resolution of the near-UV CD spectra of tryptophanyl residues into the 1La and 1Lb components. That is, instead of variation of the relative intensity of the 0-0 transition in 1Lb [15], an experimental set of the 1Lb bands were obtained from the absorption spectra of N-Acetyl-L-tryptophanamide (NATA) in various solvents for the fitting procedure. As a result, the number of variable parameters is reduced. In addition, the 1Lb band that best fits the near-UV CD spectrum of Trp located at a particular site of the protein can be linked to the particular solvent and, therefore, to the local polarity of the environment of the Trp side chain. The sensitivity of the spectral parameter (1Lb(0-0)/1Lb(0+850)) to the environment makes the 1Lb band very attractive for protein studies.
Here we show that analysis of the 1Lb bands of the Trp CD spectra in proteins provides the site-specific information in the proteins. The “DMSO-like” 1Lb band of Trp CD spectra may be used as a “fingerprint” to identify specific tryptophanyl side chains in which the benzene rings of Trp has van der Waals interactions with the side chains of its nearest neighbor.
Materials and methods
NATA, ethanol, methanol, chloroform, and acetonitrile were purchased from Sigma-Aldrich. Dimethyl sulfoxide (DMSO) was purchased from Fisher Scientific. All solvents were spectrophotometric grade.
Site-Directed Mutagenesis and Plasmid Construction
The TL cDNA in PCR II (Invitrogen, San Diego, CA), previously synthesized [17], was used as a template to clone the TL gene spanning bases 115–592 of the previously published sequence [18] into pET 20b (Novagen). Flanking restriction sites for NdeI and BamHI were added to produce the native protein sequence as found in tears but with an initiating methionine [19]. To construct mutant proteins with a single tryptophan, the previously well characterized TL mutant, W17Y, was prepared with oligonucleotides (Universal DNA Inc.) by sequential PCR steps [20, 21]. Using this mutant as a template, mutant cDNAs were constructed in which the selected amino acids were additionally substituted with tryptophan or cysteine. Amino acid 1 corresponds to His, bases 115–118 according to Redl [18]. Single-Trp mutants include W17Y/Y87W (for simplicity denoted as Y87W)) and W17Y/F99W (F99W).
Single-Cys mutants include C101L/K83C (K83C) and C101L/Y87C (Y87C).
Expression and purification of mutant proteins
The mutant plasmids were transformed in E. coli BL 21 (DE3) and cells were cultured and proteins were expressed according to the manufacturer’s protocol (Novagen). Following cell lysis [22], the supernatant was treated with methanol (40% final concentration) at 4° C for 2 1/2 hours. Alternatively, mutant proteins expressed in inclusion bodies were dissolved in 8M urea at room temperature for 2 h. In either case, the resulting suspension was centrifuged at 3000g for 30 minutes. The supernatant was dialyzed against 50 mM Tris-HCl pH 8.4. First, the dialysate was treated to 45% saturation with ammonium sulfate. Then the supernatant from the precipitation was adjusted to 75% saturation with ammonium sulfate. The resulting precipitate was dissolved in 50 mM Tris-HCl pH 8.4 and applied to a Sephadex G-100 column (2.5 × 100 cm) equilibrated with 50 mM Tris-HCl, 100 mM NaCl, pH 8.4. The fraction containing the mutant protein was dialyzed against 50 mM Tris-HCl, pH 8.4 and applied to a DEAE Sephadex A-25 column. Bound protein was eluted with a 0–0.8 M NaCl gradient. Eluted fractions containing mutant proteins were centrifugally concentrated (Amicon, Centricon-10). Purity of mutant proteins was verified by SDS tricine gel electrophoresis [23]. The protein concentrations were determined by the biuret method [24].
Preparation of apo-TL
TL expressed in E. coli was considered as the holo-form. Recombinant TL is rich with palmitic acid but in contrast to native TL does not contain cholesterol [21, 23].
To generate apo-TL, delipidation of recombinant TL was performed by a rigorous chloroform/methanol extraction and verified by thin layer chromatography as previously described [23].
Absorption Spectroscopy
UV absorption spectra were recorded at room temperature using Shimadzu UV-2400 PC spectrophotometer. DMSO, unlike other solvents used in this study, has relatively high absorbance at 265 nm. Therefore, Trp spectrum in DMSO was measured using a cell with pathlength of 5 mm. The maximum absorption did not exceed 1 OD.
CD Spectral Measurements
Spectra were recorded (Jasco 810 spectropolarimeter, 0.2 mm and 10 mm path lengths for far-UV and near-UV spectra, respectively) using a protein concentration of 1.2 mg/mL. Eight and sixteen scans from 190 to 260 nm and from 250 to 320 nm were averaged, respectively. Results were recorded in millidegrees and converted to molar Δε in M−1cm−1 and mean residue ΔεMRV for near-UV and far-UV, respectively.
Fitting of the absorption and CD spectra
The absorption spectra of NATA were measured in various solvents, the polarity values of which differ greatly. The resolutions of the NATA spectra into the 1La and 1Lb components were achieved by using the fitting strategy described in detail elsewhere [15]. Briefly, the 1Lb band of Barth et al. [14] was deconvolved into five Gaussian components. The existence of the five vibronic bands has been shown experimentally for the 1Lb of a related model compound, 5-methoxyindole [25]. The line widths and amplitudes of the Gaussian components were varied to improve fitting of the 1Lb band in various solvents. However, no deconvolution was necessary for the 1La band of Barth et al. [14]. As a result, the set of the 1Lb components, each of which corresponds to NATA in a particular solvent, was obtained. The near-UV CD spectra were resolved by testing all types of 1Lb components. The goodness of fit was assessed by the χ2 criterion.
Programs
For deconvolution of the spectra into Gaussian components, Microcal ORIGIN software (Northampton, MA) was used. Manipulation and fitting of tryptophan absorption and CD spectra were carried out using computer programs written in LabVIEW (National Instruments, Austin, TX). To obtain the best fit of the near-UV CD spectra, the software was programmed to find the best linear combination of the 1Lb and 1La bands, the remaining aromatic component (designated as the W17Y contribution), as well as a baseline component permitting the shift of the whole spectrum. For all spectra, 250 points were generated in the range of 270–320 nm with an increment of 0.2 nm. The 1La and 1Lb bands were shifted in steps of 0.2 nm. In fitting procedures, the same 1La spectrum was used for the all CD spectra of the single-tryptophan mutants. However, each 1Lb spectrum, which was resolved from the absorption spectra of NATA in various solvents, was tested to get the best-fit spectrum. To select the solvent that best characterizes the environment of Trp residue in the mutant proteins, χ2/χ2min values were calculated for the various solvent-specific 1Lb components.
Results and discussion
The contribution of Tyr87 to the near-UV CD spectra of TL
The aromatic composition of the W17Y mutant includes 6 tyrosines and 3 phenylalanine residues. Since phenylalanine residues contribute below 270 nm in the CD spectra, the remaining aromatic component originates from the tyrosine residues for the spectral region >270 nm. In the mutant, Y87W, there are only five tyrosines. In the fitting procedure, the intensity of the CD spectrum of W17Y was varied to compensate for the lost contribution of Tyr87 in this mutant. However, deletion of this contribution to the CD spectrum of Y87W may alter the spectral shape of the total tyrosine contribution. In this case, the CD spectra of the mutant W17Y may not be used for the total tyrosine contribution. Therefore, to justify use of W17Y in the fitting procedure, the CD spectrum of Tyr87 was examined. The spectral contribution of the Tyr87 to the CD spectrum was constructed as the difference of the CD spectra of K83C and Y87C (Fig. 1). The difference CD spectrum is very similar to that of W17Y. The difference in spectral range < 270 nm can be attributed to contribution from phenylalanine residues, which is absent in the difference CD spectrum because of cancellation in the spectral subtraction (Fig. 1B). The CD spectra were deconvolved by fitting into sum of the spectral components in the range of 270–320 nm. Therefore, in the analysis of the CD spectrum of Y87W, it is justified to use the CD spectrum of W17Y as a variable component to compensate for the lost contribution of Tyr87. The construction of the CD spectrum of Tyr87 by use of recombinant TL instead of K83C resulted in a similar CD spectrum, but some negative inclination in the spectral region of > 290 nm (data not shown). This difference may be attributed to the slight alterations in the environment of Trp17 that affect its 1La band. Perhaps, the contributions of Trp17 to the CD spectra are very similar in the mutants K83C and Y87C. As a result, the difference CD spectrum, which was constructed by using these mutants, does not show any obvious peaks from the Trp17 but there is small broad positive band greater than 290 nm in W17Y and K83C-Y87C.
Figure 1.
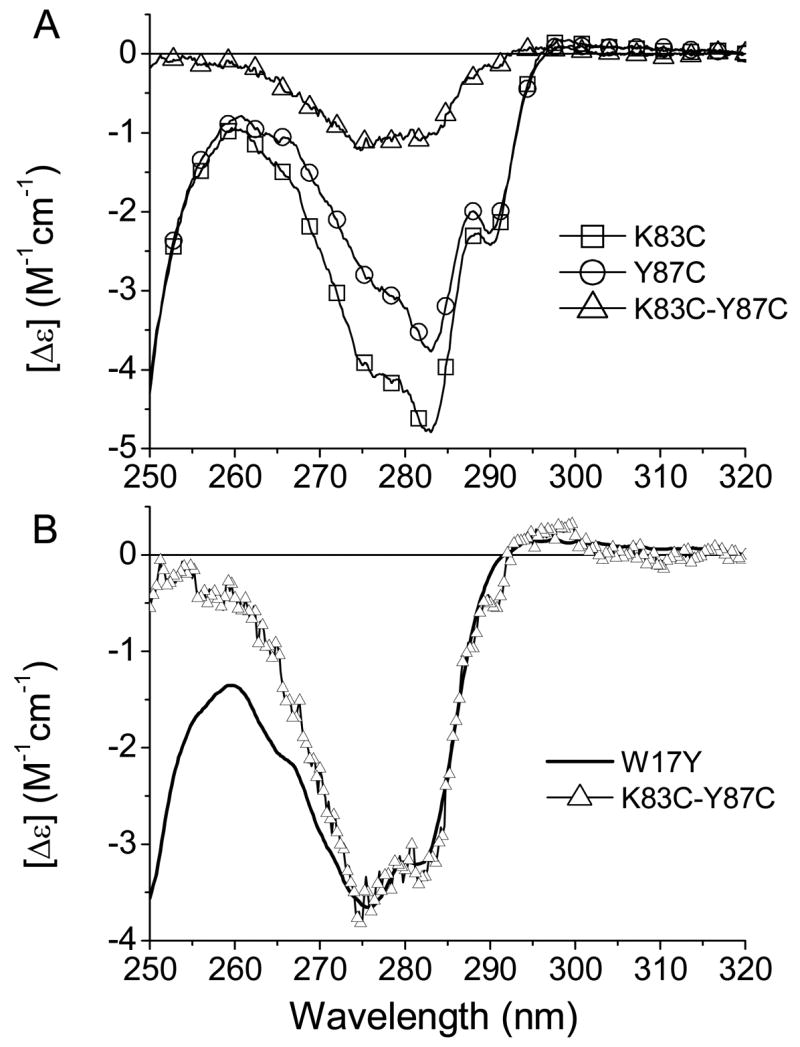
(A) Near-UV CD spectra of the mutants K83C and Y87C of TL. The difference CD spectrum of the K83C and Y87C shows the contribution of Tyr 87. (B) Comparison of the CD spectra of the mutant W17Y and the difference CD spectrum. For a better view of the similarity of Tyr contributions, the amplitude of the difference CD was normalized to that of W17Y.
Characterization of TL mutants
The far-UV CD spectrum of the TL mutant, F99W, which has been published previously [26], is very similar to that of recombinant TL. The far-UV spectrum of apoF99W is also similar to that of apo-TL and shows an expected decrease of β-structure [26, 27]. It indicates that the substitution of the Phe with a Trp at position 99 does not alter the secondary structure of TL. The far-UV CD spectra of the TL mutants, K83C and Y87C, are similar to that of recombinant TL (Fig. 2). The difference CD spectrum (Y87W and Y87C) is consistent with the aromatic contribution to the far-UV CD rather than changes in secondary structure of Y87W [28, 29] (Fig. 2, inset). Therefore, all mutant proteins used in this study have the native fold and contain structural information that is relevant to TL.
Figure 2.
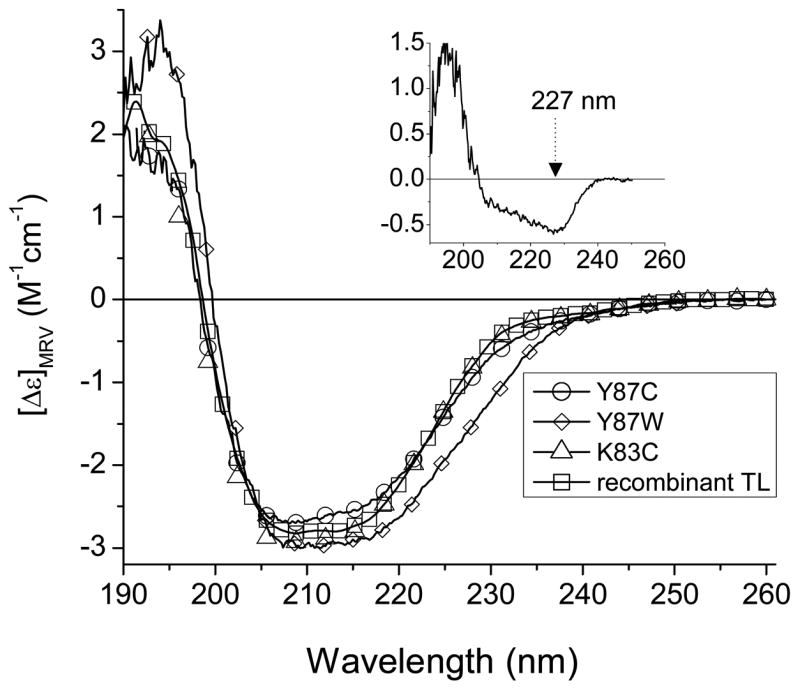
Far-UV CD spectra of the mutants of TL (K83C, Y87C and Y87W). For comparison, a CD spectrum of the recombinant TL is also shown. The inset shows the difference CD spectrum of the Y87W and Y87C.
The absorption spectra of Trp in various solvents and their resolution into the 1La and 1Lb components
It is well documented that the absorption spectra of Trp and its derivatives are sensitive to solvent polarity and depend on the ability of a solvent to form a hydrogen bond with the NH-group of the indole moiety [30]. The near-UV absorption spectrum of Trp consists of the two overlapping 1La and 1Lb bands, for which transition moments are perpendicular to each other [5].
The near-UV absorption spectra of NATA in various solvents are shown in Figure 3; the solvent polarity values vary greatly. It is evident that the resolutions as well as positions of the vibronic bands of the absorption spectra are different from each other. The spectra were fitted as the sum of the 1La and 1Lb components using a method described previously [15]. The result of fitting and the resolution into the components are shown in Figures 3 and 4. As expected from prior published studies, the solvent-induced spectral shifts are greater for the 1La band compared with those of the 1Lb. It has been shown that the 1La transition has a substantial charge transfer component and therefore a larger change in the dipole moment [5]. The 1La band is therefore highly sensitive to the environment. The 1La transition induces large geometry changes in the indole ring that results in a large absorption bandwidth and a low intensity for the 0-0 transition. Because of the very large number of bands, most of which are positioned more that 2000 cm−1 above the 0-0 transition, that have Franck-Condon factors >10−4 times that of the 0-0 transition, the λmax of the 1La band is always located far from the 0-0 transition [5]. The resulting inhomogeneous broadening in the 1La makes its vibronic bands almost untraceable even for the 0-0 transition.
Figure 3.
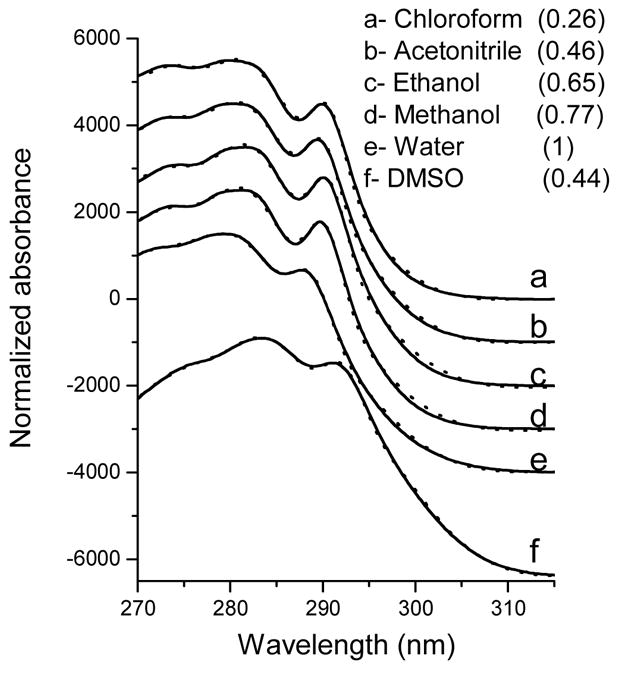
Absorption spectra (solid curves) of NATA in various solvents. The spectra have been shifted vertically to reduce overlap. The dotted lines are generated by fitting of the experimental data to the sum of the 1La and 1Lb, spectral (see “Methods” for details) components of which are shown in Figure 4. The numbers in parentheses represent the values of corresponding solvents, which were taken from the reference [31].
Figure 4.
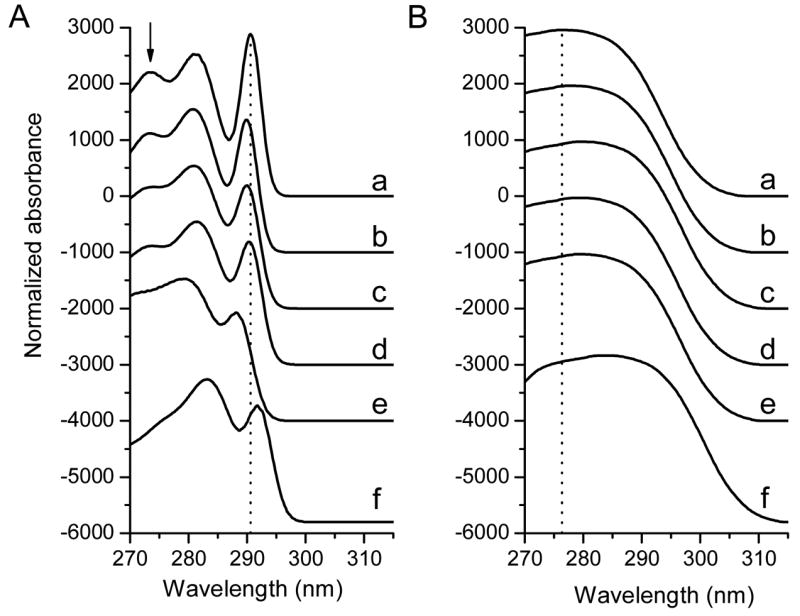
The resolution of absorption spectra of NATA in various solvents into the 1Lb (A) and 1La (B) components. Each set of the 1La+1Lb spectra is the best fit for the absorption spectrum corresponding to the particular solvent (Fig. 3). The spectra have been shifted vertically to reduce overlap. To better follow the solvent-related spectral shift, the dotted vertical lines are located at the 0-0 transition of 1Lb (A) and the maximum of the 1La bands (B) of NATA in chloroform. The arrow in (A) shows the position of the 0+2×850 transition. The small letters refer to the various solvents (same as in Figure 3).
In contrast to the transition for 1La, the 1Lb exhibits much less charge transfer and small geometry changes. As a result, compared to that of 1La, the relative intensity of the 0-0 transition of the 1Lb band is higher. The transition dipole moment of the 1Lb is approximately perpendicular to that of the 1La and its magnitude is significantly weaker [5]. However, unlike the 1La transition, 1Lb transition, particularly its spectral shape, is quite sensitive to methyl or methoxy substitution in the indole [16].
For the 1Lb bands in various solvents, the resolution of the vibronic components and the relative intensities of the 0-0 transitions exhibit significant changes. The 0+2 × 850 transition is almost untraceable for Trp in DMSO (Fig. 4). An assessment was made to determine if there is a relationship between the spectral parameters of Trp (the 1La and 1Lb bands) and the solvent polarity values.
There is a linear correlation between the spectral parameters of Trp and the solvent polarity values (Fig. 5). The describes the solvent polarity in the vicinity of a solute and takes into account the solvent/solute interaction [31]. Therefore, the values more appropriately describe the solvent polarity than, e.g., the dielectric constant or refractive index values, which are macroscopic parameters. It is evident that the parameters obtained in DMSO deviate significantly from the linear correlation curves (Fig. 5). Other than that, the 1La band (λmax) of the Trp absorption spectrum shows positive solvatochromism, i.e., bathochromic shift of the absorption band with increasing solvent polarity. However, in contrast to 1La band, the 1Lb band (0-0 transition) shows negative solvatochromism, i.e., hypsochromic shift of the absorption band with increasing solvent polarity (Fig. 5A). Similarly, for the Trp derivative, 2,3-dimethylindole, the 1La and 1Lb bands shift in opposing directions in water from their positions in methylcyclohexane [30]. The position of 0-0 transition of 1Lb changes minimally in the solvents, despite a large range of the solvent polarity indices (Fig. 5A). Therefore, in proteins, the use of this parameter is limited as an indicator of the local polarity in most cases. However, the relative intensity of the 0-0 transition of the 1Lb shows sizeable changes in various solvents; there is a linear correlation between the (1Lb(0-0)/1Lb(0+850)) parameter and the solvent polarity value (Fig. 5B). The parameter (1Lb(0-0)/1Lb(0+850)) determined for Trp in DMSO deviates significantly from the linear correlation curve (Fig. 5B) as seen for other parameters (Fig. 5A).
Figure 5.
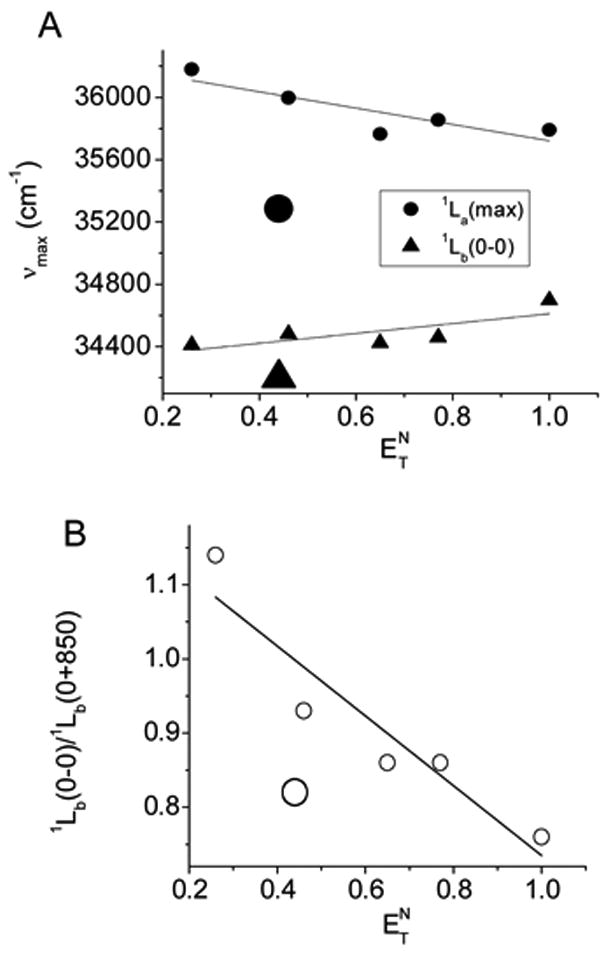
Linear correlations between solvent polarity values and the spectral parameters ((A) maxima of the 1La and the 0-0 transition of 1Lb; (B) ratio of the amplitudes of the 0-0 and 0+850 transitions) for the absorption spectra of NATA. The positions of the 0-0 transitions of the 1Lb in various solvents were determined from the 2nd derivative of the corresponding absorption bands. The larger symbols, which are out of the linear correlation, represent the parameters obtained for the absorption spectrum of NATA in DMSO.
An assortment of spectral shapes obtained for the 1Lb band of Trp in various solvents, which may mimic numerous environments in proteins, makes clear that one spectral type of 1Lb is not sufficient for the spectral fitting of the near-UV CD spectra of the tryptophanyl residues in proteins. Therefore, in the spectral fitting of the near-UV CD spectra of the single tryptophan mutants, each 1Lb spectrum obtained in various solvents was tested to get the best fit.
The 1Lb of Trp in DMSO is a result of a specific solvent/solute interaction
It is evident from Figure 4 that compared with other solvents the spectral shape of the 1Lb of Trp in DMSO is the most altered; the 0+2 × 850 transition of Trp is almost untraceable. In addition, DMSO shifts both the 1La and 1Lb bands to longer wavelengths relative to their positions in chloroform (Fig. 4). In fact, in DMSO, both bands are the most red shifted. It indicates better stabilization of the indole ring by DMSO molecules in the Franck-Condon excited state relative to the ground state as compared with that of other solvents. The high solvent sensitivity of the 1La state to a solvent polarity has been rationalized by the fact that 1La transition more directly involves the polar nitrogen atom of indole [32]. In addition, the DMSO interaction with Trp leads to the lowest energy for the 1Lb transition, which does not involve the polar nitrogen atoms of the indole ring. The DMSO-Trp interaction lowers the energy of both the 1La and 1Lb transitions, which is not the case for the other solvents used in this study. This property of DMSO can be rationalized by its amphiphilic nature. DMSO molecules can be involved in hydrophobic as well as hydrogen bond interactions. The sulfoxide oxygen of DMSO is capable of forming a hydrogen bond with the NH-group of the indole ring. On the other hand, DMSO shows a specific interaction with the Trp residue [33]. It has been shown that the aromatic protons at 2 and 4–7 positions, which are involved in the 1Lb transition, exhibit the strongest intermolecular NOE (nuclear Overhauser effect) interactions of the side chain of Trp with DMSO. The result has been interpreted as a hydrophobic interaction between the methyl groups of DMSO and the protons of the indole group [33]. The significant alteration of the 1Lb band observed for NATA in DMSO shows that the solvent/solute interaction has a dipole-induced dipole and/or van der Waals character (Fig. 4).
A dipolar reaction field will decrease the 1La transition energy if the interaction that localizes the methyl groups of DMSO at the indole ring sets the direction of the dipole moment of DMSO aligned with the Δμ= μLa−μg (μg is the ground-state dipole moment and μLa is the dipole moment of the 1La state. The dipole moment of DMSO is 3.96 D [34] and larger than that of water molecules (1.85 D) [35]. The collective properties of water molecules are responsible for a much larger dielectric constant (~78) compared to that of DMSO (~48). Therefore, DMSO-NATA interaction can lower both the 1La and 1Lb transition energies. In proteins, it is reasonable to expect a “DMSO-like” 1Lb band for the tryptophan side chains, when benzene rings of Trp are involved in van der Waals interaction with other side chains.
Resolution of the near-UV CD spectra of F99W in holo- and apo-forms
Analyses of the Trp absorption spectra in various solvents show the disparate nature in the shape of 1Lb bands, the spectral parameters of which can be linked to the solvent polarity. Each 1Lb band was tested to achieve the best fit for the near UV-CD spectra of the single-typtophan mutants of TL. The deconvolution of the near-UV CD spectra of F99W (in holo- and apo-forms) and the fitting parameters are shown in Figure 6 and Tables 1 and 2, respectively. It is evident that two different types of the 1Lb bands are necessary for the spectral fitting of both spectra. Previously, site-directed tryptophan fluorescence (SDTF) studies have revealed that Trp at position 99 exhibits a blue shifted emission peak (λmax= 325 nm) and its side chain is located in a hydrophobic environment inside the cavity of TL [7, 8]. Therefore, it is not surprising that the “chloroform-like” 1Lb band provides the best fit for the CD spectrum of F99W. However, the “methanol-like” 1Lb band is preferable for the fitting of the CD spectrum of apoF99W. Results of fitting the near-UV CD spectrum of apoF99W with various 1Lb components show that χ2/χ2min values do not differ significantly from each other compared to those for holoF99W or Y87W. The question is whether various types of the 1Lb band can be accurately discriminated when the range of χ2/χ2min values is small. Along with χ2/χ2min values, visual inspections of the best fit spectra and their corresponding residuals are very instructive in fitting the near-UV spectrum of apoF99W (Fig. 7 and Fig. 1S, supporting information). Differences at 294.5 nm, 290.7 nm and 285 nm are noticeable for the fitting with the “chloroform-like” 1Lb band. Particularly, deviations at 290.7 nm and 294.5 nm can be attributed to the fact that the 0-0 band of 1Lb in chloroform has a smaller width compared with those in methanol or ethanol. Difference absorption spectra of amplitude normalized 1Lb bands (spectra were also shifted as a whole to match their 0-0 bands to that in methanol) demonstrate deviations in the best fit curve in the above mentioned wavelengths (Fig. 2S, supporting information). The difference between 1Lb bands is smallest for those of methanol and ethanol. A small difference at 285 nm is noticeable in fitting the apoF99W with an “ethanol like” 1Lb compared to that of “methanol like”. Because spectral parameters of 1Lb band in methanol and ethanol are very similar, the distinction between them is difficult in proteins.
Figure 6.
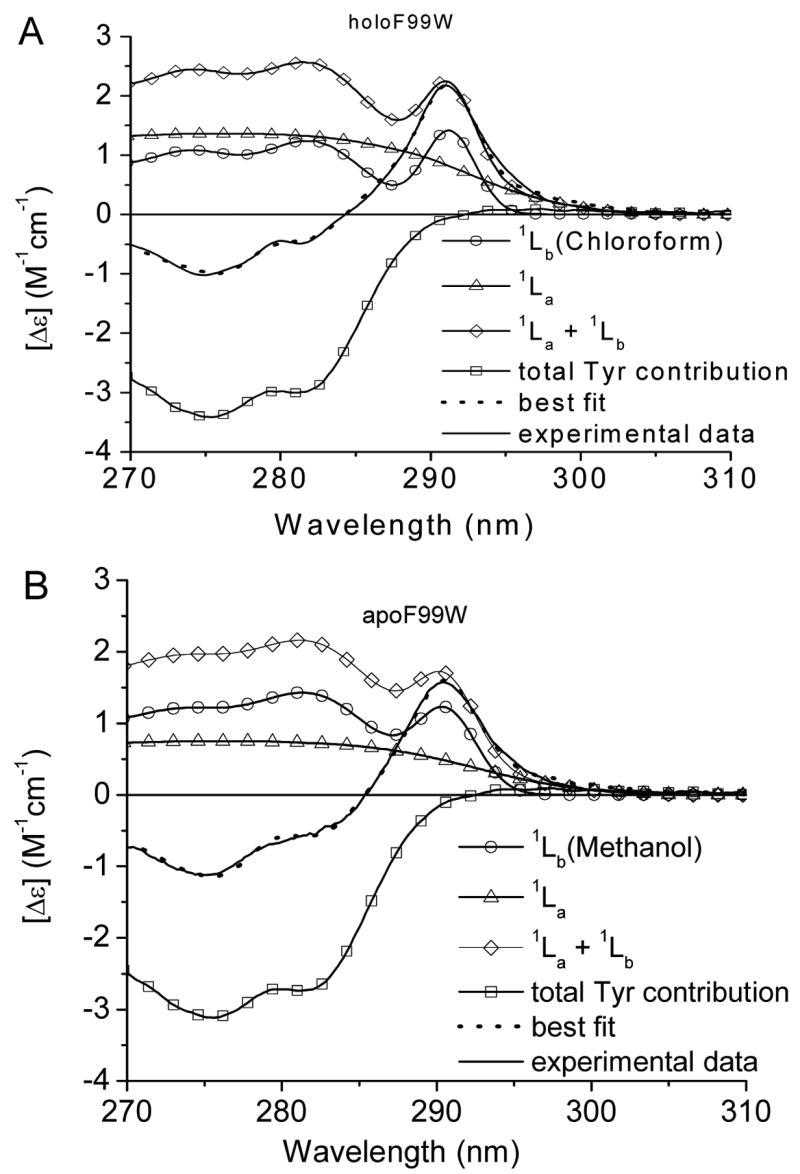
Fitting of near-UV CD spectra of the tryptophan mutant F99W in holo- (A) and apo-forms (B). Ratios χ2 values obtained from fitting the CD spectra with the various 1Lb components are shown in Table 1.
Table 1.
Ratios of χ2 values obtained from the fitting the CD spectra of the single tryptophan mutants with a number of the 1Lb components corresponding to various solvents
| χ2/χ2min | |||
|---|---|---|---|
| 1Lb | F99W | apoF99W | Y87W |
| 1Lb (chloroform) | 1 | 1.42 | 6.3 |
| 1Lb (ethanol) | 1.36 | 1.08 | 3.4 |
| 1Lb (methanol) | 1.24 | 1 | 3.6 |
| 1Lb (acetonitrile) | 1.39 | 1.36 | 3.8 |
| 1Lb (DMSO) | 3.30 | 1.66 | 1 |
| 1Lb (water) | 1.52 | 1.12 | 4.5 |
Table 2.
Resolved parameters for Trp CD spectra in the single Trp mutant proteins of TL.
|
1La |
1Lb |
|||||
|---|---|---|---|---|---|---|
| Mutant | λmax (nm) | Δε of the maximum (M−1 cm−1) | λmax of (0-0 band) (nm) | Δε of (0-0 band) (M−1 cm−1) | 1La(max)/1Lb(0-0) | W17Y Contribution |
| F99W | 275.7 | 1.36 | 291.2 | 1.42 | 0.96 | 0.94 |
| apoF99W | 276.0 | 0.75 | 290.4 | 1.23 | 0.61 | 0.85 |
| Y87W | 280.8 | 2.71 | 290.6 | 1.35 | 2.01 | 0.53 |
Figure 7.
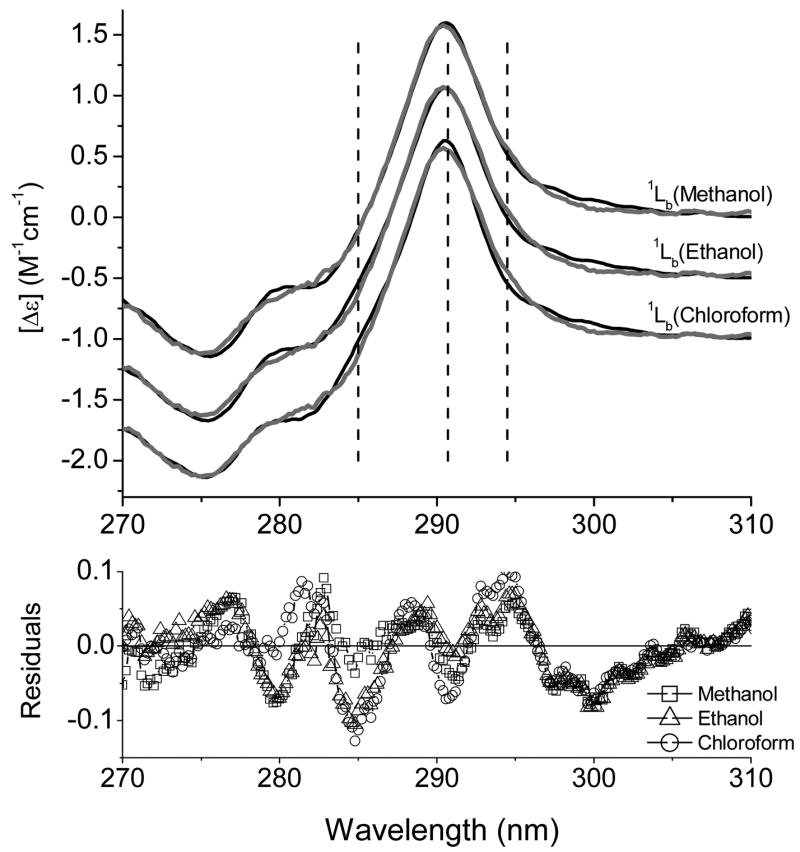
Fitting for the near-UV CD spectrum of apoF99W with 1Lb bands obtained in methanol, ethanol and chloroform. Dashed vertical lines correspond to 285 nm, 290.7 nm and 294.5 nm.
These results corroborate previous findings. It has been shown that TL undergoes structural and conformational changes upon delipidation. ApoTL exhibits a reduction of β-structure and decreased aromatic side chain asymmetry [27, 36]. Compared to the F99W, the fluorescence of apoF99W is red shifted (λmax= 329 nm), which is indicative of a relatively more polar environment [26]. Therefore, the “methanol-like” 1Lb band found for the apoF99W is consistent with a more polar environment for the position 99 in the apo-protein. The decreased intensities found for the 1La, 1Lb of Trp99 as well as total Tyr CD band demonstrate some relaxation of TL structure upon delipidation.
Resolution of the near-UV CD spectra of Y87W. The “DMSO-like” 1Lb band as a fingerprint for identification of Trp side chain that is involved in van der Waals interaction
The solution and crystal structures of TL have been resolved by SDTF and X-ray crystallography [7, 8]. Taking advantage of the available CD spectra of single-tryptophan mutants of TL, we searched the near-UV CD spectra to find an 1Lb band that is similar to that of Trp in DMSO. The search was narrowed down to the positions at which the benzene ring of indole in the Trp side chain may have a van der Waals interaction with the side chain of a nearest neighbor. As a result, the near-UV CD spectrum of the mutant Y87W and its deconvolution to the components are shown in Figure 8. Only the “DMSO-like” 1Lb band provides acceptable fitting (Table 1). χ2/χ2min values obtained for other type of 1Lb are >3.4. The decreased total Tyr contribution, which is estimated from of the fitting, is in line with the expected lost contribution of Trp87 (Fig. 1 and 8, Table 2).
Figure 8.
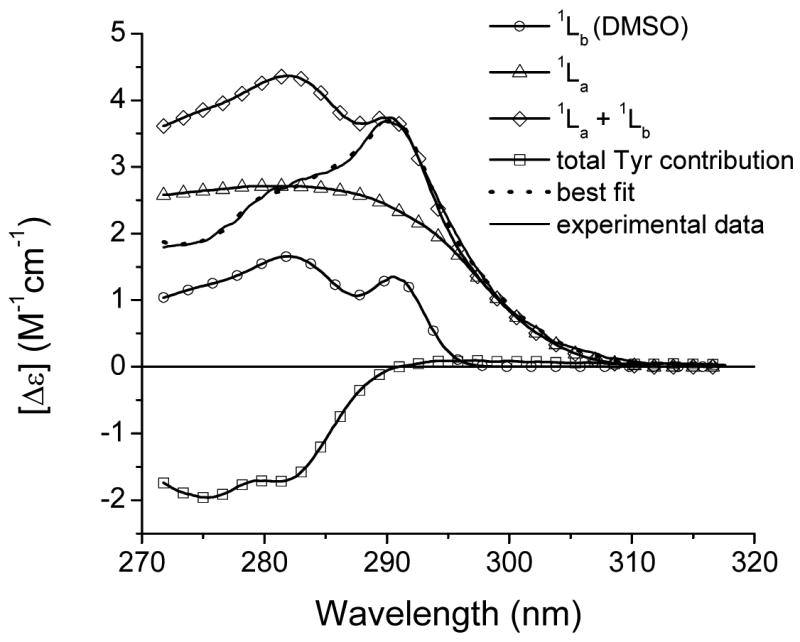
Fitting of the near-UV CD spectrum of the tryptophan mutant Y87W. Ratios χ2 values obtained from fitting the CD spectra with the various 1Lb components are shown in Table 1.
Tyr87 is located at the center of the strand F and its side chain points toward the solvent [7, 8]. The energetically favorable rotamer (g−(−60°; +90°)) of Trp87 and the residues in the flanking β-strands are shown in Figure 9. Analysis of the distribution of Trp rotamers in globular proteins show that the rotamer g− is the most favorable [37, 38] in β-strands, particularly at the center of β-strands [38]. It is interesting to note that the estimated contribution of the tryptophan side chain (Bb rotational strength) in the g−(−60°; +90°) conformation to the far-UV CD is −0.39 DBM (Debye-Bohr magneton, 1 DBM= 0.9273 × 10−38 cgs units) [28], which corroborates the far-UV CD data for the TL mutants. Compared to Y87C, Y87W exhibits a negative contribution (−0.42 DBM) to the far-UV CD (Fig. 2).
Figure 9.
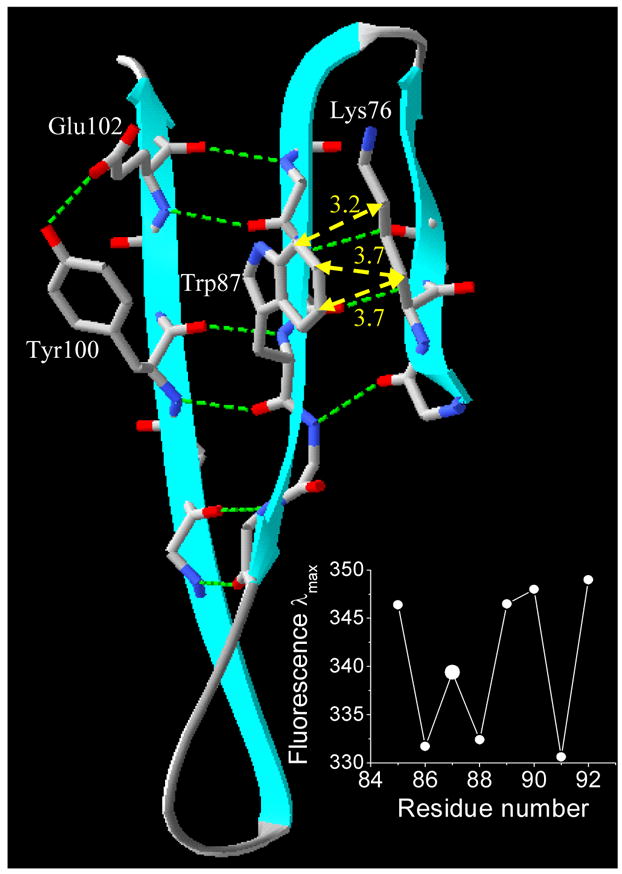
Ribbon model of TL generated from PDB: 1XKI [8] using SwissPdb Viewer [41]. The position of the side chain of the residue Trp87 (F-strand) relative to that of the residues from flanking strands (Lys76 (E-strand), Tyr100 (G-strand) and Glu102 (G-strand)). The side chains are shown by “stick” representation. Gray, blue and red sticks represent carbon, nitrogen and oxygen atoms, respectively. Dotted green lines show H-bonds. Dotted yellow lines and yellow numbers represent distances (in Å) between the atoms of Trp87 (rotamer g−(−60°; +90°)) and Lys76. The inset figure shows the fluorescence λmax values for the single tryptophan mutants in the F-strand [7].
One of the factors that stabilize the β-sheet proteins is the interaction between side chains of nearest neighbors [39, 40]. Nearest neighbors are divided into two categories: directly hydrogen bonded (HB neighbor) and non-hydrogen bonded (NHB neighbor). Significant side chain-side chain interactions are expected for residues that are NHB neighbors, in which Cα atoms point toward each other, and the Cα-Cα distance is smaller. For the residue Trp87, the HB and NHB neighbors are Tyr100 and Lys 76, respectively. Consequently, interaction between side chains of Trp87 and Lys76 is expected (Fig. 9). Finally, the fluorescence data on β-strand F is an additional argument for the such interaction [7] (Fig. 9, inset). The Trp fluorescence λmax value at position 87 is blue shifted compared with that of flanking positions on the same strand (85 and 89).
Conclusion
A new strategy employs various experimental 1Lb bands to resolve the near-UV CD spectra of Trp residues into 1La and 1Lb components. Various types of 1Lb band can be used to fit the near-UV CD spectra of tryptophanyl residues, the nearest environment of the side chain of which differ significantly from each other. Each type of 1Lb band (via parameter 1Lb(0-0)/1Lb(0+850)) used in this study can be linked to a particular polarity value. The most altered 1Lb band, a “DMSO-like” 1Lb, may be used as a “fingerprint” for identification the tryptophanyl side chains, in which benzene rings are involved in van der Waals interactions. This study focused mainly on changes in the vibronic bands of the 1Lb and their correlations with the local environments of Trp side chains in the protein. Other resolved parameters, such as the signs and intensities of the components, the information about the side-chain conformations and dynamics. For TL, dynamic characteristics of the side chains identified from different spectroscopic techniques have been related to differences in intensities of Trp near-UV CD spectra [15]. This method together with Trp mutagenesis, results in site-directed circular dichroism and complements SDTF studies in extracting conformational as well as structural data of a variety proteins.
Supplementary Material
Acknowledgments
Supported by U.S. Public Health Service Grants NIH EY 11224 and EY 00331 as well as the Edith and Lew Wasserman Endowed Professorship in Ophthalmology.
Footnotes
Publisher's Disclaimer: This is a PDF file of an unedited manuscript that has been accepted for publication. As a service to our customers we are providing this early version of the manuscript. The manuscript will undergo copyediting, typesetting, and review of the resulting proof before it is published in its final citable form. Please note that during the production process errors may be discovered which could affect the content, and all legal disclaimers that apply to the journal pertain.
References
- 1.Adams PD, Chen Y, Ma K, Zagorski MG, Sonnichsen FD, McLaughlin ML, Barkley MD. Intramolecular quenching of tryptophan fluorescence by the peptide bond in cyclic hexapeptides. J Am Chem Soc. 2002;124:9278–9286. doi: 10.1021/ja0167710. [DOI] [PubMed] [Google Scholar]
- 2.Chen Y, Barkley MD. Toward understanding tryptophan fluorescence in proteins. Biochemistry. 1998;37:9976–9982. doi: 10.1021/bi980274n. [DOI] [PubMed] [Google Scholar]
- 3.McLaughlin ML, Barkley MD. Time-resolved fluorescence of constrained tryptophan derivatives: implications for protein fluorescence. Methods Enzymol. 1997;278:190–202. doi: 10.1016/s0076-6879(97)78011-x. [DOI] [PubMed] [Google Scholar]
- 4.Vivian JT, Callis PR. Mechanisms of tryptophan fluorescence shifts in proteins. Biophys J. 2001;80:2093–2109. doi: 10.1016/S0006-3495(01)76183-8. [DOI] [PMC free article] [PubMed] [Google Scholar]
- 5.Callis PR. 1La and 1Lb transitions of tryptophan: applications of theory and experimental observations to fluorescence of proteins. Methods Enzymol. 1997;278:113–150. doi: 10.1016/s0076-6879(97)78009-1. [DOI] [PubMed] [Google Scholar]
- 6.Pan CP, Callis PR, Barkley MD. Dependence of tryptophan emission wavelength on conformation in cyclic hexapeptides. J Phys Chem B. 2006;110:7009–7016. doi: 10.1021/jp056164p. [DOI] [PubMed] [Google Scholar]
- 7.Gasymov OK, Abduragimov AR, Yusifov TN, Glasgow BJ. Site-directed tryptophan fluorescence reveals the solution structure of tear lipocalin: evidence for features that confer promiscuity in ligand binding. Biochemistry. 2001;40:14754–14762. doi: 10.1021/bi0110342. [DOI] [PubMed] [Google Scholar]
- 8.Breustedt DA, Korndorfer IP, Redl B, Skerra A. The 1.8-A crystal structure of human tear lipocalin reveals an extended branched cavity with capacity for multiple ligands. J Biol Chem. 2005;280:484–493. doi: 10.1074/jbc.M410466200. [DOI] [PubMed] [Google Scholar]
- 9.Herskovits TT, Sorensen M. Studies of the location of tyrosyl and tryptophyl residues in protein. II. Applications of model data to solvent perturbation studies of proteins rich in both tyrosine and tryptophan. Biochemistry. 1968;7:2533–2542. doi: 10.1021/bi00847a013. [DOI] [PubMed] [Google Scholar]
- 10.Fasman GD, editor. Circular dichroism and the conformational analysis of biomolecules. Plenum Press; New York: 1996. [Google Scholar]
- 11.Broos J, Tveen-Jensen K, de Waal E, Hesp BH, Jackson JB, Canters GW, Callis PR. The Emitting State of Tryptophan in Proteins with Highly Blue-Shifted Fluorescence. Angew Chem Int Ed Engl. 2007;46:5137–5139. doi: 10.1002/anie.200700839. [DOI] [PubMed] [Google Scholar]
- 12.Strickland EH. Aromatic contributions to circular dichroism spectra of proteins. CRC Crit Rev Biochem. 1974;2:113–175. doi: 10.3109/10409237409105445. [DOI] [PubMed] [Google Scholar]
- 13.Callis PR, Liu T. Quantitative prediction of fluorescence quantum yields for tryptophan in proteins. J Phys Chem B. 2004;108:4248–4259. [Google Scholar]
- 14.Barth A, Martin SR, Bayley PM. Resolution of Trp near UV CD spectra of calmodulin-domain peptide complexes into the 1La and 1Lb component spectra. Biopolymers. 1998;45:493–501. doi: 10.1002/(SICI)1097-0282(199806)45:7<493::AID-BIP3>3.0.CO;2-J. [DOI] [PubMed] [Google Scholar]
- 15.Gasymov OK, Abduragimov AR, Yusifov TN, Glasgow BJ. Resolving near-ultraviolet circular dichroism spectra of single trp mutants in tear lipocalin. Anal Biochem. 2003;318:300–308. doi: 10.1016/s0003-2697(03)00215-x. [DOI] [PubMed] [Google Scholar]
- 16.Eftink MR, Selvidge LA, Callis PR, Rehms AA. Photophysics of indole derivatives: Experimental resolution of La and Lb transitions and comparison with theory. J Phys Chem. 1990;94:3469–3479. [Google Scholar]
- 17.Glasgow BJ, Heinzmann C, Kojis T, Sparkes RS, Mohandas T, Bateman JB. Assignment of tear lipocalin gene to human chromosome 9q34-9qter. Curr Eye Res. 1993;12:1019–1023. doi: 10.3109/02713689309029229. [DOI] [PubMed] [Google Scholar]
- 18.Redl B, Holzfeind P, Lottspeich F. cDNA cloning and sequencing reveals human tear prealbumin to be a member of the lipophilic-ligand carrier protein superfamily. J Biol Chem. 1992;267:20282–20287. [PubMed] [Google Scholar]
- 19.Glasgow BJ. Tissue expression of lipocalins in human lacrimal and von Ebner's glands: colocalization with lysozyme. Graefes Arch Clin Exp Ophthalmol. 1995;233:513–522. doi: 10.1007/BF00183433. [DOI] [PubMed] [Google Scholar]
- 20.Cormack B. Current Protocol in Molecular Biology. 15. Greene Pub. Associates and Wiley-Interscience; New York, N.Y: 1987. [Google Scholar]
- 21.Gasymov OK, Abduragimov AR, Yusifov TN, Glasgow BJ. Binding studies of tear lipocalin: the role of the conserved tryptophan in maintaining structure, stability and ligand affinity. Biochim Biophys Acta. 1999;1433:307–320. doi: 10.1016/s0167-4838(99)00133-8. [DOI] [PubMed] [Google Scholar]
- 22.Marston FAO. The Purification of Eukaryotic Polypeptides Expresses in Eschericia coli, The Purification of Eukaryotic Polypeptides Expresses in Eschericia coli. In: Glover DM, editor. DNA Cloning: a practical approach. IRL Press; Oxford, England: 1987. pp. 59–88. [Google Scholar]
- 23.Glasgow BJ, Abduragimov AR, Farahbakhsh ZT, Faull KF, Hubbell WL. Tear lipocalins bind a broad array of lipid ligands. Curr Eye Res. 1995;14:363–372. doi: 10.3109/02713689508999934. [DOI] [PubMed] [Google Scholar]
- 24.Bozimowski D, Artiss JD, Zak B. The variable reagent blank: protein determination as a model. J Clin Chem Clin Biochem. 1985;23:683–689. doi: 10.1515/cclm.1985.23.10.683. [DOI] [PubMed] [Google Scholar]
- 25.Strickland EH, Billups C. Oscillator strengths of the 1La and 1Lb absorption bands of tryptophan and several other indoles. Biopolymers. 1973;12:1989–1995. doi: 10.1002/bip.1973.360120906. [DOI] [PubMed] [Google Scholar]
- 26.Gasymov OK, Abduragimov AR, Yusifov TN, Glasgow BJ. Resolution of ligand positions by site-directed tryptophan fluorescence in tear lipocalin. Protein Sci. 2000;9:325–331. doi: 10.1110/ps.9.2.325. [DOI] [PMC free article] [PubMed] [Google Scholar]
- 27.Gasymov OK, Abduragimov AR, Yusifov TN, Glasgow BJ. Structural changes in human tear lipocalins associated with lipid binding. Biochim Biophys Acta. 1998;1386:145–156. doi: 10.1016/s0167-4838(98)00092-2. [DOI] [PubMed] [Google Scholar]
- 28.Woody RW. Contributions of tryptophan side chains to the far-ultraviolet circular dichroism of proteins. Eur Biophys J. 1994;23:253–262. doi: 10.1007/BF00213575. [DOI] [PubMed] [Google Scholar]
- 29.Woody RW. Aromatic side-chain contributions to the far ultraviolet circular dichroism of peptides and proteins. Biopolymers. 1978;17:1451–1497. [Google Scholar]
- 30.Strickland EH, Billups C, Kay E. Effects of hydrogen bonding and solvents upon the tryptophanyl 1La absorption band. Studies using 2,3-dimethylindole. Biochemistry. 1972;11:3657–3662. doi: 10.1021/bi00769a025. [DOI] [PubMed] [Google Scholar]
- 31.Reichardt C. Solvatochromic dyes as solvent polarity indicators. Chem Rev. 1994;94:2319–2358. [Google Scholar]
- 32.Lakowicz JR. Principles of Fluorescence Spectroscopy. 3. Springer; New York: 2006. [Google Scholar]
- 33.Angulo M, Hawat C, Hofmann HJ, Berger S. Site-specific solvation determined by intermolecular nuclear Overhauser effect--measurements and molecular dynamics. Org Biomol Chem. 2003;1:1049–1052. doi: 10.1039/b211134a. [DOI] [PubMed] [Google Scholar]
- 34.Winsor P, Cole RH. Dlelectrlc properties of electrolyte solutions. 1. Sodium iodide in seven solvents at various temperatures. J Phys Chem. 1982;86:2486–2490. [Google Scholar]
- 35.Sharma M, Resta R, Car R. Dipolar correlations and the dielectric permittivity of water. Phys Rev Lett. 2007;98:247401. doi: 10.1103/PhysRevLett.98.247401. [DOI] [PubMed] [Google Scholar]
- 36.Glasgow BJ, Abduragimov AR, Yusifov TN, Gasymov OK. Studies of ligand binding and CD analysis with apo- and holo-tear lipocalins. Adv Exp Med Biol. 1998;438:105–112. doi: 10.1007/978-1-4615-5359-5_14. [DOI] [PubMed] [Google Scholar]
- 37.Lovell SC, Word JM, Richardson JS, Richardson DC. The penultimate rotamer library. Proteins. 2000;40:389–408. [PubMed] [Google Scholar]
- 38.McGregor MJ, Islam SA, Sternberg MJ. Analysis of the relationship between side-chain conformation and secondary structure in globular proteins. J Mol Biol. 1987;198:295–310. doi: 10.1016/0022-2836(87)90314-7. [DOI] [PubMed] [Google Scholar]
- 39.Minor DL, Jr, Kim PS. Context is a major determinant of beta-sheet propensity. Nature. 1994;371:264–267. doi: 10.1038/371264a0. [DOI] [PubMed] [Google Scholar]
- 40.Lietzow MA, Hubbell WL. Motion of spin label side chains in cellular retinol-binding protein: correlation with structure and nearest-neighbor interactions in an antiparallel beta-sheet. Biochemistry. 2004;43:3137–3151. doi: 10.1021/bi0360962. [DOI] [PubMed] [Google Scholar]
- 41.Guex N, Peitsch MC. SWISS-MODEL and the Swiss-PdbViewer: an environment for comparative protein modeling. Electrophoresis. 1997;18:2714–2723. doi: 10.1002/elps.1150181505. [DOI] [PubMed] [Google Scholar]
Associated Data
This section collects any data citations, data availability statements, or supplementary materials included in this article.


