

Abstract
Urinary exosomes containing apical membrane and intracellular fluid are normally secreted into the urine from all nephron segments, and may carry protein markers of renal dysfunction and structural injury. We aimed to discover biomarkers in urinary exosomes to detect acute kidney injury (AKI) which has a high mortality and morbidity. Animals were injected intravenously with cisplatin. Urinary exosomes were isolated by differential centrifugation. Protein changes were evaluated by two-dimensional difference in gel electrophoresis and changed proteins were identified by MALDI-TOF-TOF or LC-MS/MS. The identified candidate biomarkers were validated by western blotting in individual urine samples from rats subjected to cisplatin injection; bilateral ischemia and reperfusion (I/R); volume depletion (VD); and ICU patients with and without AKI. We identified 18 proteins that were increased and 9 proteins that were decreased 8 hr after cisplatin. Most of the candidates could not be validated by western blotting. However, exosomal Fetuin-A increased 52.5-fold at day 2 (1 day before serum creatinine increase and tubule damage) and remained elevated 51.5-fold at day 5 (peak renal injury) after cisplatin injection. By immuno-electron microscopy and elution studies, Fetuin-A was located inside urinary exosomes. Urinary Fetuin-A was increased 31.6-fold in the early phase (2~8hr) of ischemia/reperfusion, but not in prerenal azotemia. Urinary exosomal Fetuin-A also increased in three ICU patients with AKI compared to the patients without AKI. We conclude that 1) Proteomic analysis of urinary exosomes can provide biomarker candidates for the diagnosis of AKI; 2) Urinary Fetuin-A might be a predictive biomarker of structural renal injury.
Keywords: exosomes, AKI, rats, ICU patients, cisplatin, ischemia, sepsis, mass spectrometry
INTRODUCTION
Acute kidney injury still has a high morbidity and mortality rate of 25 to 70% 1. Although numerous agents are effective in animals, the translation of an effective drug therapy for AKI from laboratory bench to beside has been difficult 1–4 Novel biomarkers for early detection and accurate diagnosis of AKI will likely help speed the translation of new treatments for AKI. To achieve this goal, the development of novel non-invasive biomarkers to predict and evaluate severity of AKI is essential 4, 5.
Serum creatinine (SCr) has poor sensitivity and specificity to detect or grade the severity of AKI: patients are not in steady state, hence SCr lags behind both renal injury and renal recovery 3. Urine is an ideal non-invasive source of biomarkers to diagnose and classify kidney diseases. However, conventional urine markers (casts, fractional excretion of sodium) are nonspecific and insensitive. Recently, we successfully isolated exosomes from human urine by differential centrifugation and demonstrated the presence of several disease-related proteins6, 7. Exosomes containing vesicular membranes and intracellular fluid are normally secreted into the urine from all nephron segments, and contain proteins that may be altered in abundance or physical properties in association with various renal diseases. Urinary exosomes represent a new source for the discovery of non-invasive urinary biomarkers that can overcome much of the interference from the most abundant urinary proteins (albumin, globulin, and Tamm-Horsfall protein etc)8.
Recently, several novel urinary biomarkers have been discovered using genomic methods as potentially useful for prediction and diagnosis of AKI. Kidney injury molecule-1 (KIM-1) 7, 9, 10 and neutrophil gelatinase-associated lipocalin (NGAL) 11–14 have been demonstrated as early predictors for diagnosis or outcome in AKI patients and animal models. Interleukin (IL-18) 15, 16, sodium/hydrogen exchanger isoform 3 (NHE3) 17 and Cystatin C 18 have also been verified to serve as biomarkers in small numbers of patients with AKI. Cysteine rich protein 61 (CYR61) 19, dendrimer-enhanced magnetic resonance imaging (MRI) 20, malondialdehyde (MDA) 21, keratinocyte-derived chemokine (KC)22, and meprin-1-alpha23 have been reported to early detect renal injury in AKI animal models. Because these biomarkers have only been validated for animals with AKI or a small number of patients, their translation to clinical application still needs further development and each biomarker currently has limitations 5. Additional new urinary biomarkers may be required to improve early detection and new drug development in AKI.
The purpose of the present study was to discover new biomarker candidates for AKI. For this purpose, we selected a cis-Diammineplatium (II) dichloride (cisplatin)-induced AKI rat model, which is non-oliguric despite nephrotoxic tubular injury, for discovery of biomarkers in urinary exosomes. After the identification by mass spectrometry, we validated the potential candidates using western blotting. We selected Fetuin-A, which is synthesized in liver and secreted into blood, to examine its temporal excretion in the urinary exosomal fraction in different types of AKI animal models to verify whether it can predict the occurrence of structural renal injury. We also measured urinary exosomal Fetuin-A in a small number of ICU patients with and without AKI for a preliminary assessment of the potential of this biomarker.
RESULTS
Induction of AKI
Cisplatin injection (6 mg/kg, i.v.) induced a significant increase in serum creatinine (SCr) and renal morphological damage including extensive tubular damage and intra-tubular cast formation in the outer stripe of the outer medulla (OSOM). SCr and BUN increased significantly by day 3, reached a peak at day 5, and then gradually returned to the basal value by day 14 (Fig. 1A and B). Tubule morphology was normal on day 2, the brush border began to detach at day 3, tubular damage was most severe at day 5, and then gradually recovered thereafter (Fig. 2 A–E). However, renal function and histology was still normal at 2 days after cisplatin injection.
Figure 1. Serum creatinine (SCr) and blood urea nitrogen (BUN) in cisplatin-induced AKI in rats (n=56).
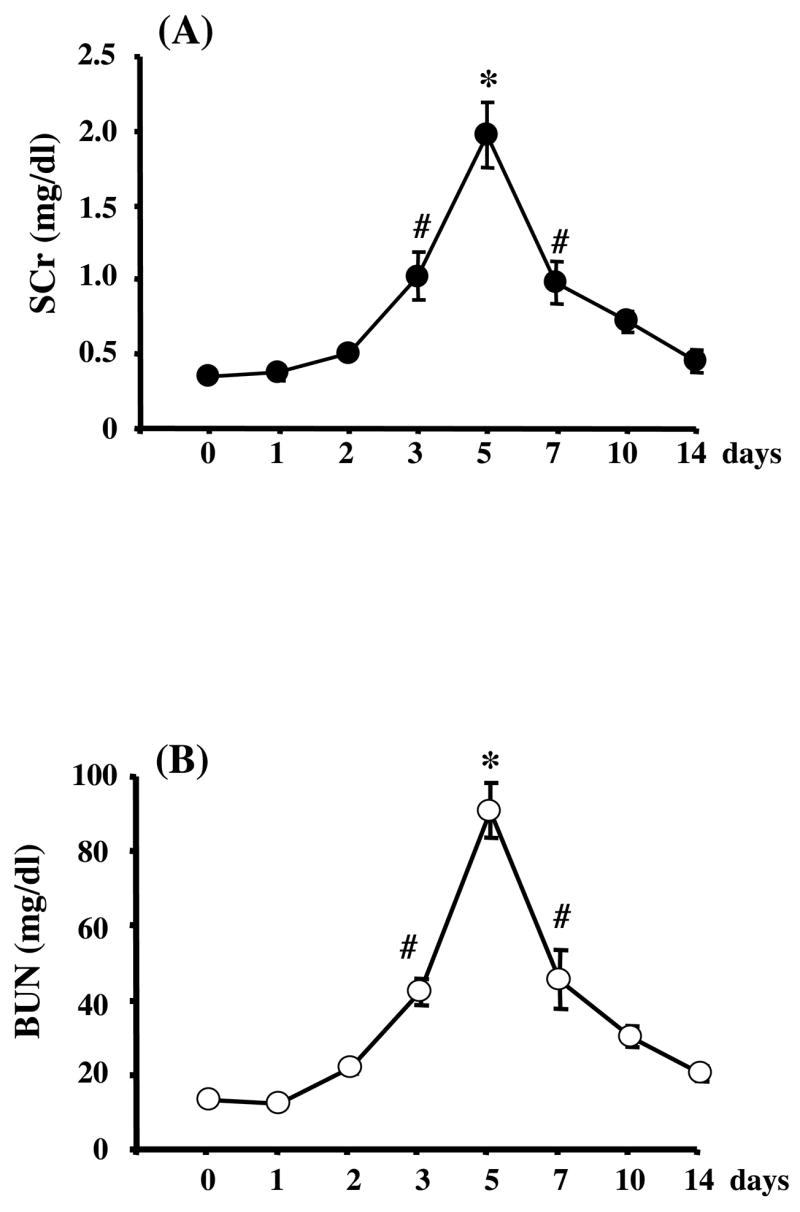
SCr (A) and BUN (B) increased significantly on day 3, peaked at day 5, and returned to baseline at day 14 after cisplatin injection. Data are means ± SEM. *P<0.01, #p<0.05 versus day 0.
Figure 2. Histology of the kidney sections stained with periodic acid-Schiff reagent in the outer stripe of the outer medulla (OSOM) after renal injury.
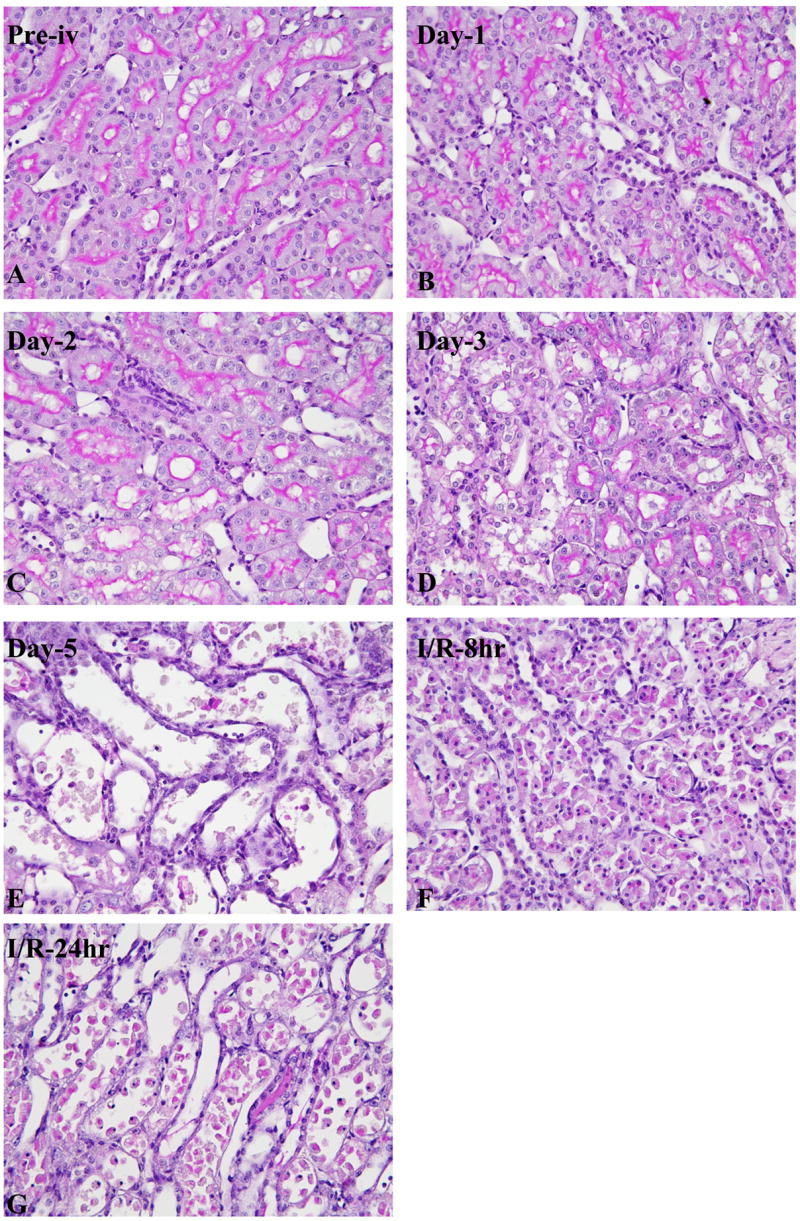
Temporal morphologic change of OSOM before (A), and at day 1 (B), day 2 (C), day 3 (D), day 5 (E) after cisplatin injection. Kidney 8 hr (F) and 24 hr (G) reperfusion after 37 min of bilateral ischemia.
Bilateral ischemia for 37 min and reperfusion (I/R) increased SCr (from 0.47 ± 0.04 mg/dl to 1.0 ± 0.42 mg/dl at 8 hr, 1.57 ± 0.22 mg/dl at 24 hr after I/R) and caused tubular damage in the outer stripe of the outer medulla in kidney detectable at 8hr and 24hr (Fig 2F–G).
In contrast, a prerenal azotemia model generated by furosemide and low sodium diet caused volume depletion, weight loss (9.69 ± 0.99%) and moderately increased SCr (0.63 ± 0.04 mg/dl vs. 0.45 ± 0.04 mg/dl before treatment). No renal histology changes were detected (not shown).
Identification and validation of urinary exosomes-associated proteins
Cy dye-labeled urinary exosome-associated proteins were separated by two-dimensional difference in gel electrophoresis (2D-DIGE) (Fig. 3A). The DeCyder (BVA) software recognized 1769 spots; 19.4% increased by at least 1.5-fold and 13.3% decreased by at least 1.5-fold after cisplatin injection. Only 74 spots had 1) a student t-test p-value of ≤ 0.05, 2) a +/− 1.5-fold change after cisplatin injection, and 3) matched to the preparative gel (SYPRO ruby-stained gel). These 74 spots were picked from the SYPRO ruby-stained gel, and their peptide digests were analyzed by full scan MS followed by MS/MS using the MALDI-TOF/TOF for protein identification. 15 proteins were identified by MALDI-TOF/TOF (black numbers, Fig. 3A and upper portion of Table-1). Five proteins increased and ten proteins decreased after cisplatin injection (Fig. 3B). Four of the identified proteins were membrane-associated proteins (gray bar in Fig. 3B). Because many of the up-regulated (red) spots were not identified, we re-picked 14 red spots from the SYPRO Ruby gel and the gel plugs were manually digested and peptides ziptipped for LC-MS/MS analysis. 13 additional proteins were identified (white numbers, Fig 3A and lower portion of Table 1). By checking the tandem MS spectra of the corresponding fragment ions from these peptides, we found that Fetuin-A had high cross-correlation score (Xcorr = 4) and an excellent MS spectra feature (Fig. 4)
Figure 3.

Two dimensional differential in-gel electrophoresis (2D-DIGE) and the fold change of urinary exosome-associated proteins of rats before and after cisplatin injection. Urinary exosome-associated proteins were isolated from pooled 8 hr urine samples from 12 rats before and after cisplatin injection. (A) 2D-DIGE: shows increase (red), decrease (green) or no change (yellow) in abundance of exosome-associated proteins after cisplatin injection. Black numbers were spots identified by MALDI-TOF-TOF, white numbers were spots identified by LC-MS/MS. (B) Fold change of urinary exosome-associated proteins that were increased or decreased after cisplatin. The grey bars are membrane-associated proteins. Numbers (1) to (15) match the black numbers in 2D-DIGE (A).
Table 1.
Proteins identified by MALDI-TOF-TOF and LC-MS/MS
| spot | Protein identified by MALDI-TOF-TOF | MW | PI | |
|---|---|---|---|---|
| (1) | Salivary and hepatic alpha-amylase (α-Amylase) | 58 | 6.5 | |
| (2) | Beta-glucuronidase precursor | 75 | 6.3 | |
| (3) | glucan glucanohydrolase | 58 | 7.2 | |
| (4) | Serum amyloid P-component precursor (SAP) | 26 | 5.5 | |
| (5) | Serum albumin precursor | 71 | 6.1 | |
| (6) | Annexin IV | 36 | 5.3 | |
| (7) | Chloride intracellular channel protein 1(NCC27) | 27 | 5.1 | |
| (8) | Annexin V (Anchorin CII) | 36 | 4.9 | |
| (9) | Malate dehydrogenase, cytoplasmic (MDH) | 36 | 6.2 | |
| (10) | Actin, cytoplasmic 1 (Beta-actin) | 42 | 5.3 | |
| (11) | Heat shock cognate 71 kDa protein (HSP70) | 71 | 5.4 | |
| (12) | Regucalcin (Senescence marker protein 30) | 34 | 5.3 | |
| (13) | V-ATPase 69 kDa subunit 1 | 69 | 5.6 | |
| (14) | Enolase 1 | 47 | 6.2 | |
| (15) | (GSH-S) synthetase | 53 | 5.5 | |
|
| ||||
| New hits | Protein identified by LC-MS/MS | MW | PI | Spots in 2-D map |
|
| ||||
| 1 | Keratin, type II cytoskeletal 8 | 54 | 5.8 | |
| type II cytoskeletal 1b | 57 | 5.5 | ||
| type I cytoskeletal 21 | 49 | 5.3 | Identified in spot 1–14 | |
| 2 | ANXA2_RAT Annexin A2 (Annexin II) (Lipocortin II) | 38 | 5.7 | Spots 2,3 5 |
| 3 | EF1A2_RAT Elongation factor 1-alpha 2 (EF-1-alpha-2) | 50 | 9.1 | Spot 1 |
| 4 | KPYM_RAT Pyruvate kinase, isozymes M1/M2 | 57 | 6.6 | Spot 3, 5 |
| 5 | RAT Histone H2B, | 14 | 10.3 | Spot 2 |
| Histone H4 | 11 | 11.4 | Spot 8, 11 | |
| 6 | MYH9_RAT Myosin heavy chain, nonmuscle type A | 23 | 5.5 | Spot 2 |
| 7 | NHERF_RAT Ezrin-radixin-moesin binding phosphoprotein 50 | 39 | 5.7 | Spot 3 |
| 8 | MUP_RAT Major urinary protein precursor (MUP) | 21 | 5.8 | Spot 10 |
| 9 | PCLO_RAT Piccolo protein (Multidomain presynaptic cytoma) | 55 | 6.1 | Spot-10 |
| 10 | FETUA_RAT Alpha-2-HS-glycoprotein precursor (Fetuin-A) | 37 | 6.1 | Spot 12, 13 |
| 11 | GFAP_RAT Glial fibrillary acidic protein, astrocyte | 50 | 5.4 | Spot 12 |
| 12 | GSH0_RAT Glutamate--cysteine ligase regulatory subunit | 31 | 5.4 | Spot 8 |
| 13 | Serum amyloid P-component precursor (SAP) | 2.6 | 5.5 | Spot 7, 8, 9 |
Figure 4. Identification of Fetuin-A protein by LC-MS/MS.

MS2 spectra of a Fetuin-A peptide (sequence: LGGEEVSVACK). The red peaks indicate matched b-ion series, the blue peaks indicate matched y-ion series, and the black peaks indicated unmatched ions. The majority of peaks are matched in agreement with the high cross-correlation score (Xcorr = 4).
We used western blot analysis to validate these identified proteins by MALDI-TOF-TOF or LC-MS/MS in urinary exosomes from individual rats 8 hr before and after cisplatin injection. Of 9 commercially available antibodies (see methods), only the Fetuin-A (increased) and Annexin V (decreased) results were consistent with the 2-D DIGE analysis after cisplatin injection. The other proteins either could not be detected by the available antibodies, or changed in the opposite direction than that predicted by 2D-DIGE (data not shown). We selected Fetuin-A as a candidate biomarker for further.
Temporal urinary excretion of exosomal Fetuin-A in different types of AKI
We selected Fetuin-A to investigate its temporal excretion normalized to urine flow rate (per hr) in several renal injury models based on our observation that it increased during the early phase of cisplatin-induced AKI. Urinary Fetuin-A increased 2.75-fold at 24 hr after cisplatin injection, peaked 52.5-fold at day 2 after cisplatin injection, and remained elevated (51.5-fold) until day 5 compared to normal urine samples (Fig. 5A). We found that Fetuin-A was detected 2 days before the occurrence of SCr increase and tubular damage (Fig. 1 and 2). We verified that the upper two of these multiple bands were Fetuin-A when compared to bovine Fetuin-A as a positive control and pre-adsorbing antibody with Fetuin-A agarose as a negative control (supplementary Fig. 8A). Urinary exosomal Fetuin-A also increased significantly 2–8 hr after 15, 30, and 40 mins of ischemia and reperfusion, then remained at an elevated level in the 8–24 hr collection. And also the abundance of urinary Fetuin-A was correlated positively to the level of SCr at 24 hr after I/R (Fig. 5B). In addition, a 31.6-fold of average increment was observed in urinary Fetuin-A 2–8 hr after 37 mins ischemia and reperfusion (supplementary Fig. 8B). We also examined urinary Fetuin-A in prerenal azotemia rats and normal rats as controls. Fetuin-A was not detected in 1 hr urine collection both groups of rats (Fig. 5C). After increasing protein loading and increasing the exposure time, Fetuin-A could be detected, but was not different between normal and prerenal azotemic rats (p=0.7) (supplementary Fig. 8C). To compare the expression of urinary Fetuin-A in the different models of AKI, we selected one rat from each of the three AKI models (pre-, day 0, 1, and 2 after cisplatin; pre- and 2–8 hr after I/R; pre- and 24–30 hr after VD) and loaded 1hr collections of urinary exosomal proteins on a single gel to reduce the bias created from separate gels. Urinary Fetuin-A was only detected in the early phase of cisplatin-or I/R-induced AKI but not in VD animal. The trend of Fetuin-A is the same as the separate gels (Fig. 5 C).
Figure 5. Temporal excretion of urinary exosomal Fetuin-A in AKI animal models and human subjects by western blotting analysis.

(A) Cisplatin-induced AKI rats (typical result from 3 replicates), (B) I/R-induced AKI rats (in 15, 30, and 40 mins of bilateral ischemia and reperfusion), (C) one blot of above three types of AKI rats (one rat pre-, day 0, day 1, and day 2 after cisplatin; one rat from pre- and 8 hr after I/R; one rat from pre- and 24–30 hr after VD), and (D) ICU patients with and without AKI compared to healthy volunteers.
Distribution of Fetuin-A in urine
Fetuin-A is synthesized in liver and secreted in blood. We hypothesized that blood Fetuin-A might be filtered at the glomerulus, escape tubular reabsorption, and hence appear in a soluble non-exosomal fraction. Alternatively, Fetuin-A could be excreted in detached epithelial cells and appear in the cast fraction. We checked these urinary compartments, using urine samples from day 2 after cisplatin injection which had high levels of exosomal Fetuin-A. First, we isolated proteins from the cast fraction (17,000 × g pellet) and exosome fraction (200,000 × g pellet) by differential centrifugation; proteins from whole urine, 17,000 × g supernatant, and 200,000 × g supernatant (exosome-free fraction) were precipitated. By western blot analysis, most of urinary Fetuin-A appeared in the urinary exosome fraction; only a small amount of Fetuin-A was detected in urinary casts (Fig. 6A). Then we compared the effect of washing the 200,000 × g pellets with isolation solution to remove free, soluble Fetuin-A that could possibly adhere to the outer surface of vesicles. No difference of urinary exosomal Fetuin-A was found between 200,000 × g pellets with and without washing (Fig. 6B). Finally, immuno-electron microscopy (IEM) was used to determine whether urinary Fetuin-A is located inside of urine vesicles. Fetuin-A was found inside of urine vesicles (Fig. 6C). In the contrast, no positive stained particles were detected inside or outside of urinary vesicles in negative control samples (data not shown). Taken together, these studies demonstrated that Fetuin-A was mostly excreted in the exosome fraction of urine.
Figure 6. The distribution of Fetuin-A in rat urine 2 days after cisplatin injection.

(A) The secretion of Fetuin-A in different urinary fractions from the same urine sample (lane 1: 200,000 × g pellets, lane 2: 17,000 × g pellets, lane 3: whole urine, lane 4: 17,000 × g supernatant, and lane 5: 200,000 × g supernatant) by western blot analysis. The lower label indicates the original volume of urine used for each lane. (B) Comparison of urinary exosomal Fetuin-A in the 200,000 × g pellets without and with washing by isolation solution (lane 1: unwashed pellet; lane 2: washed pellets). (C) Fetuin-A located inside of urinary vesicles in 200,000 × g pellets by immunoelectron microscopy, Bar=100 nm. Inset shows a magnified image of a urinary vesicle labeled with gold-conjugated anti-Fetuin-A.
Location of Fetuin-A in rat kidney during development of AKI
Fetuin-A was not detected by immunohistochemical examination in normal kidney or day 1 and was barely detectable in the cytoplasm of tubule epithelial cells in the outer stripe of the outer medulla (OSOM) staining on day 2 after cisplatin (Fig. 7 A and B). The staining of Fetuin-A increased significantly in proximal tubular cells with normal structure and few damaged tubules on day 3 (Fig. 7C), no positive staining was detected in the day3 kidney sections with renal structural injury when primary Fetuin-A antibody was instead of normal donkey serum (Fig. 7E); and then was expressed highly in the detached tubular cells in the tubule lumen on day 5 after cisplatin injection (Fig. 7D). After ischemia reperfusion, positive staining of Fetuin-A increased significantly in partially damaged proximal tubule cells at 8 hr and was restricted to the detached cells in the lumen by 24 hr after the surgery compared to the sham kidney (Fig. 7F–H).
Figure 7. Location of Fetuin-A in outer stripe of the outer medulla (OSOM) of rat kidney.
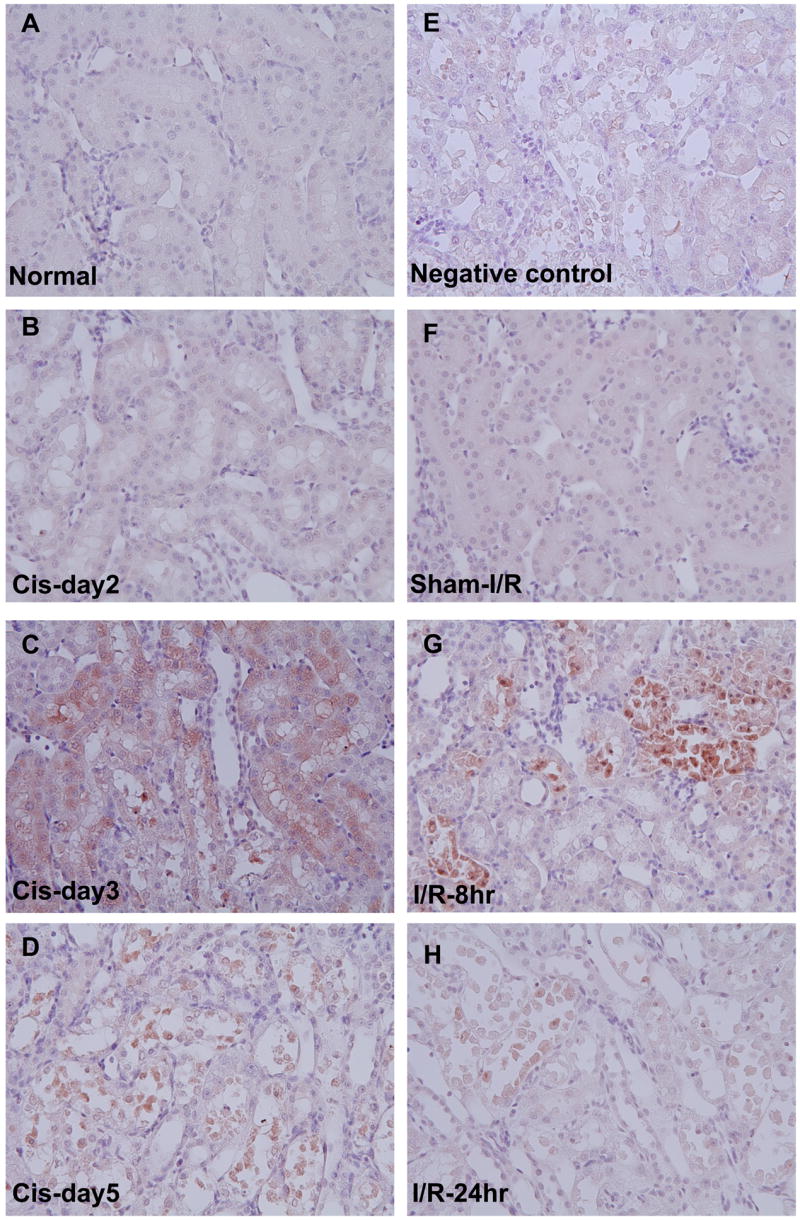
Left panel: Temporal immunohistochemistry staining for Fetuin-A in OSOM of kidneys before (A) and at day 2 (B), day 3 (C), and day 5 (D) after cisplatin injection in rats. Right panel: Negative control (injured kidney section at day 3 after cisplatin) (E), Sham surgery for Ischemia and reperfusion (I/R) (F), I/R rats at 8 hr (G), and 24 hr (H) after I/R.
Urinary exosomal Fetuin-A in Intensive Care Unit (ICU) patients
Spot urine samples were collected and stored at −80°C from three healthy volunteers (age 34~43), three ICU patients with AKI, and three ICU patients without AKI. The clinical details of the ICU patients are listed in Table 2. We isolated exosome-associated proteins from these urine samples and examined the abundance of Fetuin-A normalized by urine creatinine using western blot analysis. Urinary exosomal Fetuin-A increased significantly in ICU patients with AKI compared to either healthy volunteers or ICU patients without AKI (Fig. 5D).
Table 2.
Characteristics of ICU patients in the study
| patients | Age/gender | Primary diagnosis |
APACHE II score |
AKI | Serum Creatinine (mg/dl) |
Blood urea nitrogen (mg/dl) |
urine output (ml/day) |
Furose mide (mg) |
blood culture |
SIRS | sepsis | WBC | temperature |
|---|---|---|---|---|---|---|---|---|---|---|---|---|---|
| 1 | 86/M | MI, AKI, pneumothorax | 22 | Yes | 2.0 | 36 | 207 | 100 | No | no | no | 11.79 | 37.3 |
| 2 | 67/M | COPD lung cancer AKI | 14 | Yes | 3.4 | 89 | 477 | 80 | No | no | no | 17.86 | 37.4 |
| 3 | 37/M | Pneumonia, ARDS | 21 | Yes | 2.1 | 54 | 2381 | none | No | yes | yes | 2.9 | 38.2 |
| 4 | 50/F | meningitis | 10 | No | 0.8 | 11 | 2468 | none | Yes (+) | yes | yes | 12.46 | 37.8 |
| 5 | 42/M | Pneumonia | 9 | No | 0.6 | 11 | 2135 | 20 | No | yes | no | 14.77 | 38.5 |
| 6 | 41/F | DM, necrotizing, fascitis | 17 | No | 0.4 | 16 | 1617 | none | Yes(+) | yes | yes | 10.76 | 38.7 |
APACHE II: Acute Physiology And Chronic Health Evaluation; AKI: acute kidney injury; MI, myocardial infarction; COPD, chronic obstructive pulmonary disease; ARDS, acute respiratory distress syndrome; DM, diabetes mellitus;
DISCUSSION
Urine is an ideal source for discovery of non-invasive biomarkers and it is likely that multi-variable assessment tools that incorporate both biomarkers and clinical information can enhance the diagnostic and predictive accuracy in a complex disease such as AKI 5. Recently, it has been suggested that proteomic techniques including high-throughput identification of proteins may be useful to discover urinary biomarkers for various kidney diseases 23, 24. These methods have thus far identified that abundant proteins or well-known proteins such as albumin, transferrin, and α-1-antitrypsin are increased in glomerular diseases 24; and urinary β2 microglobulin, retinol-binding protein, and carbonic anhydrase are increased in acute renal allograft rejection 25. However, these abundant proteins lack specificity for diagnosis of disease and impede the discovery of new biomarkers, especially in glomerular diseases. It has been hypothesized that the low abundance urinary proteins might be better targets for biomarker discovery 26. However, the removal of interfering abundant proteins might also remove less abundant proteins that bind to the abundant proteins.
Recently, exosomes containing both membrane and cytosolic proteins were isolated from normal human urine by differential centrifugation, and exosomal proteins related to kidney diseases were identified by LC-MS/MS 7. Exosomal protein biomarkers might be clinically useful biomarkers; Du Cheyron et al reported that NHE3, a membrane protein increased in acute tubule necrosis (ATN) patients but not in prerenal azotemia or acute glomerular diseases 17. We thought that this urinary compartment, containing a reduced protein complexity and depleted predominant proteins, might be used for biomarker discovery, particularly for proteins that might indicate structural renal disease.
We investigated urinary exosomes from cisplatin-induced AKI rats for biomarker discovery by 2-D DIGE. We could identify only 20% of the picked spots, and only 26 % of the identified proteins were membrane-associated proteins, potentially caused by insufficient solublization, limited access to trypsin sites, or low abundance of membrane proteins. We also had great difficulty validating the DIGE results, perhaps due to the pitfalls inherent in 2-D analysis, including changes in spot position due to post-translational modification or the presence of multiple proteins per spot, or to insensitive antibodies. Further research to more effectively solubilize membrane proteins, optimize analytical protocols, and improve the detection of post-translational modifications will be required to overcome these current limitations in the proteomics field.
Nevertheless, we did find that one excreted exosomal protein, Fetuin-A (P24090), that was increased after renal injury and could be validated by western blotting. Two red spots (spots 12 and 13) that were increased after cisplatin were identified as Fetuin-A by LC-MS/MS on the third survey of the gel. However, the position of these spots on the 2-D gel did not match the predicted molecular weight (MW) and isoelectric point (pI). We hypothesize that cleavage of Fetuin-A occurred prior to 2-D electrophoresis and that intact Fetuin-A with correct MW and pI was not seen because Fetuin-A is highly glycosylated. Fetuin-A, also known as alpha-2-HS-glycoprotein (NP_001613), was identified by MALDI-TOF MS in a previous proteomic analysis of human urinary proteins isolated by acetone precipitation 27. However, Fetuin-A was not identified by MALDI-TOF MS or LC-MS/MS in normal urinary exosomal proteins isolated by ultracentrifugation from either human 7, 27 or male Sprague-Dawley rats 28.
We found that most of urinary Fetuin A was detected in the 200,000 × g pellet. Only a small amount was in the 17,000 × g pellet, and none was detected in the supernatant of 200,000 × g after AKI. Washing the 200,000 × g pellet to remove bound Fetuin-A that could adhere to the outer surface of vesicles, did not affect the abundance of urinary Fetuin-A. Moreover, immuno-EM revealed Fetuin-A located inside of urinary vesicles; a previous study also demonstrated that Fetuin-A is located in the vesicles from culture medium of human vascular smooth muscle cells (VSMC) 29.
The quantification of Fetuin-A identified by 2-D DIGE was validated by the low abundance or lack of Fetuin-A in normal urine and kidney when compared to the large increase in urine and kidney in animal models of cisplatin and ischemia-reperfusion, and in human ICU patients with acute kidney injury (AKI). Fetuin-A increased two days earlier than serum creatinine in cisplatin-induced AKI and before serum creatinine increased in I/R-induced AKI. Urinary Fetuin-A was detectable one day before recognition of morphological injury and remained high while structural renal injury was present morphologically. Fetuin-A did not increase following volume depletion (prerenal azotemia) which is sometimes difficult to differentiate from structural renal injury in the clinic. Urinary Fetuin-A showed a similar spectrum compared to the other current early urinary biomarkers in AKI models, such as KIM-1, NGAL, IL-18, and NAG 5. However, Fetuin-A has two interesting characteristics 1) it has a very large dynamic range, similar to NGAL, but much larger than KIM-1, and 2) the modestly delayed onset in cisplatin, compared to the immediate increase of other markers such as NGAL, suggests that Fetuin-A might be useful to detect structural injury, not early renal response to injury. Taken together, the pre-clinical animal data suggests that urinary exosomal Fetuin-A might serve as an additional urinary biomarker to predict structural renal injury.
We also found that urinary exosomal Fetuin-A was much higher in ICU patients with AKI compared to faint expression of Fetuin-A in ICU patients without AKI, and was not detected in the urine exosome fraction of healthy volunteers, consistent with the previous study7. Mortality and morbidity of sepsis-induced AKI in ICU remains high. A simple urinary biomarker has limitations in a complex population such as ICU patients with AKI. Sepsis-induced AKI is often difficult to diagnose because patients are volume expanded, which depresses serum creatinine, and the fractional excretion of sodium (FENa) may be low despite irreversible renal injury 30. Recent studies have found that urinary NGAL increased 2 hours after cardiac surgery and can accurately predict AKI in children; however, it does not perform as well in adult ICU patients with multi-factorial AKI 12. Urinary IL-18 increased at 4–6 hr after cardiac surgery 31 and also increased 24 hrs before SCr in ICU patients with AKI. Both urinary NGAL and IL-18 could also partially predict the outcome of AKI 16. Du Cheyron et al reported that urinary NHE3 isolated by ultracentrifugation could distinguish ATN from other forms of AKI 17. It is likely that a panel of biomarkers, along with associated clinical information, will be required for early and accurate diagnosis of ICU patients with AKI. Our current studies suggest that urinary exosomal Fetuin-A might be useful in human AKI; however, additional studies will be needed to determine whether urinary Fetuin-A can predict, diagnose, track treatment effects, evaluate severity or prognosis in a large number of ICU patients and patients with typical ATN.
Possible mechanism of why urinary exosomal Fetuin-A is increased in AKI
Fetuin-A is synthesized in liver and secreted into the blood stream where it is a negative acute-phase response protein and plays its anti-inflammatory role via suppressing release of TNF-alpha induced by lipopolysaccharide (LPS) in vitro and vivo 32. Fetuin-A is also a systemically acting inhibitor of ectopic calcification 33, and decreased serum Fetuin-A concentration is associated with a higher mortality rate in dialysis patients and can predict mortality of chronic kidney diseases 34, 35. High plasma Fetuin-A levels are correlated with insulin resistance and fatty liver in human 36 and are also independently associated with metabolic syndrome in nondiabetic outpatients with coronary artery disease 37. However, the function of Fetuin-A in AKI is unknown.
We hypothesized that increased urinary exosomal Fetuin-A might be secreted from proximal tubule cells. A previous study reported that Fetuin-A was located in the developing kidney tubule in rat embryo by immunohistochemical staining 38. In present study, Fetuin-A was located in the cytoplasm of damaged proximal tubules that were attached on the basement membrane and at even higher concentration in proximal tubule cells that had detached from the tubule basement membrane. While exosomal Fetuin-A may be synthesized by the kidney, it may also appear in the urine as result of incomplete proximal tubule processing in proteinuria states (a form of overflow proteinuria) or released during tubular cell apoptosis. Fetuin-A was detected in apoptotic VMSC 29 and apoptotic cells have been demonstrated in tubular cells in cisplatin-or I/R-induced AKI in animals 39–41. We did not find evidence for free Fetuin-A that was filtered at the glomerulus, at least in the settings examined.
CONCLUSION
Proteomic methods can be used to discover candidate urinary biomarkers for AKI although the process in the present study is more difficult because of inefficiencies at the proteome identification and antibody recognition steps. Urinary exosomal Fetuin-A is increased in AKI, but not in prerenal azotemia. Urinary exosomal Fetuin-A is elevated in patients with AKI in ICU. Determination of the clinical value of urinary Fetuin-A requires further study in a large number of patients.
MATERIALS AND METHODS
AKI models and urine collection
Male Sprague-Dawley rats were purchased from Harlan Sprague Dawley Inc. (Indianapolis, IN, USA). All animals had free access to water and standard food and were treated in accordance with the National Institute of Health (NIH) guidelines for use and care of research animals. All urine samples from animals were collected using protease inhibitors in metabolic cages and then stored at −80°C until the isolation of exosome associated proteins as previously described 6.
Cisplatin-induced AKI (n=151): Rats (250–280 g; 8 weeks) were given by a single intravenous injection of cisplatin (6mg/kg body weight) (Sigma Corp, St. Louis, USA). Blood samples from the abdominal aorta were collected in 56 rats under isoflurane anesthesia before cisplatin (day 0) and at 1, 2, 3, 5, 7, 10, and 14 days after cisplatin injection. Urine samples were collected from 12 rats before (-24 to -16 hr) and 0–8 hr after cisplatin injection and pooled for biomarker discovery by proteomics analysis. We then collected urine samples from 4 individual cisplatin-treated rats for validation of the identified proteins. A second set of temporal urine samples were collected on 0 to 5 days from 3 additional rats for validation of Fetuin-A. Urine samples were also collected at day 2 after cisplatin for examining urinary immunoelectron microscopy.
Ischemia and reperfusion-induced AKI (n=12): Rats (180–210 g; 7 weeks) were subjected to respective 15, 30, and 40 minutes bilateral ischemia and reperfusion (I/R) and sham surgery (n=4) as previously described 19. Urine samples were collected at 2–8 hr and 8–24hr after I/R. Additional 8 rats were subjected to 37 minutes I/R for temporal urine collections at -24 to -18 hr before I/R, 2–8 hr and 8–24hr after I/R. The rats were sacrificed at 8 hr or 24 hr after I/R for the collection of blood samples and kidney tissues.
Volume depletion (VD) (n=4): Rats (380–400 g; 14 weeks) were fed a low salt diet (0.03%) (Diet Test Inc. Philadelphia, PA) 18 hr before intraperitoneal injection of furosemide as previously described 19. We collected 6 hr-urine samples from 4 rats at -24 to -18 hr before and 24–30 hr after VD. Rats were sacrificed at 33 hr after furosemide injection for blood collection.
Human samples: To verify the clinical potential of Fetuin-A, we also collected spot human urine samples from three healthy volunteers, three ICU patients with AKI and three ICU patients with and without AKI and sepsis. Samples were collected at George Washington University Intensive Care Unit under approval of the GW Institutional Review Board (Protocol 090013ER).
Examination of renal function
Serum creatinine (Scr) was measured by picric acid-based colorimetric autoanalyzer (Astra 8 autoanalyzer; Beckman Instruments, Fullerton, CA) and blood urea nitrogen (BUN) by an autoanalyzer (Hitachi 917, Boehringer Mannheim, Indianapolis, IN). The kidneys were examined for histology and immunohistochemistry. The harvested left kidney from each animal was immediately fixed in 10% neutral buffered formalin solution. The kidney tissue block was dehydrated through a graded alcohol series, embedded in paraffin, and cut into 4-μm sections and then stained with periodic acid Schiff (PAS) reagent.
Isolation of urinary exosome-associated proteins and depletion of Tamm-Horsfall protein
Urine samples were extensively vortexed immediately after they thawed. Urinary exosome-associated proteins were isolated by differential centrifugation (17,000 × g 15 mins to remove urinary sediment then 200,000 × g 1 hr pellet) as described previously 6, 7. The exosome-associated proteins isolated from the pooled urine samples were suspended by isolation solution (10 mM triethanolamine, 250 mM sucrose, pH 7.6). To partially deplete the abundant Tamm-Horsfall protein (THP), the suspensions were incubated with reducing agent dithiothreitol (DTT, 200 mg/ml) at 95°C for 2 min, and the samples were ultracentrifuged again. This procedure was repeated a second time, allowing the denatured THP to be released into the supernatant 7. The high spin pellets were solubilized in 2-D lysis buffer (7M urea, 2M thiourea, 4%CHAPS, 15 mM Tris pH8.5) for 2-D proteomic analysis. The concentration of protein was measured by 2-D quant protein assay (Amersham, Piscataway, NJ). For western blot analysis, exosome-associated proteins were isolated from individual rat urine samples and suspended by isolation solution. For comparison with urinary exosome fraction, acetone precipitation was used to concentrate the soluble protein in whole urine, 17,000 × g supernatant, and 200,000 × g supernatant 6.
Proteomics methods
2D-DIGE
2D gels were run in triplicate. Four hundred picomoles of CyDye were used to label 50 ug of protein as suggested in the manufacturer’s protocol: pre-cisplatin proteins were labeled with Cy 3; post-cisplatin proteins with Cy 5; a mixture of both proteins were labeled with Cy 2 as an internal standard. After quenching the reaction with10mM of lysine, the labeled samples were mixed together and rehydration buffer was added (7M urea, 2M thiourea, 4% CHAPS, 1% ampholytes pH3-10NL (Amersham), 40mM Dithiothreitol (DTT), and 0.0002% bromophenol blue). We also added 750rg of unlabeled protein mixture in another gel for SYPRO ruby staining in order to obtain protein identification. We normalized the loading proteins with and without cisplatin treatment by collection time. The mixed samples were run in triplicate, loaded on an immobilized pH gradient strip (24 cm; pH 3-10NL) for isoelectric focusing according to the following protocol: 30V for 14hr (active rehydration), 500V for 500 Vhr, 1,000V for 1,000Vhr, and 8,000 V for 66,667Vhr. Each strip was equilibrated for 15 min in a equilibration solution containing 50mM TrisθHCl, pH8.8, 6M urea, 30% glycerol, 2% SDS, 0.002% bromophenol blue with 0.5% DTT followed by a second 15 min equilibration with iodoacetamide (4.5%). Strip were briefly rinsed in 1X SDS-PAGE buffer and applied to a 12.5% polyacrylamide gel for electrophoresis at 5W/gel for 30 minutes followed by 17W/gel for 4hrs, 15°C.
Image acquisition and analysis
Cy dye labeled gels were scanned on a Typhoon 9400 variable mode imager (Amersham Biosciences) at an excitation wavelength of 520/40 (maximal/bandwidth) for Cy2 (laser-blue), 580/30 for Cy3 (laser-green), or 670/30 for Cy5 (laser-red) labeled samples. The PMT setting was adjusted to avoid signal saturation. The image resolution was 100:m. Images were then processed with Decyder Biological Variation Analysis (BVA) module v5.01 software (Amersham Biosciences) to match multiple 2-D DIGE gels for comparison and statistical analysis of protein abundance changes by spot fluorescence intensities. After protein spots were designated to be picked, the gel with 750:g protein was fixed in 30% methanol and 7% acetic acid for 1hr and incubated in SYPRO Ruby protein gel stain (Invitrogen) overnight. The pick gel was then washed 3 times with ultrapure water (Millipore) for 10min each wash. Next, the gel was scanned at an excitation wavelength of 610/30 to visualize all proteins in the gel. CyDye- and SYPRO-derived images were matched using BVA software, from which a pick list was generated.
Spot picking and protein identification
An automated Ettan Spot Handling Workstation (GE healthcare, Piscataway, NJ) was used for gel-spot picking, in-gel protein digestion with trypsin, and spotting on MALDI-plates, as previously described 42. Peptides were analyzed using the Proteomics Analyzer (ABI 4700 MALDI-TOF/TOF). Full scan MS spectra were obtained first, followed by MS/MS spectra. Protein identification was carried out using the search engine, MASCOT (Matrix Science). An additional 14 spots not identified by MALDI-TOF-TOF were picked with the Ettan Spot Handling Workstation then manually digested with trypsin and desalted with C18 Ziptips (Millipore, Billerica, MA). The extracted peptides were analyzed using the Finnigan LTQ mass spectrometer (Thermo Electron, San Jose, CA) according to the published procedure 43.
Western blot analysis
Exosome-associated protein samples (from urine samples of the same time for each rat) were separated by 1D SDS/PAGE electrophoresis and then gels were transferred to PVDF membranes. After blocking with 5% milk(1 hr), membranes were probed overnight at 4 °C with antibodies: rabbit polyclonal antibodies to Fetuin-A (1:500) (Novus Biologicals, Littleton, CO), α-Amylase (1: 5000) (Rockland, Gilbertsville, PA), serum Amyloid P (1: 1000) (Abcam Inc., Cambridge, MA), Annexin V (2:g/ml) (Abcam), neuron specific enolase (1:1000) (Biogenesis Inc., Kingston, NH); mouse monoclonal antibodies to β-Glucuronidase (1: 50) (Cell Sciences, Canton, MA), Regucalcin (1: 500) (Cellsciences), Annexin IV (1:1000) (BD Biosciences Pharmingen, San Diego, CA); sheep polyclonal anti-MDH (1:4000) (Rockland). Peroxidase-conjugated, affinity-purified donkey anti-rabbit, anti-mouse, or anti-sheep IgG (1:100,000) (Jackson ImmunoReseach) were used for 90 min at room temperature. The antibody-antigen reactions were visualized by using ECL plus western blotting detection system (Amersham Biosciences) and light-sensitive film (Kodak BioMax XAR). For quantification of band intensity, NIH Image software was used. To verifying the true bands of Fetuin-A, we loaded duplicate of serial dilution of bovine Fetuin-A (Sigma Aldrich, St. Louis, MO) as a positive control and urinary exosomal proteins from a cisplatin-treated rat at day 3 on one gel and then gel was transferred to PVDF membrane. The membrane was cut into two parts with same protein samples. One was probed with Fetuin-A antibody and another was probed with pre-adsorbed Fetuin-A antibody as a negative control with Fetuin-A agarose, immobilized on cross-linked 4% beads agarose (Sigma Aldrich) and then followed by the above procedure.
Immunoelectron microscopy of urinary Fetuin-A
A 200,000 × g pellet was obtained from 8 hr-urine samples of rats 2 days after cisplatin injection. The suspension was mixed 1:1 with 4% paraformaldehyde and then applied to 200-mesh nickel grids. After blocking with 1% BSA and washing, the grid was incubated with polyclonal rabbit anti-Fetuin-A (1:500) (Novus) containing 0.02% Triton X-100 (to permeabilize the vesicle membrane) and only antibody solution for 45 min at room temperature. Then the grids were exposed to goat anti-rabbit IgG (1:40) conjugated with 6 nm colloidal gold particles (12 nm) (1:40, Jackson ImmunoResearch) for 60 min at room temperature. After washing, membranes were negatively stained with 0.5% uranyl acetate. After drying, the grids were examined with a JEOL 1200 EX electron microscope operated at 60kV.
Immunohistochemical examination of Fetuin-A
The paraffin embedded kidney blocks were cut at 4 μm thickness, deparaffinized, and rehydrated. After consuming endogenous peroxidase with 3% H2O2, slides were pre-incubated with 10% normal donkey serum to block non-specific reactions and then incubated with polyclonal rabbit anti-Fetuin-A (1: 150) (Novus) overnight at 4°C. The slides were followed by incubation with biotin-conjugated donkey anti-rabbit IgG (1:1000) (Jackson ImmunoReseach) for 30 min at room temperature, and then reacted with streptavidin-conjugated peroxidase (Dako Corp., Carpinteria, CA) for 30 min at room temperature. The reaction products were visualized using a DAB kit (Vector Laboratories Inc., Burlingame, CA).
Statistical analysis
All data are expressed as mean ± SEM. Differences between groups were analyzed for statistical significance by t-test. A P-value <0.05 was accepted as statistically significant.
Supplementary Material
Acknowledgments
This research was supported by the Intramural Research Program of NIH, NIDDK, and NHLBI.
References
- 1.Thadhani R, Pascual M, Bonventre JV. Acute renal failure. N Engl J Med. 1996;334:1448–1460. doi: 10.1056/NEJM199605303342207. [DOI] [PubMed] [Google Scholar]
- 2.DuBose TD, Jr, Warnock DG, Mehta RL, et al. Acute renal failure in the 21st century: recommendations for management and outcomes assessment. Am J Kidney Dis. 1997;29:793–799. doi: 10.1016/s0272-6386(97)90136-0. [DOI] [PubMed] [Google Scholar]
- 3.Star RA. Treatment of acute renal failure. Kidney Int. 1998;54:1817–1831. doi: 10.1046/j.1523-1755.1998.00210.x. [DOI] [PubMed] [Google Scholar]
- 4.Star R. Design issues for clinical trials in acute renal failure. Blood Purif. 2001;19:233–237. doi: 10.1159/000046947. [DOI] [PubMed] [Google Scholar]
- 5.Zhou H, Hewitt S, Yuen PS, et al. Acute kidney injury biomarkers-needs, present status, and future promise. NephSAP. 2006;5:63–71. [PMC free article] [PubMed] [Google Scholar]
- 6.Zhou H, Yuen PS, Pisitkun T, et al. Collection, storage, preservation, and normalization of human urinary exosomes for biomarker discovery. Kidney Int. 2006;69:1471–1476. doi: 10.1038/sj.ki.5000273. [DOI] [PMC free article] [PubMed] [Google Scholar]
- 7.Pisitkun T, Shen RF, Knepper MA. Identification and proteomic profiling of exosomes in human urine. Proc Natl Acad Sci U S A. 2004;101:13368–13373. doi: 10.1073/pnas.0403453101. [DOI] [PMC free article] [PubMed] [Google Scholar]
- 8.Hoorn EJ, Pisitkun T, Zietse R, et al. Prospects for urinary proteomics: exosomes as a source of urinary biomarkers. Nephrology (Carlton) 2005;10:283–290. doi: 10.1111/j.1440-1797.2005.00387.x. [DOI] [PubMed] [Google Scholar]
- 9.Vaidya VS, Ramirez V, Ichimura T, et al. Urinary kidney injury molecule-1: a sensitive quantitative biomarker for early detection of kidney tubular injury. Am J Physiol Renal Physiol. 2006;290:F517–529. doi: 10.1152/ajprenal.00291.2005. [DOI] [PubMed] [Google Scholar]
- 10.Ichimura T, Hung CC, Yang SA, et al. Kidney injury molecule-1: a tissue and urinary biomarker for nephrotoxicant-induced renal injury. Am J Physiol Renal Physiol. 2004;286:F552–563. doi: 10.1152/ajprenal.00285.2002. [DOI] [PubMed] [Google Scholar]
- 11.Mori K, Lee HT, Rapoport D, et al. Endocytic delivery of lipocalin-siderophore-iron complex rescues the kidney from ischemia-reperfusion injury. J Clin Invest. 2005;115:610–621. doi: 10.1172/JCI23056. [DOI] [PMC free article] [PubMed] [Google Scholar]
- 12.Mishra J, Dent C, Tarabishi R, et al. Neutrophil gelatinase-associated lipocalin (NGAL) as a biomarker for acute renal injury after cardiac surgery. Lancet. 2005;365:1231–1238. doi: 10.1016/S0140-6736(05)74811-X. [DOI] [PubMed] [Google Scholar]
- 13.Mishra J, Mori K, Ma Q, et al. Neutrophil gelatinase-associated lipocalin: a novel early urinary biomarker for cisplatin nephrotoxicity. Am J Nephrol. 2004;24:307–315. doi: 10.1159/000078452. [DOI] [PubMed] [Google Scholar]
- 14.Mishra J, Ma Q, Prada A, et al. Identification of neutrophil gelatinase-associated lipocalin as a novel early urinary biomarker for ischemic renal injury. J Am Soc Nephrol. 2003;14:2534–2543. doi: 10.1097/01.asn.0000088027.54400.c6. [DOI] [PubMed] [Google Scholar]
- 15.Parikh CR, Jani A, Melnikov VY, et al. Urinary interleukin-18 is a marker of human acute tubular necrosis. Am J Kidney Dis. 2004;43:405–414. doi: 10.1053/j.ajkd.2003.10.040. [DOI] [PubMed] [Google Scholar]
- 16.Parikh CR, Abraham E, Ancukiewicz M, et al. Urine IL-18 is an early diagnostic marker for acute kidney injury and predicts mortality in the intensive care unit. J Am Soc Nephrol. 2005;16:3046–3052. doi: 10.1681/ASN.2005030236. [DOI] [PubMed] [Google Scholar]
- 17.du Cheyron D, Daubin C, Poggioli J, et al. Urinary measurement of Na+/H+ exchanger isoform 3 (NHE3) protein as new marker of tubule injury in critically ill patients with ARF. Am J Kidney Dis. 2003;42:497–506. doi: 10.1016/s0272-6386(03)00744-3. [DOI] [PubMed] [Google Scholar]
- 18.Herget-Rosenthal S, Poppen D, Husing J, et al. Prognostic value of tubular proteinuria and enzymuria in nonoliguric acute tubular necrosis. Clin Chem. 2004;50:552–558. doi: 10.1373/clinchem.2003.027763. [DOI] [PubMed] [Google Scholar]
- 19.Muramatsu Y, Tsujie M, Kohda Y, et al. Early detection of cysteine rich protein 61 (CYR61, CCN1) in urine following renal ischemic reperfusion injury. Kidney Int. 2002;62:1601–1610. doi: 10.1046/j.1523-1755.2002.00633.x. [DOI] [PubMed] [Google Scholar]
- 20.Dear JW, Kobayashi H, Jo SK, et al. Dendrimer-enhanced MRI as a diagnostic and prognostic biomarker of sepsis-induced acute renal failure in aged mice. Kidney Int. 2005;67:2159–2167. doi: 10.1111/j.1523-1755.2005.00321.x. [DOI] [PubMed] [Google Scholar]
- 21.Zhou H, Kato A, Miyaji T, et al. Urinary marker for oxidative stress in kidneys in cisplatin-induced acute renal failure in rats. Nephrol Dial Transplant. 2006;21:616–623. doi: 10.1093/ndt/gfi314. [DOI] [PubMed] [Google Scholar]
- 22.Molls RR, Savransky V, Liu M, et al. Keratinocyte-derived chemokine is an early biomarker of ischemic acute kidney injury. Am J Physiol Renal Physiol. 2006;290:F1187–1193. doi: 10.1152/ajprenal.00342.2005. [DOI] [PubMed] [Google Scholar]
- 23.Holly MK, Dear JW, Hu X, et al. Biomarker and drug target discovery using proteomics in a new rat model of sepsis-induced acute renal failure. Kidney Int. 2006 doi: 10.1038/sj.ki.5001575. [DOI] [PMC free article] [PubMed] [Google Scholar]
- 24.Thongboonkerd V, Malasit P. Renal and urinary proteomics: current applications and challenges. Proteomics. 2005;5:1033–1042. doi: 10.1002/pmic.200401012. [DOI] [PubMed] [Google Scholar]
- 25.Schaub S, Wilkins JA, Antonovici M, et al. Proteomic-based identification of cleaved urinary beta2-microglobulin as a potential marker for acute tubular injury in renal allografts. Am J Transplant. 2005;5:729–738. doi: 10.1111/j.1600-6143.2005.00766.x. [DOI] [PubMed] [Google Scholar]
- 26.Colantonio DA, Chan DW. The clinical application of proteomics. Clin Chim Acta. 2005;357:151–158. doi: 10.1016/j.cccn.2005.03.020. [DOI] [PubMed] [Google Scholar]
- 27.Thongboonkerd V, McLeish KR, Arthur JM, et al. Proteomic analysis of normal human urinary proteins isolated by acetone precipitation or ultracentrifugation. Kidney Int. 2002;62:1461–1469. doi: 10.1111/j.1523-1755.2002.kid565.x. [DOI] [PubMed] [Google Scholar]
- 28.Thongboonkerd V, Klein JB, Arthur JM. Proteomic identification of a large complement of rat urinary proteins. Nephron Exp Nephrol. 2003;95:e69–78. doi: 10.1159/000073674. [DOI] [PubMed] [Google Scholar]
- 29.Reynolds JL, Skepper JN, McNair R, et al. Multifunctional roles for serum protein fetuin-a in inhibition of human vascular smooth muscle cell calcification. J Am Soc Nephrol. 2005;16:2920–2930. doi: 10.1681/ASN.2004100895. [DOI] [PubMed] [Google Scholar]
- 30.Lafitte D, Dussol B, Andersen S, et al. Optimized preparation of urine samples for two-dimensional electrophoresis and initial application to patient samples. Clin Biochem. 2002;35:581–589. doi: 10.1016/s0009-9120(02)00362-4. [DOI] [PubMed] [Google Scholar]
- 31.Parikh CR, Mishra J, Thiessen-Philbrook H, et al. Urinary IL-18 is an early predictive biomarker of acute kidney injruy after cardiac surgery. Kidney Int. 2006 doi: 10.1038/sj.ki.5001527. Epub ahead of print. [DOI] [PubMed] [Google Scholar]
- 32.Ombrellino M, Wang H, Yang H, et al. Fetuin, a negative acute phase protein, attenuates TNF synthesis and the innate inflammatory response to carrageenan. Shock. 2001;15:181–185. doi: 10.1097/00024382-200115030-00004. [DOI] [PubMed] [Google Scholar]
- 33.Schafer C, Heiss A, Schwarz A, et al. The serum protein alpha 2-Heremans-Schmid glycoprotein/fetuin-A is a systemically acting inhibitor of ectopic calcification. J Clin Invest. 2003;112:357–366. doi: 10.1172/JCI17202. [DOI] [PMC free article] [PubMed] [Google Scholar]
- 34.Pecovnik-Balon B. Cardiovascular calcification in patients with end-stage renal disease. Ther Apher Dial. 2005;9:208–210. doi: 10.1111/j.1774-9987.2005.00255.x. [DOI] [PubMed] [Google Scholar]
- 35.Ketteler M, Bongartz P, Westenfeld R, et al. Association of low fetuin-A (AHSG) concentrations in serum with cardiovascular mortality in patients on dialysis: a cross-sectional study. Lancet. 2003;361:827–833. doi: 10.1016/S0140-6736(03)12710-9. [DOI] [PubMed] [Google Scholar]
- 36.Stefan N, Hennige AM, Staiger H, et al. Alpha2-Heremans-Schmid glycoprotein/fetuin-A is associated with insulin resistance and fat accumulation in the liver in humans. Diabetes Care. 2006;29:853–857. doi: 10.2337/diacare.29.04.06.dc05-1938. [DOI] [PubMed] [Google Scholar]
- 37.Mori K, Emoto M, Yokoyama H, et al. Association of serum fetuin-A with insulin resistance in type 2 diabetic and nondiabetic subjects. Diabetes Care. 2006;29:468. doi: 10.2337/diacare.29.02.06.dc05-1484. [DOI] [PubMed] [Google Scholar]
- 38.Terkelsen OB, Jahnen-Dechent W, Nielsen H, et al. Rat fetuin: distribution of protein and mRNA in embryonic and neonatal rat tissues. Anat Embryol (Berl) 1998;197:125–133. doi: 10.1007/s004290050124. [DOI] [PubMed] [Google Scholar]
- 39.Lieberthal W, Levine JS. Mechanisms of apoptosis and its potential role in renal tubular epithelial cell injury. Am J Physiol. 1996;271:F477–488. doi: 10.1152/ajprenal.1996.271.3.F477. [DOI] [PubMed] [Google Scholar]
- 40.Zhou H, Miyaji T, Kato A, et al. Attenuation of cisplatin-induced acute renal failure is associated with less apoptotic cell death. J Lab Clin Med. 1999;134:649–658. doi: 10.1016/s0022-2143(99)90106-3. [DOI] [PubMed] [Google Scholar]
- 41.Schumer M, Colombel MC, Sawczuk IS, et al. Morphologic, biochemical, and molecular evidence of apoptosis during the reperfusion phase after brief periods of renal ischemia. Am J Pathol. 1992;140:831–838. [PMC free article] [PubMed] [Google Scholar]
- 42.Hoffert JD, van Balkom BW, Chou CL, et al. Application of difference gel electrophoresis to the identification of inner medullary collecting duct proteins. Am J Physiol Renal Physiol. 2004;286:F170–179. doi: 10.1152/ajprenal.00223.2003. [DOI] [PubMed] [Google Scholar]
- 43.Hoffert JD, Pisitkun T, Wang G, et al. Quantitative phosphoproteomics of vasopressin-sensitive renal cells: regulation of aquaporin-2 phosphorylation at two sites. Proc Natl Acad Sci U S A. 2006;103:7159–7164. doi: 10.1073/pnas.0600895103. [DOI] [PMC free article] [PubMed] [Google Scholar]
Associated Data
This section collects any data citations, data availability statements, or supplementary materials included in this article.