Abstract
Prostaglandin F2α (PGF2α) increases reactive oxygen species (ROS) and induces vascular smooth muscle cell (VSMC) hypertrophy by largely unknown mechanism(s). To investigate the signaling events governing PGF2α –induced VSMC hypertrophy we examined the ability of the PGF2α analog, fluprostenol to elicit phosphorylation of Akt, the mammalian target of rapamycin (mTOR), ribosomal protein S6 kinase (p70S6k), glycogen synthase kinase-3β (GSK-3β), phosphatase and tensin homolog (PTEN), extracellular signal-regulated kinase 1/2 (ERK1/2) and Jun N-terminal kinase (JNK) in growth arrested A7r5 VSMC. Fluprostenol-induced hypertrophy was associated with increased ROS, mTOR translocation from the nucleus to the cytoplasm, along with Akt, mTOR, GSK-3β, PTEN and ERK1/2 but not JNK phosphorylation. Whereas inhibition of phosphatidylinositol 3-kinase (PI3K) by LY294002 blocked fluprostenol-induced changes in total protein content, pretreatment with rapamycin or with the ERK1/2-MAPK inhibitor UO126 did not. Taken together, these findings suggest that fluprostenol-induced changes in A7R5 hypertrophy involve mTOR translocation and occur through PI3K-dependent mechanisms.
Keywords: A7R5, VSMC, PGF-2α, hypertrophy, p70S6k, PTEN
1. INTRODUCTION
Prostaglandins (PGs) are arachidonic acid metabolites that are produced in a wide variety of tissues in response to mechanical and chemical stimuli (1). The actions of prostaglandin F2α (PGF2α) are thought to be mediated via the PGF2α receptor (FP), which is a member of the G protein-coupled receptor superfamily (2). In the myocardium and skeletal muscle the formation of PGs is induced by tissue stretch (3, 4) which can result in muscle hypertrophy (5, 6). PGF2α has recently been shown to induce the hypertrophy of neonatal rat ventricular myocytes, vascular smooth muscle cells (VSMC), and skeletal muscle myocytes in vitro (4, 7-10). Consistent with these data, chronic administration of the PGF2α receptor analog, fluprostenol increases cardiac growth (heart weight-and ventricular weight-to-body weight ratios) in vivo (8), while inhibition of PG production diminishes the hypertrophic response induced by hypertension (11) and blocks the growth of skeletal myofibers in vivo (12, 13).
Recent studies using vascular smooth muscle cells have suggested that PGF2α associated VSMC hypertrophy is mediated by NAD(P)H oxidase-derived reactive oxygen species (ROS) (14) while others have suggested that the extracellular regulated kinase 1/2 (ERK1/2) signaling pathway may be involved (15, 16). However, the involvement of other upstream or parallel pathways has not been fully elucidated. Interestingly, the hypertrophic hormone angiotensin II is also a major stimulus for NAD(P)H oxidase, (17) with the latter occurring through a signaling cascade involving the activation of phosphatidylinositol 3-kinase (PI3K), the mammalian target of rapamycin (mTOR) and its downstream effector the 70-kDa ribosomal protein S6 kinase (p70S6k) (18, 19). Recent data has also suggested that ROS are able to activate the extracellular regulated kinase 1/2 (ERK1/2) signaling pathway (20), glycogen synthase kinase-3β (GSK-3β) (21), a protein involved in the regulation of cell growth, and the phosphatase, phosphatase and tensin homolog (PTEN) which has been implicated in playing an important role in cardiac hypertrophy (22, 23). Whether these molecules are activated following PGF2α stimulation in VSMC or whether they may play a role in VSMC hypertrophy has not been fully described. We hypothesized that fluprostenol induces hypertrophy in the A7r5 cell line through the generation of ROS and activation of the mTOR and p70S6k signaling. The present findings indicate that fluprostenol-induced ROS-dependent VSMC cellular hypertrophy involves activation of ERK1/2, Akt, GSK-3β, mTOR, p70S6K, and PTEN. Taken together, these data suggest that fluprostenol-dependent VSMC cellular hypertrophy occurs in a fashion similar to that previously reported for angiotensin II and involves the participation of multiple signaling pathways.
2. MATERIAL AND METHODS
2.1 Reagents
Tissue culture reagents were from GIBCO (Carlsbad, Ca). Antibodies against p38 MAPK, JNK, and p44/42 MAPK (ERK1/2), mTOR, p70S6k, GSK-3 β (glycogen synthase kinase - 3β), Akt, PTEN (phosphatase and tensin homolog), mouse IgG and rabbit IgG antibodies were purchased from Cell Signaling Technology (Beverly, MA). Texas RED anti-rabbit mouse IgG was bought from Vector Labs (Burlingame, CA) while the hydroethidine stain came from Molecular Probes (Leiden, The Netherlands). The pharmacological inhibitors rapamycin, LY-294002, UO126, SB202474, and diphenylene iodonium (DPI), were obtained from Calbiochem (La Jolla, CA). Precast 10% and 7.5% SDS-PAGE gels were procured from Cambrex Biosciences (Baltimore, MD). Enhanced chemiluminescence (ECL) western blotting detection reagent was from Amersham Biosciences (Piscataway, NJ). Restore western blot stripping buffer was obtained from Pierce (Rockford, IL) and 3T3 cell lysates were from Santa Cruz Biotechnology (Santa Cruz, CA). Fetal bovine serum and all other chemicals were purchased from Sigma (St. Louis, MO).
2.2 Cell culture
The A7r5 cell line was chosen for investigation because this cell line has retained the phenotypic characteristics of primary smooth muscle cell lines while not expressing the Thromboxane A2 receptor or exhibiting phenotypic drift upon prolonged culture (10, 24). The A7r5 smooth-muscle cell line was derived from the Brown Norway embryonic rat aorta. A7r5 cells were obtained from American Type Culture Collection (Manassas, VA) and cultured in 100-mm dishes with Dulbecco’s modified Eagle’s medium (DMEM) supplemented with 10% fetal bovine serum (FBS), 100 U /ml penicillin, and 100 μg/ml streptomycin. After reaching 80-90% confluence, cells were made quiescent by incubation in serum-free DMEM for 48 h. In the evaluation of intracellular signaling studies, cells were stimulated with agonist (1 μM (+)-fluprostenol) or vehicle (ethanol) at 37°C in serum-free DMEM for 15 or 30 min. This concentration of fluprostenol is well above the Ki and is consistent with that used by other investigations (14, 25). For inhibition studies and protein accretion studies, A7r5 cells were seeded in 6-well plates (2.5× 10⁵ cells/well) in DMEM supplemented with 10% FBS and antibiotics. At 80-90% confluence, cells were starved for 48 h prior to treatment with vehicle (ethanol) or drug as indicated in the figure legends, and then incubated with 1 μM fluprostenol for 48 h.
2.3 Oxidative Fluorescent Microscopy
The oxidative fluorescent dye hydroethidine (HE) was used to evaluate the in situ production of superoxide in response to 1 μM fluprostenol stimulation. HE freely permeates the cells and in the presence of · is oxidized to ethidium (Et), where it is trapped by intercalating with the DNA (26). Because the cell membrane is impermeable to Et, extracellular · would not be expected to significantly contribute to the observed cellular fluorescence. Neither hydroxyl radical, ·NO, peroxynitrite, H2O2, hypochlorite, nor singlet O2 significantly oxidizes HE, as such, an increase in EtBr fluorescence is thought to specifically indicate · generation within the fluorescing cell. Briefly, after stimulation or incubation with vehicle, coverslips containing A7r5 cells were incubated for 30 min at 37 °C with 5 μM HE. After extensive washing with PBS and mounting (Vector hard set with DAPI) cells were visualized under fluorescence and analyzed using imaging software (Olympus MicroSuite™ Basic, Olympus America, Melville, NY).
2.4 Flow cytometry
A7r5 cells were seeded in 6-well plates (2.5× 10⁵ cells/well) and cultured for 24 h in DMEM supplemented with 10% FBS. Cells were made quiescent by incubation in serum-free DMEM for 48 hr prior to treatment with vehicle (ethanol) or 1 μM fluprostenol for 48 h. Changes in cell size were determined by flow cytometry using Becton Dickson FACScan and Lysis II software (Becton, Dickson and Company, Franklin Lakes, NJ).
2.5 Western blotting
At the end of each experiment cells were harvested by scraping, washed in ice cold PBS, and immediately frozen in liquid nitrogen. Cytosolic protein fractionation was performed as previously described (27). In brief, cells were lysed on ice for 15 min in T-PER (2 mL/1g tissue weight) (Pierce, Rockford, IL) supplemented with 100 mM NaF, 1 mM Na3VO4, 2 mM PMSF 1 μg/ml aprotinin, 1 μg/ml leupeptin, and 1 μg/ml pepsatin. After lysis, homogenates were centrifuged 10 min at 10,000 rpm and the supernatant collected. Protein concentrations of homogenates were determined in triplicate via the Bradford method (Pierce, Rockford, IL) using bovine serum albumin as a standard. Samples were diluted to a concentration of 3 mg/ml in SDS loading buffer, boiled for 5 min, and thirty micrograms of protein were separated by gel electrophoresis using 10% SDS-PAGE.
Transfer of protein onto nitrocellulose membranes was performed using standard conditions (28). To verify transfer of proteins and equal loading of lanes the membranes were stained with Ponceau S. For immunodetection, membranes were blocked with a solution of 5% nonfat dry milk prepared in Tris-buffered saline containing 0.5% Tween 20 (TBST) for 1 h at room temperature and then incubated overnight with the appropriate primary antibody. After washing in TBST, the membranes were exposed to horseradish peroxidase-labeled (HRP) IgG secondary antibody for 1 h at room temperature. Protein bands were visualized using ECL reagent (Amersham Biosciences), with the exposure time adjusted to keep the integrated optical densities within a linear and nonsaturated range. Band signal intensity was quantified by densitometry using a flatbed scanner (Epson Pefection 3200 PHOTO) and Imaging software (AlphaEaseFC). Molecular mass markers (Cell Signaling) and NIH 3T3 cell lysates were included as positive controls. Immunoblots were stripped and reprobed with Restore western blot stripping buffer, as detailed by the manufacturer was used to allow direct comparisons to be made between the concentration levels of different signaling molecules. After verifying the absence of residual HRP activity on the membrane by exposure to ECL reagent, membranes were washed and reprobed.
2.6 Immunofluorescence staining
mTOR phosphorylation with 1 μM fluprostenol stimulation was visualized by immunofluorescence as outlined by the antibody manufacturer. Briefly, cells were seeded on glass coverslips (50,000 cells/cm2) and grown in DMEM supplemented with 10% FBS. After serum withdrawal for 48 h to induce quiescence, cells were stimulated with 1 μM fluprostenol for 15 min. Cells were fixed by the addition of ice-cold acetone for 1 min and then washed three times with PBS containing 0.5% Tween 20 (PBS-T), pH 7.5. Following 30 min incubation in blocking solution (5% nonfat dry milk in PBS) cells were stained with specific antisera diluted in PBS-T (anti-mTOR 1:75) for 1 h at 37°C in a humidified chamber. Excess antibody was removed by washing three times in PBS, prior to incubating the cells with Texas RED anti-rabbit mouse IgG for 30 min at 37°C in a humidified chamber. DAPI was also included in the secondary antibody solution at a concentration of 1.5 μg /ml in order to visualize cell nuclei. After a final PBS wash, coverslips were mounted and visualized by epifluorescence using an Olympus fluorescence microscope (Melville, NY) fitted with a 40X objective. Images were recorded digitally using a CCD camera and analyzed using Olympus MicroSuite™ Basic from Olympus America (Melville, NY).
2.7 Data Analysis
Results are presented as mean ± SEM. Data were analyzed by using the SigmaStat 3.0. Multiple group comparisons were performed by one-way analysis of variance (ANOVA) with the Student-Newman-Keuls post hoc test used to determine differences between groups. The level of significance accepted a priori was ≤ 0.05.
3. RESULTS
3.1 The PGF2α agonist (+)-fluprostenol increases · and A7R5 cell size
Prostaglandin F2α has been previously shown to elicit cell hypertrophy in rat aortic smooth muscle cells and in the A7r5 smooth muscle cell line (10, 14). PGF2α primarily mediates its cellular effects by binding with high affinity (Ki = 3.4 nM) to the FP prostanoid receptor (29). To investigate the signaling evoked by FP receptor activation we stimulated A7r5 cells with the PGF2α receptor agonist fluprostenol. Fluprostenol was chosen as an agonist because it has a similar affinity for the fluprostenol receptor as PGF2α (Ki = 3.8 nM) but does not bind to other prostanoid receptors (29). Because recent data has suggested that PGF2α induces hypertrophy via increased ROS generation, the production of ROS was investigated following fluprostenol treatment. To accomplish this task, fluorescence microscopy of cells seeded onto cover slips and treated with 1 μM fluprostenol were examined for increase in Et fluorescence following staining with the oxidative fluorescent dye HE. An increase in Et fluorescence, reflecting an increase in · was observed in A7r5 cells following 15 or 30 min of fluprostenol treatment (Fig. 1A and B). To assess whether fluprostenol stimulation resulted in A7R5 cell hypertrophy, cells stimulated with fluprostenol were examined for alterations in cell size using flow cytometry. As shown in Fig. 1, as measured using forward angle light scatter, fluprostenol treatment increased cell size ~54% by 48 h incubation. To examine whether ROS are involved in the hypertrophic response, quiescent cells were treated with 1 μM fluprostenol in the presence or absence of 100 nm of the ROS inhibitor DPI for 48 h. DPI inhibits the generation of ROS by inhibiting both NADPH-Ubiquinone Oxidoreductase and Nitric Oxide Synthase. Experimentally, DPI in the presence of fluprostenol inhibited cell hypertrophy (data not shown). Taken together, these data strongly suggest that fluprostenol induces hypertrophy in the A7r5 cell line in a ROS-dependent fashion.
Fig. 1. Fluprostenol stimulation increases reactive oxygen species and induces A7R5 hypertrophy.
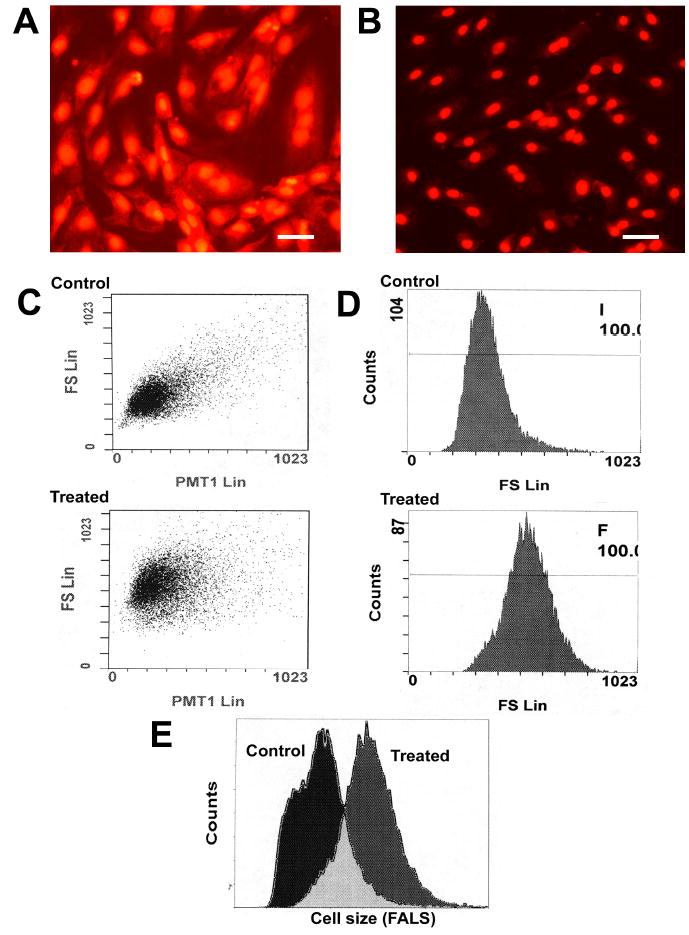
Hydroethidium (HE) staining of control (A) and fluprostenol-stimulated A7r5 cells (B). Fluprostenol mediated A7R5 hypertrophy. Changes in cells were determined using forward angled light scatter flow cytometry: C) Scatter diagrams represent the control and Fluprostenol treated (48 hr) cells respectively. D) Frequency histograms of cell size and cell count. E) Overlay of frequency histograms shown in (D). Fluprostenol (1 μM) stimulation increased cell size ~54% versus control (vehicle).
3.2 Fluprostenol treatment causes activation of the mTOR → p70S6k and ERK 1/2-MAPK pathways
To understand the signal transduction pathways of fluprostenol-induced increases in cell size, we examined the effect of fluprostenol stimulation (1 μM) on the phosphorylation status of the Akt, mTOR, p70S6k, GSK-3β, PTEN, ERK1/2, and JNK proteins using protein gel electrophoresis and immunoblotting. The mTOR cytosolic content increased ~39% and ~66% (p < 0.05) in the 15- and 30-min fluprostenol stimulated cells, respectively (Fig. 2). Conversely, fluprostenol stimulation did not alter the cytosolic content of Akt, p70S6k, or GSK-3β levels (Fig. 2). The amount of the mTOR-dependent form of phosphorylated p70S6k (Thr 389) following fluprostenol stimulation was unchanged at 15 min but showed an increase of ~39% at 30 min (p < 0.05) (Fig. 3). With fluprostenol stimulation, the ERK 1/2 MAPK-dependent phosphorylated form of p70S6k (Thr 421/Ser 424) increased ~58.6% in the 30 min stimulated A7r5 cells (p < 0.05), but showed no significant change at 15 min (Fig. 3). mTOR phosphorylation via fluprostenol stimulation increased ~29.1% and ~73.1% after 15 and 30 min (p < 0.05) (Fig. 3) while the degree of Ser 473 phosphorylation of the upstream mTOR regulator Akt increased ~11.9% and ~53.6% for the 15 and 30 min time points, respectively (p < 0.05) (Fig. 3). Fluprostenol stimulation increased GSK-3β (Ser 9) phosphorylation at the 15 min time point by ~115.5% before decreasing to ~60.8% over control after 30 min (p < 0.05) (Fig. 3). Stimulation of cells with fluprostenol did not alter PTEN cytosolic levels (data not shown). Phosphorylation of PTEN on the Ser 380/ Thr 382/383 was increased ~58.5% and ~75.0% (p < 0.05) in the 15 and 30 min fluprostenol stimulated cells (Fig. 4). Fluprostenol stimulation did not alter the cytosolic content of ERK 1/2 or JNK (data not shown). The amount of ERK 1/2-MAPK phosphorylation did not change following 15 min of stimulation, however at 30-min stimulation, the amount of ERK 1/2-MAPK phosphorylation increased 20.9% (p<0.05) (Fig. 4). JNK-MAPK phosphorylation was not altered after 15 or 30 min of fluprostenol stimulation (Fig. 4).
Fig. 2. Fluprostenol stimulation induces increases in mTOR cytosolic content.
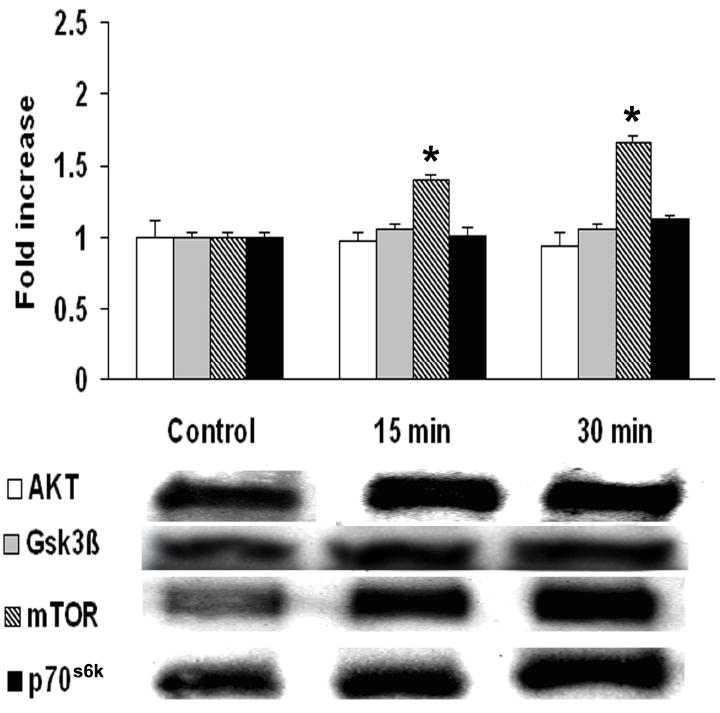
A7r5 rat aortic vascular smooth muscle cells content of: Akt, GSK-3β, mTOR and p70S6k in cytosolic extract from control, 15 min, and 30 min fluprostenol-stimulated A7r5 cells. Relative changes in protein levels were determined by immunoblotting. The data are presented as fold increase of control value. Values are means ± S.E. from four independent experiments. An asterisk (*) indicates significant difference from the control value (p < 0.05).
Fig. 3. Time course of fluprostenol-induced phosphorylation of Akt, GSK-3β, mTOR, and p70S6k following 15 or 30 min of stimulation.
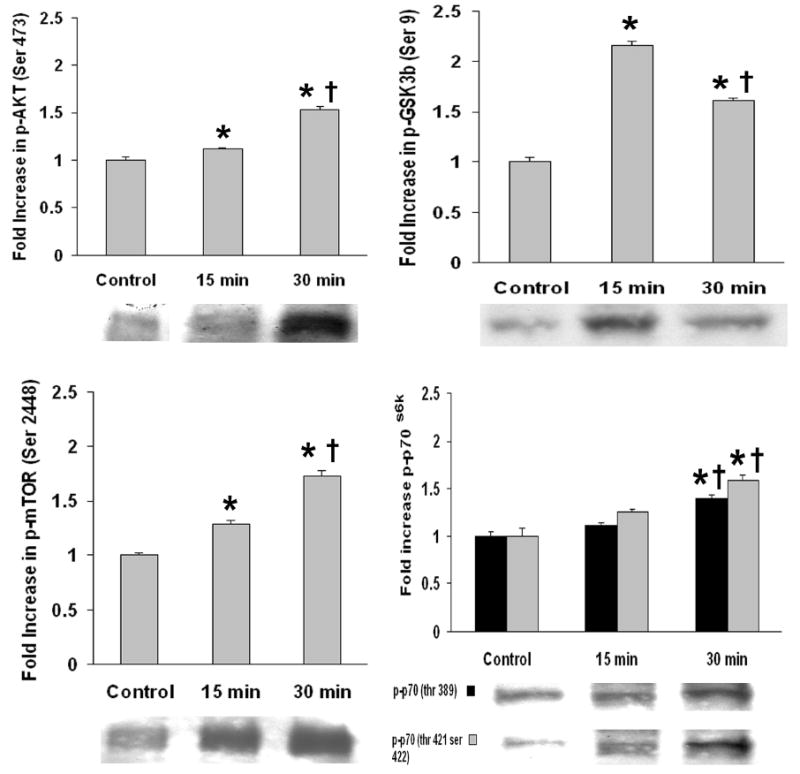
Results were obtained by immunoblotting through immunodetection of phosphorylated specific antibody. Phosphorylation status was calculated as phospho-specific optical density divided by the control value. Values are means ± S.E. from four independent experiments. An asterisk (*) indicates significant difference from the control value and the cross (†) indicates significant difference between 15 min and 30 min values (p < 0.05).
Fig. 4. Fluprostenol stimulation induces phosphorylation of PTEN and ERK1/2-MAPK but not JNK-MAPK.
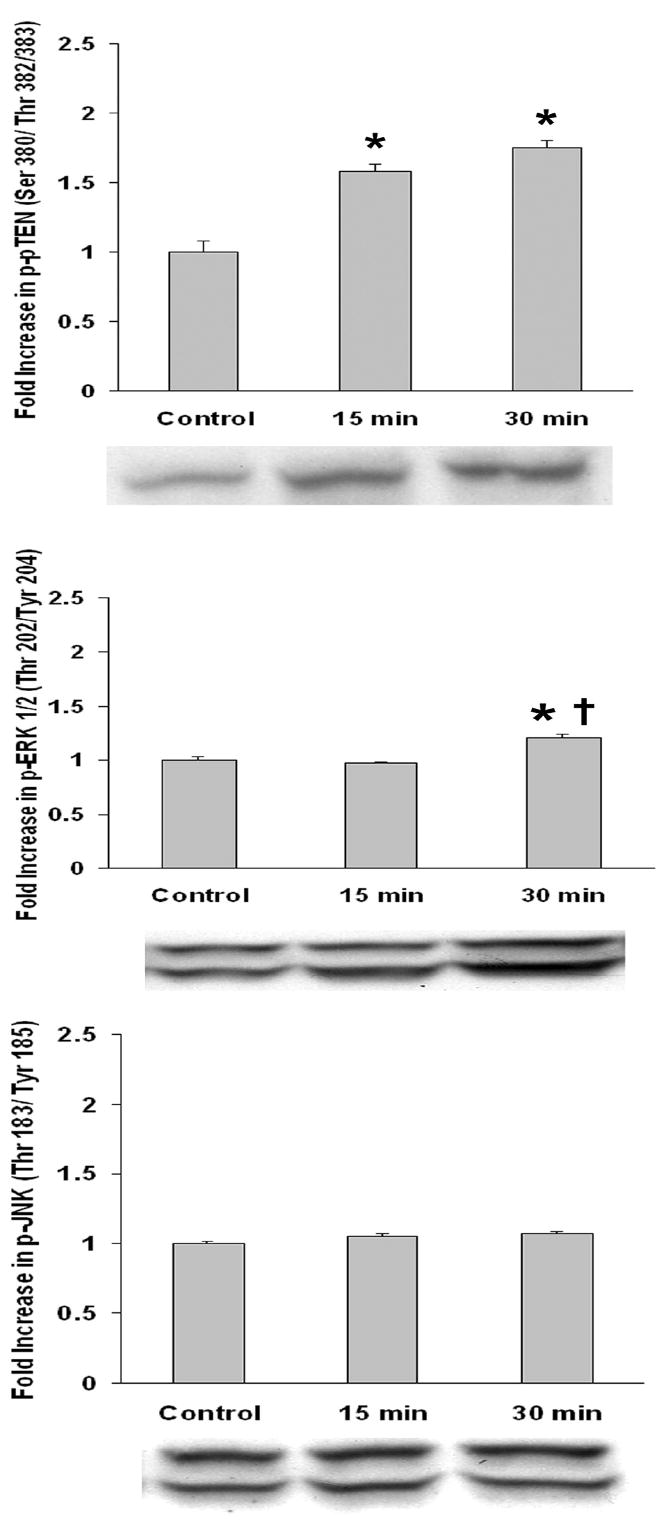
Results were obtained by immunoblotting through immunodetection of phosphorylated specific antibody. Phosphorylation status was calculated as phospho-specific optical density divided by the control value. Values are means ± S.E. from four independent experiments. An asterisk (*) indicates significant difference from the control value and the cross (†) indicates significant difference between 15 min and 30 min values (p < 0.05).
3.3 Immunohistochemistry
The mTOR has been reported to be differentially distributed between the nucleus and cytoplasm. Because our immunoblotting data suggested differences in the amount of cytosolic mTOR with fluprostenol stimulation, we examined the subcellular localization of this molecule by indirect immunofluorescence. In resting cells most of the p-mTOR appeared to reside within the nucleus with concentrated staining adjacent to the nuclear membrane (Fig. 5 A). Treatment of cells with fluprostenol for 15 min produced a striking redistribution of p-mTOR with the amount of nuclear associated p-mTOR immunoreactivity decreasing (Fig. 5 B). These data suggest fluprostenol stimulation induces a translocation of p-mTOR from the nucleus to the cytoplasm.
Fig. 5. Fluprostenol stimulation induces translocation of mTOR.
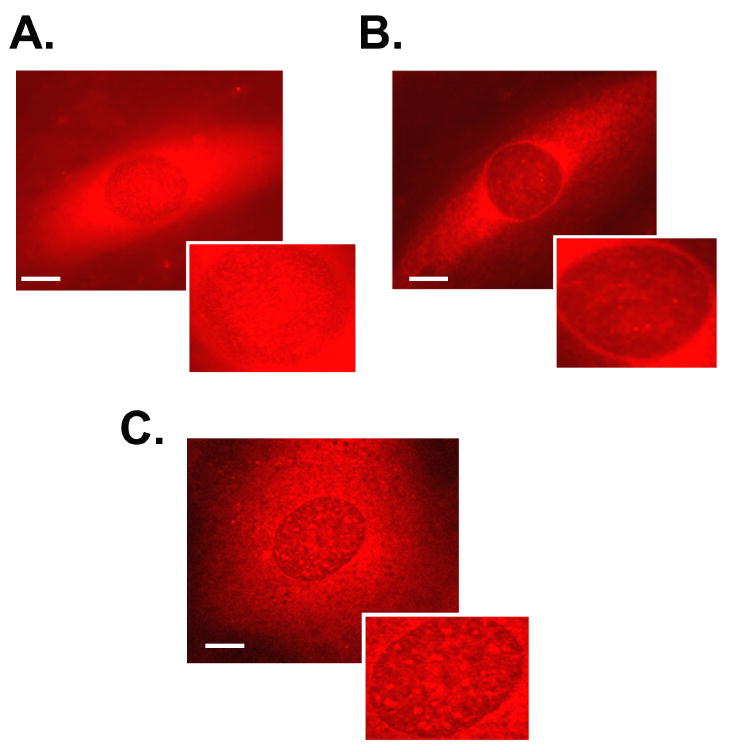
Cells were treated with vehicle or fluprostenol (1 μM) and the immunohistochemical localization of phosphorylated mTOR (Ser 2448) determined in control (A) and stimulated (B) cells. Intracellular visualization of phosphorylated mTOR following 30 min of pre-treatment with rapamycin followed by fluprostenol stimulation (C).
3.4 Inhibition of PI3-K → Akt → mTOR → p70S6k pathway molecules attenuates fluprostenol-induced increases in protein accretion
Fluprostenol incubation for 48 hr increased the total protein content present in A7R5 cells ~114% (p<0.05) (Fig. 6). To assess the role of mTOR in fluprostenol stimulated increases in A7r5 protein accretion, equal numbers of cells were pretreated for 30 min with rapamycin, a specific inhibitor of mTOR, before addition of fluprostenol to the culture media. Following 48 h of fluprostenol stimulation, cells were trypsinized, and counted in triplicate, and equal numbers of cells were lysed and the total protein content quantified by the Bradford assay. As expected, rapamycin in the presence of fluprostenol attenuated protein accretion (p<0.05) (Fig. 6). To investigate the mechanism of how rapamycin may diminish protein accretion, we examined the distribution of p-mTOR using immunohistochemistry following rapamycin incubation. Following rapamycin pretreatment, fluprostenol-induced translocation of p-mTOR was diminished significantly (Fig. 5 C). To examine whether PI3K or ERK 1/2-MAPK played a similar role in regulating protein accretion following fluprostenol stimulation, inhibition experiments using the PI3K inhibitor LY-294002, or the MAPK inhibitor U0126 were performed at concentrations reported to be nontoxic to VSMC over 48 h (30). Pretreatment with LY-294002 (10 μm) completely abolished fluprostenol-induced increases in protein content (p<0.05) (Fig. 6). Conversely, pre-treatment with the ERK1/2-MAPK inhibitor UO126 or its structural analog SB202474 did not affect the protein content as reported after fluprostenol stimulation (Fig. 6). Taken together, these data support a model where increases in fluprostenol-induced protein accretion proceeds through activation of the PI3K pathway.
Fig. 6. Fluprostenol-induced hypertrophy of A7R5 cells is dependent upon PI3K but not mTOR or ERK1/2-MAPK.
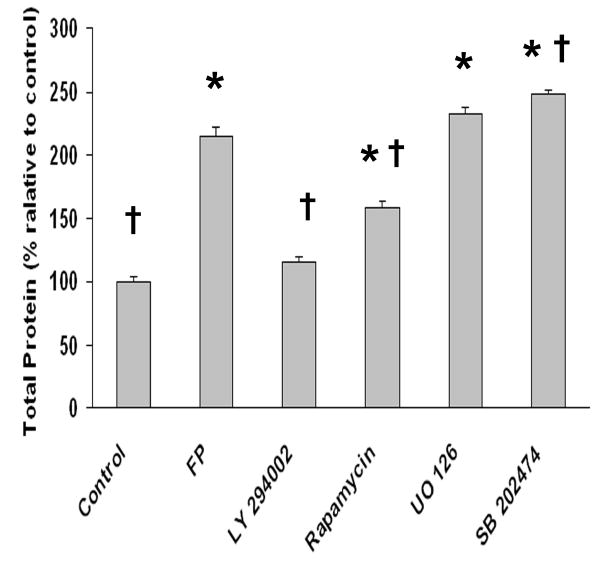
Cells were grown in 250 mm2 cell culture dishes and treated with fluprostenol (1 μM) or specific inhibitors (25 μM LY294002, 50 ng/ml rapamycin, 10 μM UO126 or 10 μM SB202474) before exposure to fluprostenol (1 μM) for 48 hours. The Bradford assay was performed on cellular lysates from equal numbers of cells to determine fluprostenol-induced changes in A7R5 protein levels. Values are means ± S.E. from six independent experiments. (n=6). An asterisk (*) indicates significant difference from the control value and the cross (†) indicates significant difference from fluprostenol (FP) stimulation (p < 0.05).
4. DISCUSSION
The selective PGF receptor agonist (+)-fluprostenol is thought to induce VSMC hypertrophy through an increase in the amount of NAD(P)H oxidase-dependent ROS-generation (14). The signaling pathways activated subsequent to increases in cellular ROS are unclear. Consistent with previous reports our data suggest that PGF2α-induced VSMC hypertrophy is associated with the activation of ERK1/2-MAPK (15, 16). In addition, we show that fluprostenol can activate Akt, GSK-3β, mTOR, p70S6K, and PTEN in the A7r5 vascular smooth muscle cell line. To our knowledge these findings have not been reported before. The p70S6k was phosphorylated on mTOR-and ERK 1/2-dependent residues within 30 min of fluprostenol treatment, whereas mTOR, Akt, and GSK-3β were activated within 15 min. These changes preceded cell enlargement. Inhibition of PI3K blocked protein accretion while mTOR inhibition attenuated fluprostenol-induced increases in this parameter. These data are consistent with previous examining PGF2α-induced alterations in protein synthesis using cardiac myocytes (9) and support the notion that the PI3K-dependent and mTOR dependent processes play an important role in cell size increases induced by fluprostenol. Once activated, mTOR phosphorylates p70S6K, a mitogen-and amino acid sensitive kinase which is involved in regulating the translation of elongation factor and ribosomal mRNAs (31). In skeletal, cardiac and smooth muscle, p70S6K phosphorylation has been shown to be induced by a variety of hypertrophic agonists such as angiotensin II, α- or β-adrenergic receptor agonists and increased mechanical load (32-35). Our data imply that fluprostenol may also be included in this list. Furthermore, they substantiate earlier findings demonstrating that ROS is capable of activating p70S6K (36, 37).
The increases in the cytoplasmic mTOR content subsequent to fluprostenol stimulation are intriguing. Since previous studies have indicated that mitogenic stimulation is capable of eliciting the translocation of mTOR from the nucleus to the cytoplasm (38), we examined mTOR distribution by immunohistochemistry. Our data suggest that fluprostenol induces mTOR translocation from the nucleus to the cytoplasm (Fig. 5, Panels A, B). To our knowledge, the mechanisms involved in this shuttling are not known and this process has never been described, or reported, in a vascular smooth muscle cell line. No conventional nuclear import signal or nuclear export signal has been found in the mTOR sequence, but it is possible that mTOR carries unconventional translocation signals (39). As mTOR is a member of the ATM-related kinase family, this is not unexpected since ATM has been shown to be a bona fide nuclear protein without a clearly identifiable nuclear localization sequence. Alternatively, mTOR could translocate by means of associating with another nuclear shuttling protein.
The effects of fluprostenol stimulation on molecules thought to act as inhibitors of cell growth were also examined. GSK-3β is thought to negatively regulate striated muscle hypertrophy (23, 40, 41). Several studies have suggested that hypertrophic stimuli inhibit the activity of GSK-3β protein by inducing its phosphorylation (23, 40-42). We found that fluprostenol stimulation significantly increased GSK-3β (Ser 9) phosphorylation. The mechanism by which GSK-3β influences muscle growth is not clear but this signaling protein has been implicated in the regulation of calcineurin substrate NFAT and that of the protein translation initiation factor e1F2B (43-45). Recently NFAT has been suggested as a regulator of VSMC growth and motility, both of which are factors known to be intimately involved in the pathogenesis of restenosis (46). Although not examined here, our findings that fluprostenol may inhibit GSK-3β activity are intriguing because they suggest fluprostenol may have the capacity to modulate vascular remodeling by exerting influence through pathways involved not only in the regulation of cell growth but also cell motility.
While the importance of protein kinases in cell biology is well established, much less is known about the counter-regulatory protein phosphatases. PTEN is believed to participate in the control of cell cycle arrest and may also reduce cell migration through dephosphorylation of focal adhesion kinase (47). PTEN also functions to counteract the activity of PI3K by dephosphorylation of the D3 position of membrane PtdIns 3,4,5-triphosphate and PtdIns 3,4-bi-phosphate (48). With fluprostenol stimulation, the phosphorylation of PTEN increased dramatically (Fig. 7). Our findings support an earlier suggestion that PTEN is regulated by ROS (49). As PTEN phosphorylation on Ser380/Thr 382/383 is thought to inhibit its phosphatase activity (50), our findings suggest that fluprostenol may act to limit the inhibitory influence of PTEN on PI3K signaling and its downstream effector Akt.
In conclusion, our data, when viewed in concert with previous research, are consistent with the notion that both fluprostenol and angiotensin II use similar intracellular signaling pathways to exert their hypertrophic effects. Specifically, both agonists increase ROS and induce phosphorylation of mTOR, and p70S6k. Our results suggest that fluprostenol is also capable of inducing the phosphorylation of GSK-3β and PTEN, indicating that perhaps, this agent is able to make use of multiple pathways to cause increases in vascular smooth muscle cell growth.
Acknowledgments
This study was supported by National Institute on Aging (NIA) Grant AG-20370 to E. R.B., National Institute of Health (NIH) Grant RR16477 to R. H. and by NSF EPSCOR to Marshall University.
Footnotes
Publisher's Disclaimer: This is a PDF file of an unedited manuscript that has been accepted for publication. As a service to our customers we are providing this early version of the manuscript. The manuscript will undergo copyediting, typesetting, and review of the resulting proof before it is published in its final citable form. Please note that during the production process errors may be discovered which could affect the content, and all legal disclaimers that apply to the journal pertain.
References
- 1.Funk CD. Prostaglandins and leukotrienes: advances in eicosanoid biology. Science. 2001;294(5548):1871–5. doi: 10.1126/science.294.5548.1871. [DOI] [PubMed] [Google Scholar]
- 2.Abramovitz M, Boie Y, Nguyen T, Rushmore TH, Bayne MA, Metters KM, et al. Cloning and expression of a cDNA for the human prostanoid FP receptor. J Biol Chem. 1994;269(4):2632–6. [PubMed] [Google Scholar]
- 3.Chazov EI, Pomoinetsky VD, Geling NG, Orlova TR, Nekrasova AA, Smirnov VN. Heart adaptation to acute pressure overload: an involvement of endogenous prostaglandins. Circ Res. 1979;45(2):205–11. doi: 10.1161/01.res.45.2.205. [DOI] [PubMed] [Google Scholar]
- 4.Vandenburgh HH, Hatfaludy S, Sohar I, Shansky J. Stretch-induced prostaglandins and protein turnover in cultured skeletal muscle. Am J Physiol. 1990;259(2 Pt 1):C232–40. doi: 10.1152/ajpcell.1990.259.2.C232. [DOI] [PubMed] [Google Scholar]
- 5.Karmazyn M. Synthesis and relevance of cardiac eicosanoids with particular emphasis on ischemia and reperfusion. Can J Physiol Pharmacol. 1989;67(8):912–21. doi: 10.1139/y89-144. [DOI] [PubMed] [Google Scholar]
- 6.Mentz P, Pawelski KE, Giessler C, Mest HJ, Mannes F, Rotzoll S. Myocardial biosynthesis of prostacyclin and the influence of cardiac loading and drugs. Biomed Biochim Acta. 1988;47(1011):S244–7. [PubMed] [Google Scholar]
- 7.Adams JW, Migita DS, Yu MK, Young R, Hellickson MS, Castro-Vargas FE, et al. Prostaglandin F2 alpha stimulates hypertrophic growth of cultured neonatal rat ventricular myocytes. J Biol Chem. 1996;271(2):1179–86. doi: 10.1074/jbc.271.2.1179. [DOI] [PubMed] [Google Scholar]
- 8.Lai J, Jin H, Yang R, Winer J, Li W, Yen R, et al. Prostaglandin F2 alpha induces cardiac myocyte hypertrophy in vitro and cardiac growth in vivo. Am J Physiol. 1996271(6 Pt 2):H2197–208. doi: 10.1152/ajpheart.1996.271.6.H2197. [DOI] [PubMed] [Google Scholar]
- 9.Kunapuli P, Lawson JA, Rokach JA, Meinkoth JL, FitzGerald GA. Prostaglandin F2alpha (PGF2alpha) and the isoprostane, 8, 12-iso-isoprostane F2alpha-III, induce cardiomyocyte hypertrophy. Differential activation of downstream signaling pathways. J Biol Chem. 1998;273(35):22442–52. doi: 10.1074/jbc.273.35.22442. [DOI] [PubMed] [Google Scholar]
- 10.Dorn GW, 2nd, Becker MW, Davis MG. Dissociation of the contractile and hypertrophic effects of vasoconstrictor prostanoids in vascular smooth muscle. J Biol Chem. 1992;267(34):24897–905. [PubMed] [Google Scholar]
- 11.Kentera D, Susic D, Zdravkovic M. Effects of verapamil and aspirin on experimental chronic hypoxic pulmonary hypertension and right ventricular hypertrophy in rats. Respiration. 1979;37(4):192–6. doi: 10.1159/000194026. [DOI] [PubMed] [Google Scholar]
- 12.McLennan IS. Hormonal regulation of myoblast proliferation and myotube production in vivo: influence of prostaglandins. J Exp Zool. 1987;241(2):237–45. doi: 10.1002/jez.1402410210. [DOI] [PubMed] [Google Scholar]
- 13.Templeton GH, Padalino M, Moss R. Influences of inactivity and indomethacin on soleus phosphatidylethanolamine and size. Prostaglandins. 1986;31(3):545–59. doi: 10.1016/0090-6980(86)90116-4. [DOI] [PubMed] [Google Scholar]
- 14.Katsuyama M, Fan C, Yabe-Nishimura C. NADPH oxidase is involved in prostaglandin F2alpha-induced hypertrophy of vascular smooth muscle cells: induction of NOX1 by PGF2alpha. J Biol Chem. 2002;277(16):13438–42. doi: 10.1074/jbc.M111634200. [DOI] [PubMed] [Google Scholar]
- 15.Fukuyama K, Ichiki T, Ono H, Tokunou T, Iino N, Masuda S, et al. cAMP-response element-binding protein mediates prostaglandin F2alpha-induced hypertrophy of vascular smooth muscle cells. Biochem Biophys Res Commun. 2005;338(2):910–8. doi: 10.1016/j.bbrc.2005.10.019. [DOI] [PubMed] [Google Scholar]
- 16.Rao GN, Madamanchi NR, Lele M, Gadiparthi L, Gingras AC, Eling TE, et al. A potential role for extracellular signal-regulated kinases in prostaglandin F2alpha-induced protein synthesis in smooth muscle cells. J Biol Chem. 1999;274(18):12925–32. doi: 10.1074/jbc.274.18.12925. [DOI] [PubMed] [Google Scholar]
- 17.Lassegue B, Sorescu D, Szocs K, Yin Q, Akers M, Zhang Y, et al. Novel gp91(phox) homologues in vascular smooth muscle cells: nox1 mediates angiotensin II-induced superoxide formation and redox-sensitive signaling pathways. Circ Res. 2001;88(9):888–94. doi: 10.1161/hh0901.090299. [DOI] [PubMed] [Google Scholar]
- 18.Haider UG, Sorescu D, Griendling KK, Vollmar AM, Dirsch VM. Resveratrol suppresses angiotensin II-induced Akt/protein kinase B and p70 S6 kinase phosphorylation and subsequent hypertrophy in rat aortic smooth muscle cells. Mol Pharmacol. 2002;62(4):772–7. doi: 10.1124/mol.62.4.772. [DOI] [PubMed] [Google Scholar]
- 19.Takahashi T, Taniguchi T, Konishi H, Kikkawa U, Ishikawa Y, Yokoyama M. Activation of Akt/protein kinase B after stimulation with angiotensin II in vascular smooth muscle cells. Am J Physiol. 1999;276(6 Pt 2):H1927–34. doi: 10.1152/ajpheart.1999.276.6.H1927. [DOI] [PubMed] [Google Scholar]
- 20.Blanc A, Pandey NR, Srivastava AK. Synchronous activation of ERK 1/2, p38mapk and PKB/Akt signaling by H2O2 in vascular smooth muscle cells: potential involvement in vascular disease (review) Int J Mol Med. 2003;11(2):229–34. [PubMed] [Google Scholar]
- 21.El Jamali A, Freund C, Rechner C, Scheidereit C, Dietz R, Bergmann MW. Reoxygenation after severe hypoxia induces cardiomyocyte hypertrophy in vitro: activation of CREB downstream of GSK3beta. Faseb J. 2004;18(10):1096–8. doi: 10.1096/fj.03-1054fje. [DOI] [PubMed] [Google Scholar]
- 22.Oudit GY, Sun H, Kerfant BG, Crackower MA, Penninger JM, Backx PH. The role of phosphoinositide-3 kinase and PTEN in cardiovascular physiology and disease. J Mol Cell Cardiol. 2004;37(2):449–71. doi: 10.1016/j.yjmcc.2004.05.015. [DOI] [PubMed] [Google Scholar]
- 23.Hardt SE, Sadoshima J. Glycogen synthase kinase-3beta: a novel regulator of cardiac hypertrophy and development. Circ Res. 2002;90(10):1055–63. doi: 10.1161/01.res.0000018952.70505.f1. [DOI] [PubMed] [Google Scholar]
- 24.Morinelli TA, Finley EL, Jaffa AA, Kurtz DT, Ullian ME. Tyrosine phosphorylation of phosphatidylinositol 3-kinase and of the thromboxane A2 (TXA2) receptor by the TXA2 mimetic I-BOP in A7r5 cells. Biochem Pharmacol. 1997;53(12):1823–32. doi: 10.1016/s0006-2952(97)00005-1. [DOI] [PubMed] [Google Scholar]
- 25.Kelly CR, Williams GW, Sharif NA. Real-time intracellular Ca2+ mobilization by travoprost acid, bimatoprost, unoprostone, and other analogs via endogenous mouse, rat, and cloned human FP prostaglandin receptors. J Pharmacol Exp Ther. 2003;304(1):238–45. doi: 10.1124/jpet.102.042556. [DOI] [PubMed] [Google Scholar]
- 26.Rothe G, Valet G. Flow cytometric analysis of respiratory burst activity in phagocytes with hydroethidine and 2’, 7’-dichlorofluorescin. J Leukoc Biol. 1990;47(5):440–8. [PubMed] [Google Scholar]
- 27.Rice KM, Desai DH, Kinnard RS, Harris R, Wright GL, Blough ER. Load-induced focal adhesion mechanotransduction is altered with aging in the Fischer 344/NNiaHSd x Brown Norway/BiNia rat aorta. Biogerontology. 2006 doi: 10.1007/s10522-006-9066-2. [DOI] [PubMed] [Google Scholar]
- 28.Towbin H, Staehelin T, Gordon J. Electrophoretic transfer of proteins from polyacrylamide gels to nitrocellulose sheets: procedure and some applications. Proc Natl Acad Sci U S A. 1979;76(9):4350–4. doi: 10.1073/pnas.76.9.4350. [DOI] [PMC free article] [PubMed] [Google Scholar]
- 29.Breyer RM, Bagdassarian CK, Myers SA, Breyer MD. Prostanoid receptors: subtypes and signaling. Annu Rev Pharmacol Toxicol. 2001;41:661–90. doi: 10.1146/annurev.pharmtox.41.1.661. [DOI] [PubMed] [Google Scholar]
- 30.Saward L, Zahradka P. Angiotensin II activates phosphatidylinositol 3-kinase in vascular smooth muscle cells. Circ Res. 1997;81(2):249–57. doi: 10.1161/01.res.81.2.249. [DOI] [PubMed] [Google Scholar]
- 31.Jefferies HB, Fumagalli S, Dennis PB, Reinhard C, Pearson RB, Thomas G. Rapamycin suppresses 5’TOP mRNA translation through inhibition of p70s6k. Embo J. 1997;16(12):3693–704. doi: 10.1093/emboj/16.12.3693. [DOI] [PMC free article] [PubMed] [Google Scholar]
- 32.Bodine SC, Stitt TN, Gonzalez M, Kline WO, Stover GL, Bauerlein R, et al. Akt/mTOR pathway is a crucial regulator of skeletal muscle hypertrophy and can prevent muscle atrophy in vivo. Nat Cell Biol. 2001;3(11):1014–9. doi: 10.1038/ncb1101-1014. [DOI] [PubMed] [Google Scholar]
- 33.Giasson E, Meloche S. Role of p70 S6 protein kinase in angiotensin II-induced protein synthesis in vascular smooth muscle cells. J Biol Chem. 1995;270(10):5225–31. doi: 10.1074/jbc.270.10.5225. [DOI] [PubMed] [Google Scholar]
- 34.Ono Y, Ito H, Tamamori M, Nozato T, Adachi S, Abe S, et al. Role and relation of p70 S6 and extracellular signal-regulated kinases in the phenotypic changes of hypertrophy of cardiac myocytes. Jpn Circ J. 2000;64(9):695–700. doi: 10.1253/jcj.64.695. [DOI] [PubMed] [Google Scholar]
- 35.Takano H, Komuro I, Zou Y, Kudoh S, Yamazaki T, Yazaki Y. Activation of p70 S6 protein kinase is necessary for angiotensin II-induced hypertrophy in neonatal rat cardiac myocytes. FEBS Lett. 1996;379(3):255–9. doi: 10.1016/0014-5793(95)01523-x. [DOI] [PubMed] [Google Scholar]
- 36.Jung DK, Bae GU, Kim YK, Han SH, Choi WS, Kang H, et al. Hydrogen peroxide mediates arsenite activation of p70(s6k) and extracellular signal-regulated kinase. Exp Cell Res. 2003;290(1):144–54. doi: 10.1016/s0014-4827(03)00320-3. [DOI] [PubMed] [Google Scholar]
- 37.Ding M, Li J, Leonard SS, Shi X, Costa M, Castranova V, et al. Differential role of hydrogen peroxide in UV-induced signal transduction. Mol Cell Biochem. 2002;234-235(12):81–90. [PubMed] [Google Scholar]
- 38.Zhang X, Shu L, Hosoi H, Murti KG, Houghton PJ. Predominant nuclear localization of mammalian target of rapamycin in normal and malignant cells in culture. J Biol Chem. 2002;277(31):28127–34. doi: 10.1074/jbc.M202625200. [DOI] [PubMed] [Google Scholar]
- 39.Christophe D, Christophe-Hobertus C, Pichon B. Nuclear targeting of proteins: how many different signals? Cell Signal. 2000;12(5):337–41. doi: 10.1016/s0898-6568(00)00077-2. [DOI] [PubMed] [Google Scholar]
- 40.Rommel C, Bodine SC, Clarke BA, Rossman R, Nunez L, Stitt TN, et al. Mediation of IGF-1-induced skeletal myotube hypertrophy by PI(3)K/Akt/mTOR and PI(3) K/Akt/GSK3 pathways. Nat Cell Biol. 2001;3(11):1009–13. doi: 10.1038/ncb1101-1009. [DOI] [PubMed] [Google Scholar]
- 41.Vyas DR, Spangenburg EE, Abraha TW, Childs TE, Booth FW. GSK-3beta negatively regulates skeletal myotube hypertrophy. Am J Physiol Cell Physiol. 2002;283(2):C545–51. doi: 10.1152/ajpcell.00049.2002. [DOI] [PubMed] [Google Scholar]
- 42.Antos CL, McKinsey TA, Frey N, Kutschke W, McAnally J, Shelton JM, et al. Activated glycogen synthase-3 beta suppresses cardiac hypertrophy in vivo. Proc Natl Acad Sci U S A. 2002;99(2):907–12. doi: 10.1073/pnas.231619298. [DOI] [PMC free article] [PubMed] [Google Scholar]
- 43.Neal JW, Clipstone NA. Glycogen synthase kinase-3 inhibits the DNA binding activity of NFATc. J Biol Chem. 2001;276(5):3666–73. doi: 10.1074/jbc.M004888200. [DOI] [PubMed] [Google Scholar]
- 44.Jefferson LS, Fabian JR, Kimball SR. Glycogen synthase kinase-3 is the predominant insulin-regulated eukaryotic initiation factor 2B kinase in skeletal muscle. Int J Biochem Cell Biol. 1999;31(1):191–200. doi: 10.1016/s1357-2725(98)00141-1. [DOI] [PubMed] [Google Scholar]
- 45.Welsh GI, Miller CM, Loughlin AJ, Price NT, Proud CG. Regulation of eukaryotic initiation factor eIF2B: glycogen synthase kinase-3 phosphorylates a conserved serine which undergoes dephosphorylation in response to insulin. FEBS Lett. 1998;421(2):125–30. doi: 10.1016/s0014-5793(97)01548-2. [DOI] [PubMed] [Google Scholar]
- 46.Liu Z, Dronadula N, Rao GN. A novel role for nuclear factor of activated T cells in receptor tyrosine kinase and G protein-coupled receptor agonist-induced vascular smooth muscle cell motility. J Biol Chem. 2004;279(39):41218–26. doi: 10.1074/jbc.M406917200. [DOI] [PubMed] [Google Scholar]
- 47.Yamada KM, Araki M. Tumor suppressor PTEN: modulator of cell signaling, growth, migration and apoptosis. J Cell Sci. 2001;114(Pt 13):2375–82. doi: 10.1242/jcs.114.13.2375. [DOI] [PubMed] [Google Scholar]
- 48.Tamura M, Gu J, Matsumoto K, Aota S, Parsons R, Yamada KM. Inhibition of cell migration, spreading, and focal adhesions by tumor suppressor PTEN. Science. 1998;280(5369):1614–7. doi: 10.1126/science.280.5369.1614. [DOI] [PubMed] [Google Scholar]
- 49.Lee SR, Yang KS, Kwon J, Lee C, Jeong W, Rhee SG. Reversible inactivation of the tumor suppressor PTEN by H2O2. J Biol Chem. 2002;277(23):20336–42. doi: 10.1074/jbc.M111899200. [DOI] [PubMed] [Google Scholar]
- 50.Torres J, Pulido R. The tumor suppressor PTEN is phosphorylated by the protein kinase CK2 at its C terminus. Implications for PTEN stability to proteasome-mediated degradation. J Biol Chem. 2001;276(2):993–8. doi: 10.1074/jbc.M009134200. [DOI] [PubMed] [Google Scholar]


