

Abstract
BACKGROUND:
Previous risk scores have shown excellent performance. However, the need for real-time risk score computation makes their implementation in an emergent situation challenging. A more simplified approach can provide practitioners with a practical bedside risk stratification tool.
METHODS:
We developed an easy-to-use tree-structured risk stratification model for patients undergoing early Percutaneous Coronary Intervention (PCI) for Acute Myocardial Infraction (AMI). The model was developed on the New York State PCI database for 1999-2000 (consisting of 5385 procedures) and was validated using the subsequent 2001-2002 database (consisting of 7414 procedures).
RESULTS:
Tree-structured modeling identified three key presenting features: cardiogenic shock, congestive heart failure and age. In the validation dataset, this risk stratification model identified patient groups with in-hospital mortality ranging from 0.5% to 20.6%, more than a twenty-fold increased risk. The performance of this model was similar to the Mayo Clinic Risk Score with a discriminative capacity of 82% (95% CI: 79%, 84%) versus 80% (95% CI: 77%, 82%), respectively.
CONCLUSION:
Patients undergoing PCI for AMI can be readily stratified into risk categories using the tree-structured model. This provides practicing cardiologists with an internally validated and easy-to-use scheme for in-hospital mortality risk stratification.
Keywords: Tree-structured risk stratification, acute myocardial infarction, percutaneous coronary intervention
Introduction
With increasing operator experience, refinement in technology, and the availability of improved stent designs, percutaneous coronary intervention (PCI) is now considered the treatment of choice for many high-risk subgroups in whom it was previously contraindicated [1-3]. In 2002 an estimated 657,000 PCI procedures were performed on 640,000 patients in the United States. From 1987 to 2002 the number of procedures had increased 324 percent [4]. Alongside this increasing utilization of the procedure, a number of prediction models that identify important risk factors of mortality and post-procedural complications have been reported [5-18]. The development of these predictive models was partly motivated by the desire to predict an individual's risk of death after PCI and partly by the need for risk adjustment when comparing results from different operators and institutions. An alternative modeling approach such as tree-structured prediction with an enhanced ability to detect non-linear relationships, easy interpretability and visual appeal is well suited for real-time risk stratification [19]. However, to our knowledge, such tree-structured models to predict in-hospital mortality following PCI have not yet been reported.
Therefore the objectives of this study are to develop and validate a tree-structured model for in-hospital mortality in patients with AMI undergoing PCI and to compare the performance of such a model with the Mayo Clinic Risk Score [16-18] on the New York State Percutaneous Coronary Interventions Reporting System (PCIRS).
Methods
Data Sources and Study Population
The analysis was based on the New York State PCIRS which the New York State Department of Health and its Cardiac Advisory Committee established. The PCIRS is the largest state-oriented collection of audited data on patient outcomes from angioplasty nationwide. The database represents an ongoing quality of care improvement effort with a standardized data collection form and quality control mechanism [10, 20].
For the current analysis, the patient population included all patients who underwent emergent PCI. We defined patients with emergent PCI as patients who underwent PCI for AMI within 24 hours of the onset of chest pain, excluding those who received thrombolysis within seven days of PCI. AMI is defined as any AMI, i.e., not restricted to only ST-segment elevation myocardial infarction (STEMI), as reported in earlier publication [18].
Mayo Clinic Risk Score
The MCRS was derived from a multivariable logistic regression model [17]. In brief, it is computed as the sum of integer scores based upon the following patient's presenting features; age (+1 for each decade after 30), cardiogenic shock (+5), serum creatinine >2.5 mg/dl or renal failure requiring dialysis (+3), being an urgent or emergent procedure (+2), New York Heart Association (NYHA) functional class III/IV heart failure (+2), the presence of angiographic thrombus (+2), left main disease (+5) and multivessel disease (+2). Based on the total risk score, patients were classified into risk categories of very low risk (MCRS = 0-5), low risk (MCRS = 6-8), moderate risk (MCRS = 9-11), high risk (MCRS = 12-14) and very high risk (MCRS = 15 and above). Multivessel disease was defined as the presence of at least one lesion with ≥ 70% diameter stenosis in at least two vessels. Some discrepancies in definition between the variables used in the original MCRS derivation and those available in the PCIRS database were noted and these discrepancies were resolved on the basis of practical considerations as described in earlier publication [18].
Tree-structured prediction/prognostic classification
A prediction tree is a particular kind of decision tree. The “decision” is to make a specific prediction given certain demographic and clinical characteristics. This prediction is arrived at by a structured sequence of yes/no questions concerning the demographic and clinical characteristics of the patient. The resulting structure is a binary tree [19].
In brief, tree construction involves recursively partitioning the data set on the basis of a set of simple binary (yes/no) questions, or splits, phrased in terms of the covariates. For example, is age >= 60? The sub-samples created by assigning subjects according to these splits are termed nodes. Nodes that can be split further are called internal or parent nodes, otherwise they are called terminal nodes. The algorithm proceeds starting from the whole data set, also known as the root node, in such a way that each parent node produces two daughter nodes, which in turn can become parent nodes producing additional daughter nodes. The root node can be regarded as an internal node. At each internal/parent node, a split that maximizes the between nodes, i.e., resulting daughter nodes, dissimilarity is selected as the best split among all allowable splits. When two daughter nodes are relatively homogeneous or pure, they tend to differ from each other. Since potentially it is possible to grow a very large tree with homogeneous or pure terminal nodes containing very few subjects, hence leading to overfitting, cross-validation along with computationally light model selection approaches is employed to select the final tree [21-22]. The terminal nodes of the final tree constitute the prognostic classes. For a more detailed treatment of tree growing, we refer the reader to Breiman et al [19]. The statistical summaries characterizing the prognostic classes can be presented using comparative measures such as odds ratios as described below.
Considering in-hospital mortality (coded as d=1 if died in hospital, d=0 if discharged alive) as the outcome of interest, z representing a vector of predictors such as age, congestive heart failure (CHF), etc., we developed a model that fits the data well in the form of a classification, i.e., such that the log odds of in-hospital mortality was represented by:
Where γ0 represents the log odds of in-hospital mortality for the best prognostic class, i.e., for individuals in the reference class; the Is denote ‘dummy’ variables, functions of the predictor z, indicating membership to one of the classes other than the reference class. For instance, if individuals in class k are defined as those patients with previous history of CHF, male, and age >= 60 then Ik (z) = 1 if (CHF= yes and gender = male and age >= 60); 0 otherwise. The γis, i=1, …, p, are log odds ratios comparing the ith prognostic class to the reference class with respect to in-hospital mortality.
Thus, the above equation represents p + 1 distinct prognostic classes: the reference class and p additional classes, the kth class being characterized by an odds ratio, with respect to the reference class, given by exp{γk}. This model is more flexible than the traditional logistic regression model where linearity of covariate effect is automatically assumed in most cases [23]. In addition, the above model can be represented visually as a binary tree structure.
We considered 21 presenting features of interest in the learning dataset (i.e., restricting the dataset to 1999 – 2000). These presenting features were selected from all the available baseline variables in the New York State PCIRS on the basis of their clinical importance, i.e., having been identified in previous studies as being a risk factor for inhospital mortality [5-17]. Tree construction was carried out using a stopping rule of 350 patients in internal nodes and 175 patients in terminal nodes. Such a stopping rule was used to ensure interpretable results while allowing growing a relatively large initial tree.
Ten-fold cross-validation was employed for model selection. In addition, to further refine the process of selecting the final tree, deviance from the pruning sequence was investigated. Specifying in-hospital mortality as the outcome of interest, the terminal nodes of the final tree, i.e., after pruning, constituted the risk strata. Area under the Receiver Operating Characteristics (ROC) curve was employed to measure discrimination [24].
We compared the resulting tree-structured risk stratification with the one from the MCRS on the basis of performance on the testing dataset (i.e., dataset restricted to 2001 – 2002 which mimics future procedures) using area under the ROC curve. For each risk stratification scheme, the estimated odds ratio (OR) and associated 95% confidence interval (CI) comparing each risk stratum to the best prognostic group with respect to inhospital mortality is presented. Generalized estimating equations were used to account for clustering of observations within providers [25].
Statistical analyses were conducted in S-PLUS, version 6.0 (S-PLUS Insightful Corp., Seattle, Washington) and SAS version 9.1 (SAS Institute, Cary, North Carolina).
Results
Baseline Characteristics
Table1 shows the distribution of baseline covariates considered for analysis in the tree-structured model. The learning and testing datasets were similar with respect to the distribution of age at admission, gender, history of heart failure, smoking history, other comorbidities and procedural characteristics. However, pre-procedure related medication use was lower in the testing dataset.
Table 1.
Distribution of baseline covariates considered in the tree-structured model.
| Covariate | Learning dataset (%) (N=5385) |
Testing dataset (%) (N=7414) |
|---|---|---|
|
Demographic characteristics |
||
| Age | 61.7 (12.8)† | 61.2 (13.1) |
| Sex | ||
| Female | 29.8 | 28.9 |
| Body Mass Index (BMI) | 28.2 (5.2) † | 28.7 (5.7) |
| Race | ||
| White | 87.1 | 84.3 |
| Black | 5.9 | 6.4 |
| Other | 7.0 | 9.3 |
| Ethnicity | ||
| Hispanic | 7.6 | 8.0 |
| Current Smoking | 28.0 | 32.2 |
| Clinical characteristics | ||
| Diabetes | 19.1 | 20.1 |
| Hypertension | 59.7 | 62.7 |
| Congestive Heart Failure (CHF) |
10.3 | 8.7 |
| Vascular disease | 6.4 | 6.5 |
| Renal failure (including dialysis) |
1.4 | 1.8 |
| Chronic lung disease (COPD) |
5.4 | 5.9 |
| Malignant Ventricular Arrythemia |
4.7 | 2.6 |
| Prior myocardial infarction | 17.1 | 16.0 |
| Prior PCI | 16.5 | 17.3 |
| Prior open heart surgery | 8.5 | 8.2 |
| Hemodynamic Instability or Cardiogenic shock |
8.1 | 5.9 |
| Previous stroke | 4.4 | 3.9 |
| Vessel Disease | ||
| Left Main disease | 1.9 | 1.8 |
| Multivesel disease | 43.8 | 45.0 |
|
Pre-procedure related medications |
||
| IVGPI Gp3b/3a | 70.8 | 36.5 |
Age is presented as mean (SD).
Risk stratification by the Mayo Clinic Risk Score
The distribution of in-hospital events and length of stay based on the MCRS stratification is presented in Table 2. In-hospital mortality, the composite event rate and length of stay monotonically increased with higher risk MCRS categories. As no in-hospital mortality was observed in the very low risk group, the very low and low risk groups were combined to form the reference group in the subsequent analysis. Compared to patients with very low or low risk by MCRS, patients classified as moderate, high or very high risk incurred progressively higher odds of in-hospital mortality in both the learning and testing datasets (Table 3). The MCRS demonstrated excellent discriminative capacity, i.e., with area under the ROC curve 80% with 95% CI (77%, 82%).
TABLE 2.
In-hospital events (%) and length of stay by Mayo Clinic Risk Score category
| Risk category | |||||
|---|---|---|---|---|---|
| Very Low | Low | Moderate | High | Very High† | |
| Learning dataset (N) | 136 | 2137 | 2240 | 548 | 324‡ |
| Validation dataset (N) | 203 | 3020 | 3107 | 741 | 343 |
| Hospital mortality | 0.00 | 0.75 | 2.63 | 8.40 | 23.20 |
| 0.00 | 0.66 | 1.83 | 8.23 | 25.36 | |
| Stroke | 0.00 | 0.23 | 0.67 | 0.91 | 1.54 |
| 0.49 | 0.26 | 0.55 | 1.48 | 2.92 | |
| Bypass surgery | 0.74 | 0.37 | 0.94 | 1.46 | 3.40 |
| 0.00 | 0.30 | 0.32 | 0.94 | 2.04 | |
| Composite event* | 0.74 | 1.31 | 3.88 | 10.40 | 26.54 |
| 0.49 | 1.13 | 2.41 | 9.85 | 27.41 | |
|
Average length of stay (days) |
3.80 | 4.20 | 5.80 | 9.00 | 15.50 |
| 3.90 | 3.80 | 5.00 | 8.00 | 10.30 | |
Legend: MCRS=Mayo Clinic Risk Score
Composite event is the combined end point of death, stroke or coronary bypass surgery.
Sum score for very low (MCRS= 0-5), low (MCRS= 6-8), moderate (MCRS= 9-11), high (MCRS= 12-14) and very high (MCRS >= 15).
The first row represents figures from the learning dataset while the second row represents figures from the testing dataset.
Table 3.
Odds ratios comparing each risk group with the reference group with respect to in-hospital mortality based on MCRS.
| Risk group | Learning dataset | Testing dataset |
|---|---|---|
| Very low / low† | 1.0 | 1.0 |
| Moderate | 3.8 (2.2, 6.7) | 3.0 (1.9, 4.7) |
| High | 12.9 (7.4, 22.5) | 14.3 (8.6, 23.8) |
| Very high | 42.5 (24.4, 73.9) | 53.8 (33.2, 87.3) |
| Area under ROC curve‡ | 0.78 (0.76, 0.81) | 0.80 (0.77, 0.82) |
Legend: MCRS=Mayo Clinic Risk Score
Sum score for very low/ low (MCRS = 0-8), moderate (MCRS= 9-11), high (MCRS =12-14) and very high (MCRS >= 15).
ROC = Receiver Operating Characteristics
Tree-structured prognostic classification
In the learning dataset, the tree-structured model identified cardiogenic shock, index hospitalization congestive heart failure (CHF) and age as important prognostic factors for in-hospital mortality. Figure 1 depicts the final tree, i.e., after pruning, along with the in-hospital mortality data for each node. The first split occurred on cardiogenic shock; patients presenting with cardiogenic shock having an elevated risk of in-hospital mortality (18.3%). Among patients presenting without cardiogenic shock, those presenting with CHF had the next higher risk for in-hospital mortality (10.6%) followed by those presenting with neither cardiogenic shock nor CHF, and 80 years or older (5.8%). Finally, among patients presenting with neither cardiogenic shock, nor CHF and younger than 80 years, those between 60 to 79 years of age had a higher risk of in-hospital mortality (2.0%). The remaining patients constituted the best prognostic group with 0.6% in-hospital mortality.
Figure1. Prognostic classification for in-hospital mortality: learning dataset.
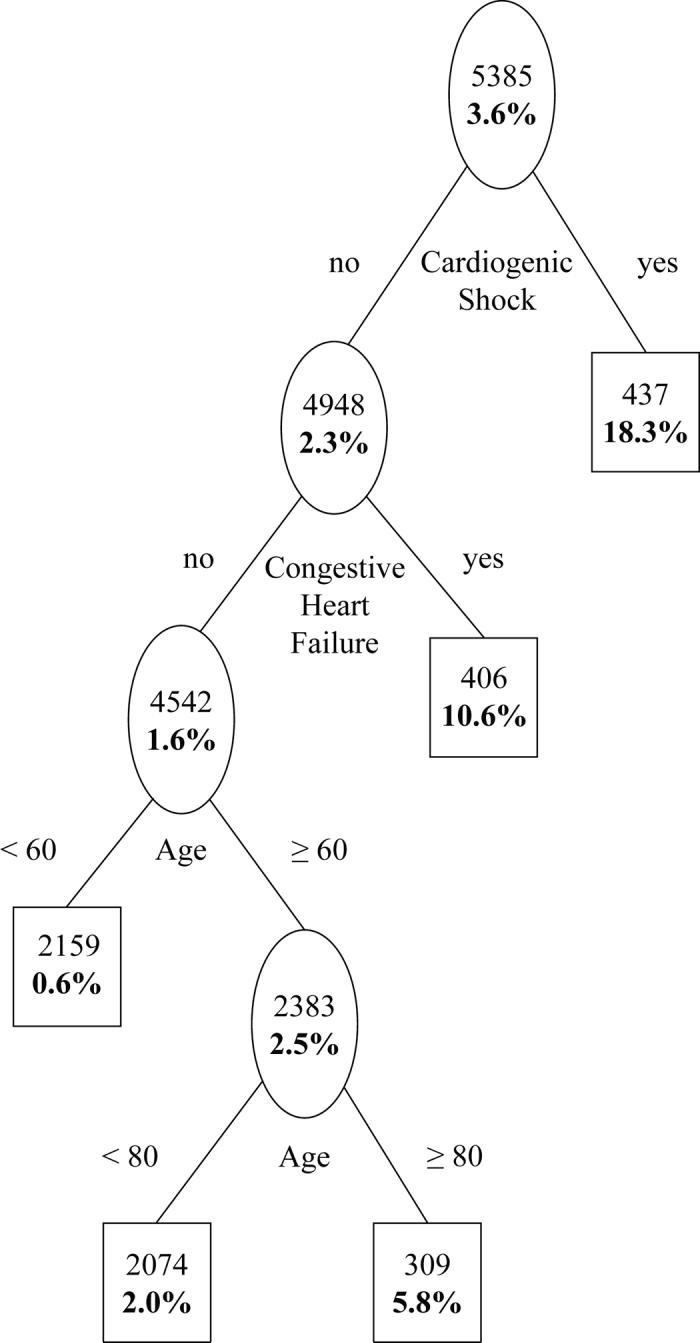
Plain figures are number of subjects in a node and bold figures are in-hospital mortality.
In-hospital events and length of stay for the risk groups based on Figure1 are shown in Table 4. In addition to in-hospital mortality, the composite event rate and length of stay also monotonically increased with the ordering of the risk groups. Considering the left most group in Figure 1 as reference (i.e., the lowest risk group consisting of patients who are less than 60 years of age without CHF and cardiogenic shock), odds ratios and associated 95% CIs comparing each of the remaining groups to the reference with respect to in-hospital mortality are presented in Table 5.
Table 4.
In-hospital events (%) and length of stay by tree-structured prognostic classification.
| Risk category | |||||
|---|---|---|---|---|---|
| Very Low | Low | Moderate | High | Very High† | |
| Learning dataset (N) | 2159 | 2074 | 309 | 406 | 437‡ |
| Testing dataset (N) | 3223 | 2731 | 513 | 509 | 438 |
| Hospital mortality | 0.60 | 2.03 | 5.83 | 10.59 | 18.31 |
| 0.50 | 1.94 | 4.68 | 8.25 | 20.55 | |
| Stroke | 0.23 | 0.72 | 0.00 | 0.99 | 1.37 |
| 0.31 | 0.51 | 1.36 | 0.79 | 2.74 | |
| Bypass surgery | 0.79 | 0.68 | 0.32 | 1.23 | 2.75 |
| 0.37 | 0.29 | 0.19 | 0.39 | 2.28 | |
| Composite event* | 1.48 | 3.13 | 6.15 | 12.32 | 21.28 |
| 1.02 | 2.49 | 5.65 | 9.23 | 22.83 | |
|
Average length of stay (days) |
4.20 | 5.40 | 7.30 | 11.00 | 12.60 |
| 3.90 | 4.70 | 6.20 | 8.30 | 10.50 | |
Composite event is the combined end point of death, stroke or coronary bypass surgery.
Very Low = (< 60 yrs & no CHF & no cardiogenic shock), low = (60 - < 80 yrs & no CHF & no cardiogenic shock), moderate = (≥ 80 yrs & no CHF & no cardiogenic shock), high = (CHF present) and very high = (cardiogenic shock).
The first row represents figures from the learning dataset while the second row represents figures from the testing dataset.
Table 5.
Odds ratios comparing each risk group with the reference group with respect to in-hospital mortality based on tree-structured prognostic classification.
| Risk group | Learning dataset | Testing dataset |
|---|---|---|
| Very low (< 60yrs & no CHF & no cardiogenic shock) |
1.0 | 1.0 |
| Low (60-< 80yrs & no CHF & no cardiogenic shock) |
3.4 (1.8, 6.6) | 3.9 (2.1, 7.4) |
| Moderate (≥ 80 yrs & no CHF & no cardiogenic shock) |
10.2 (4.4, 23.6) | 9.7 (4.8, 19.4) |
| High (CHF present) |
19.5 (10.2, 37.5) | 17.8 (9.5, 33.3) |
| Very high (Cardiogenic shock) |
36.9 (20.3, 67.3) | 50.7 (28.1, 91.6) |
| Area under ROC curve† | 0.81 (0.79, 0.83) | 0.82 (0.79, 0.84) |
ROC = Receiver Operating Characteristics
The tree-structured model shown in Figure 1 was subsequently evaluated on the testing data set, the model satisfactorily stratified patients in the testing dataset into markedly different risk groups (Figure 2). As in the learning dataset, the risk of in-hospital mortality, composite event rate and length of stay monotonically increased with the ordering of the risk groups in the testing dataset (Table 4). Moreover, the validation result revealed a substantial risk variation across the derived risk groups (Table 5).
Figure2. Prognostic classification for in-hospital mortality: testing dataset.
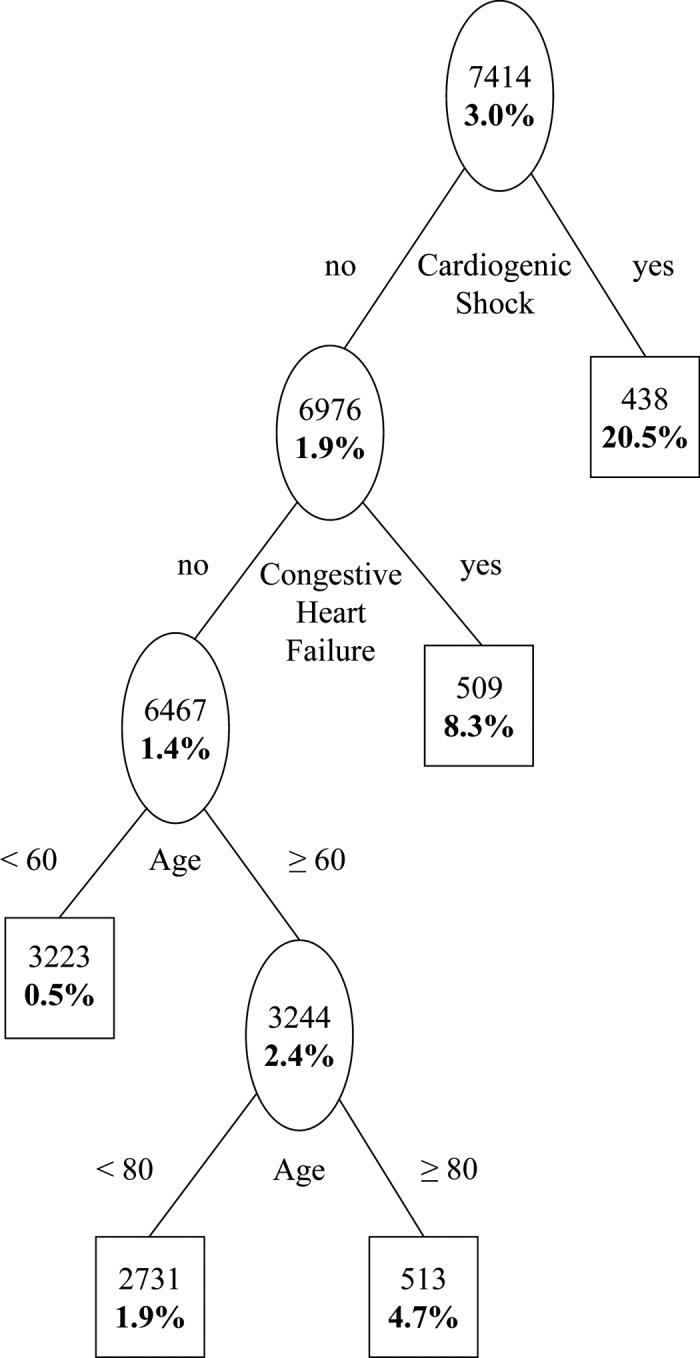
Plain figures are number of subjects in a node and bold figures are in-hospital mortality.
Based on the area under the ROC curve evaluated on the testing dataset, the discriminative capacity of the tree-structured model was 82% with 95% CI (79%, 84%) while it was 80% with 95% CI (77%, 82%) for the MCRS (Table 3).
Discussion
In this analysis we employed a novel tree-structured model as a tool for risk stratification of patients with AMI. This tree-structured prediction model reveals that only three presenting features cardiogenic shock, congestive heart failure and age satisfactorily predict in-hospital mortality, with discriminative capacity similar to the established Mayo Clinic Risk Score.
We observed that both composite events and length of stay monotonically increase with the ordering of the risk groups. This observation would suggest that the classification scheme could also be used as an indicator of the risk of complications and longer length of stay even though it was derived from modeling in-hospital mortality.
The Mayo Clinic Risk Score (MCRS) has been employed extensively and demonstrates excellent discriminative capacity [16-18]. However, in order to determine MCRS, in addition to clinical characteristics such as age, renal insufficiency, congestive heart failure, procedural variables such as emergent nature of procedure and angiographic characteristics such as presence of angiographically evident thrombus, left main coronary disease and multivessel coronary disease are needed which are not available before angiography. As a result, real-time computation of risk score may be delayed until all such information is available. In contrast, the proposed tree-structured model utilizes three clinical presenting features that can be assessed any time prior to catheterization. Furthermore, representation of the model as a binary tree structure makes it easier to use and potentially enhances its utility as a bedside tool.
In many ways our analysis confirms not only the importance but also the ordering of clinical factors that have been repeatedly demonstrated as strong predictors of outcome following AMI [26 - 28]. Not surprisingly, patients with cardiogenic shock were identified as the highest risk group followed by those with congestive heart failure. These risk factors were identified even in the earliest of risk stratification schemes, the Killip classification [29]. Besides the primary angioplasty in myocardial infarction (PAMI) risk score that excludes cardiogenic shock patients [26], perhaps our model is the only other risk model that doesn't require angiographic variables prior to risk stratification. Therefore, potential application of our model includes the efficient and early identification of high-risk groups in whom not only therapy may be tailored to risk, but also allow a frank discussion of risks and benefits of potential treatment strategies such as cardiac catheterization. Early revascularization for cardiogenic shock has been shown to be effective [3, 30-31], the identification that patients with CHF carry the next highest risk in the tree-structured model could serve to alert the operator about the initiation of supportive mechanical and pharmacological therapy. On the other hand, patients deemed to be at low risk might be managed less intensively following PCI, even with the possibility of early discharge. Another potential application of the tree-structured model is its use as a means of risk stratifying patients in clinical trials prior to randomization [32].
Based on the literature, one might wonder why a further split on age among patients with cardiogenic shock and splits on other comorbidities such as diabetes and renal failure did not appear somewhere in Figure 2. Actually, a further split on age among patients with cardiogenic shock did occur when lower stopping rules employed, and also, splits on these comorbidities did appear in the lower part of the large tree, i.e., before pruning (result not shown). However, pruning of the large tree resulted in closing of such splits since they did not add substantially to the overall discriminative capacity of the final model.
Usually analysis of an existing dataset has limitations, specifically relating to data quality. However, in the case of the PCIRS database, a rigorous quality control mechanism is already put in place, i.e., a standard form is employed for data collection and accuracy of data is maintained by continuous auditing of medical records [10, 20]. Therefore, no systematic bias favoring either model is expected. Additional variables that were not available in the database might have affected the level of risk discrimination, however, this makes our finding somewhat conservative. Since the STEMI versus non-STEMI status of patients is not available to us, we couldn't evaluate how well the tree-structured risk stratification model performs in non-STEMI patients. This is a potential limitation of our analysis. Another potential limitation of our study is that the patient mix in the PCIRS database might be different from those treated in other places; nonetheless, the variables identified by our analysis have been repeatedly shown to be predictors of in-hospital mortality in various databases and studies [26-27, 29]. Moreover, we do believe that the patient mix doesn't impact on the result of the comparison between the two risk stratification approaches as they are evaluated on the same database. Finally, the PCIRS database enabled us to address an important question efficiently that otherwise would have been very hard to approach in other settings [33-34].
Left ventricular ejection fraction (LVEF) was the only variable with missing values in the database. In the preliminary analysis, LVEF did appear in the tree-structure. However, this preliminary analysis resulted in the exclusion of 11% of the subjects in the validation dataset due to missing values. Since LVEF is likely to be missing in a sizeable number of patients in real-life practice, we excluded LVEF from our subsequent analysis in order to make our final model more useable by practitioners in a clinical setting without compromising the discriminative capacity of the final model.
In conclusion, AMI patients undergoing emergent PCI (within 24 hours of chest pain) can be reliably classified using well established prognostic factors: cardiogenic shock, congestive heart failure and age using a simple binary tree representation. Patients without cardiogenic shock and congestive heart failure and those younger than sixty enjoy the best prognosis. With the ever increasing use of PCI in AMI and the desire to reduce mortality in the management of such patients, innovative approaches such as this tree-structured risk stratification model have the potential to assist in the triage of patients and improve their outcomes.
We look forward to attempts to test the applicability of the tree-structure model developed in this study on other patient populations.
Acknowledgements
This work was supported by the National Lung, Heart and Blood Institute grant R21 HL080580-01 A2 (AN).
Footnotes
Publisher's Disclaimer: This is a PDF file of an unedited manuscript that has been accepted for publication. As a service to our customers we are providing this early version of the manuscript. The manuscript will undergo copyediting, typesetting, and review of the resulting proof before it is published in its final citable form. Please note that during the production process errors may be discovered which could affect the content, and all legal disclaimers that apply to the journal pertain.
References
- 1.Berger AK, Schulman KA, Gersh BJ, et al. Primary coronary angioplasty vs thrombolysis for the management of acute myocardial infarction in elderly patients. JAMA. 1999;282:341–8. doi: 10.1001/jama.282.4.341. [DOI] [PubMed] [Google Scholar]
- 2.Ellis SG, Tamai H, Nobuyoshi M, et al. Contemporary percutaneous treatment of unprotected left main coronary stenoses: initial results from a multicenter registry analysis 1994-1996. Circulation. 1997;96:3867–72. doi: 10.1161/01.cir.96.11.3867. [DOI] [PubMed] [Google Scholar]
- 3.Hochman JS, Sleeper LA, Webb JG, et al. Early revascularization in acute myocardial infarction complicated by cardiogenic shock. N Engl J Med. 1999;341:625–34. doi: 10.1056/NEJM199908263410901. [DOI] [PubMed] [Google Scholar]
- 4.American Heart Association Heart Disease and Stroke Statistics –2005 update: Medical procedures and costs. Available at: www.americanheart.org/statistics/medical.htlm. Accessed July 7, 2005.
- 5.O'Connor GT, Malenka DJ, Quinton H, et al. Multivariate prediction of in-hospital mortality after percutaneous coronary interventions in 1994-1996. J Am Coll Cardiol. 1999;34:681–691. doi: 10.1016/s0735-1097(99)00267-3. [DOI] [PubMed] [Google Scholar]
- 6.Holmes DR, Berger PB, Garratt KN, et al. Application of the New York State PTCA mortality model in patients undergoing stent implantation. Circulation. 2000;102:517–522. doi: 10.1161/01.cir.102.5.517. [DOI] [PubMed] [Google Scholar]
- 7.Kimmel SE, Berlin JA, Storm BL, et al. Development and Validation of a simplified predictive index for major complications in contemporary percutaneous transluminal coronary angioplasty practice. J Am Coll Cardiol. 1995;26:931–938. doi: 10.1016/0735-1097(95)00294-4. [DOI] [PubMed] [Google Scholar]
- 8.Block PC, Peterson EC, Krone R, et al. Identification of variables needed to risk adjusted outcomes of coronary interventions: evidence-based guidelines for efficient data collection. J Am Coll Cardiol. 1998;32:275–282. doi: 10.1016/s0735-1097(98)00208-3. [DOI] [PubMed] [Google Scholar]
- 9.Moscucii M, O'Connor GT, Ellis SG, et al. Validation of risk adjustment models for in-hospital percutaneous transluminal coronary angioplasty mortality on an independent data set. J Am Coll Cardiol. 1999;34:692–697. doi: 10.1016/s0735-1097(99)00266-1. [DOI] [PubMed] [Google Scholar]
- 10.Hannan EL, Racz M, Ryan TJ, et al. Coronary Angioplasty volume-outcome relationships for hospitals and Cardiologists. JAMA. 1997;277:892–898. [PubMed] [Google Scholar]
- 11.Hannan EL, Arani DJ, Johnson LW, et al. Percutaneous transluminal coronary angioplasty in New York State: risk factors and outcomes. JAMA. 1992;268:3092–3097. [PubMed] [Google Scholar]
- 12.Shaw RE, Anderson V, Brindis RG, et al. Development of a risk adjustment mortality model using the American College of Cardiology-National Cardiovascular Data Registry (ACC-NCDR) experience: 1998-2000. J Am Coll Cardiol. 2002;39:1104–1112. doi: 10.1016/s0735-1097(02)01731-x. [DOI] [PubMed] [Google Scholar]
- 13.Ellis SG, Weintraub W, Holmes DR, et al. Relation of operator volume and experience to procedural outcome of percutaneous coronary revascularization at hospitals with high interventional volumes. Circulation. 1997;95:2479–2484. doi: 10.1161/01.cir.95.11.2479. [DOI] [PubMed] [Google Scholar]
- 14.Moscucci M, Kline-Rogers E, Share D, et al. Simple bedside additive tool for prediction of in-hospital mortality after percutaneous coronary interventions. Circulation. 2001;104:263–268. doi: 10.1161/01.cir.104.3.263. [DOI] [PubMed] [Google Scholar]
- 15.Holmes DR, Selzer F, Johnston JM, et al. Modeling and Risk Prediction in the Current Era of Intervention Cardiology: A Report From the National Heart, Lung, and Blood Institute Dynamic Registry. Circulation. 2003;107:1871–1876. doi: 10.1161/01.CIR.0000065229.72905.78. [DOI] [PubMed] [Google Scholar]
- 16.Singh M, Rihal CS, Selzer F, et al. Validation of Mayo Clinic Risk Adjustment Model for In-Hospital Complications After Percutaneous Coronary Interventions, Using the National Heart, Lung, and Blood Institute Dynamic Registry. J Am Coll Cardiol. 2003;42:1722–8. doi: 10.1016/j.jacc.2003.05.007. [DOI] [PubMed] [Google Scholar]
- 17.Singh M, Lennon RJ, Holmes DR, et al. Correlates of procedural complications and a simple integer risk score for percutaneous coronary intervention. J Am Coll Cardiol. 2002;40:387–93. doi: 10.1016/s0735-1097(02)01980-0. [DOI] [PubMed] [Google Scholar]
- 18.Sampath-Kumar Sridhar, Negassa Abdissa, Scott Monrad E, Srinivas VS. The Mayo Clinic Risk Adjustment Model Predicts In-Hospital Mortality in a Contemporary Primary Angioplasty Population. Journal of Invasive cardiology. 2005;17:522–6. [PubMed] [Google Scholar]
- 19.Breiman L, Friedman JH, Olshen RA, Stone CJ. Classification and regression Trees. Wadsworth International Group; Belmont, CA: 1984. [Google Scholar]
- 20.New York State Department of Health Percutaneous Coronary Intervention (PCI) in New York State, 1998-2000. 2003 http://www.health.state.ny.us. Accessed Feb 15, 2005.
- 21.Negassa A, Ciampi A, Abrahamowicz M, Shapiro S, Boivin J-F. Tree-structured Prognostic Classification for Censored Survival Data: Validation of Computationally Inexpensive Model Selection Criteria. Journal of Statistical Computation and Simulation. 2000;67:289–318. [Google Scholar]
- 22.Negassa A, Ciampi A, Abrahamowicz M, Shapiro S, Boivin J-F. Tree Structured Subgroup Analysis for Censored Survival Data: Validation of Computationally Inexpensive Model selection Criteria. STATISTICS AND COMPUTING. 2005;15:231–239. [Google Scholar]
- 23.Hosmer DW, Lemeshow S. Applied Logistic Regression. Second Editon John Wiley & Sons Inc.; New York, NY: 2000. [Google Scholar]
- 24.Hanley JA, McNeil BJ. The meaning and use of the area under a receiver operating characteristic (ROC) curve. Radiology. 1982;143:29–36. doi: 10.1148/radiology.143.1.7063747. [DOI] [PubMed] [Google Scholar]
- 25.Zeger SL, Liang KY, Albert PS. Models for longitudinal data: a generalized estimating equation approach. Biometrics. 1988;42:1049–1060. [PubMed] [Google Scholar]
- 26.Addala S, Grines CL, Dixon SR, et al. Predicting Mortality in Patients With ST-Elevation Myocardial Infarction Treated With Primary Percutaneous Coronary Intervention (PAMI Risk Score) Am J Cardiol. 2004;93:629–632. doi: 10.1016/j.amjcard.2003.11.036. [DOI] [PubMed] [Google Scholar]
- 27.Halkin A, Singh M, Nikolsky E, et al. Prediction of Mortality After Primary Percutaneous Coronary Intervention for Acute Myocardial Infarction: The CADILLAC Risk Score. J Am Coll Cardiol. 2005;45:397–405. doi: 10.1016/j.jacc.2005.01.041. [DOI] [PubMed] [Google Scholar]
- 28.Wu C, Hannan EL, Walford G, et al. A Risk Score to Predict In-Hospital Mortality for Percutaneous Coronary Interventions. J Am Coll Cardiol. 2006;47:654–60. doi: 10.1016/j.jacc.2005.09.071. [DOI] [PubMed] [Google Scholar]
- 29.Killip T, Kimball JT. Treatment of myocardial infarction in coronary care unit: a two-year experience with 250 patients. Am J Cardiol. 1967;20:457–464. doi: 10.1016/0002-9149(67)90023-9. [DOI] [PubMed] [Google Scholar]
- 30.Hochman JS, Sleeper LA, Godfrey E, et al. Should we emergently revascularize occluded coronaries for cardiologic shock: an international randomized trial of emergency PTCA/CABG: trial design. Am Heart J. 1999;137:313–321. doi: 10.1053/hj.1999.v137.95352. [DOI] [PubMed] [Google Scholar]
- 31.Hochman JS, Sleeper LA, White HD, et al. One-year survival following early revascularization for cardiogenic shock. JAMA. 2001;285:190–192. doi: 10.1001/jama.285.2.190. [DOI] [PubMed] [Google Scholar]
- 32.Gaspar LE, Scott C, Murray K, Curran Wet. VALIDATION OF THE RTOG RECURRSIVE PARTITIONING ANALYSIS (RPA) CLASSIFICATION FOR BRAIN METASTASES. Int. J. Radiation Oncology Biol. Phys. 2000;47:1001–1006. doi: 10.1016/s0360-3016(00)00547-2. [DOI] [PubMed] [Google Scholar]
- 33.Deyo RA, Taylor VM, Diehr P, et al. Analysis of automated administrative and survey databases to study patterns and outcomes of care. Spine. 1994;19(18 Suppl):2083S–2091S. doi: 10.1097/00007632-199409151-00011. [DOI] [PubMed] [Google Scholar]
- 34.Iezzoni LI, Daley J, Heeren T, et al. Using administrative data to screen hospitals for high complication rates. Inquiry. 1994;31:40–55. [PubMed] [Google Scholar]