Abstract
We and others have previously shown that high levels of ANG II are accumulated in the rat kidney via a type 1 (AT1) receptor-mediated mechanism, but it is not known which AT1 receptor is involved in this process in rodents. We tested the hypothesis that AT1a receptor-deficient mice (Agtr1a−/−) are unable to accumulate ANG II intracellularly in the kidney because of the absence of AT1a receptor-mediated endocytosis. Adult male wild-type (Agtr1a+/+), heterozygous (Agtr1a+/−), and Agtr1a−/− were treated with vehicle, ANG II (40 ng/min ip via osmotic minipump), or ANG II plus the AT1 antagonist losartan (10 mg · kg−1 · day−1 po) for 2 wk. In wild-type mice, ANG II induced hypertension (168 ± 4 vs. 113 ± 3 mmHg, P < 0.001), increased kidney-to-body weight ratio (P < 0.01), caused pressure natriuresis (P < 0.05), and elevated plasma and whole kidney ANG II levels (P < 0.001). Concurrent administration of ANG II with losartan attenuated these responses to ANG II. In contrast, Agtr1a−/− mice had lower basal systolic pressures (P < 0.001), smaller kidneys with much fewer AT1b receptors (P < 0.001), higher basal 24-h urinary sodium excretion (P < 0.01), as well as basal plasma and whole kidney ANG II levels (P < 0.01). However, intracellular ANG II levels in the kidney were lower in Agtr1a−/− mice. In Agtr1a−/− mice, ANG II slightly increased systolic pressure (P < 0.05) but had no effect on the kidney weight, urinary sodium excretion, and whole kidney ANG II levels. Losartan restored systolic pressure to basal levels and decreased whole kidney ANG II levels by ~20% (P < 0.05). These results demonstrate a predominant role of AT1a receptors in blood pressure regulation and in the renal responses to long-term ANG II administration, that AT1b receptors may play a limited role in blood pressure control and mediating intrarenal ANG II accumulation in the absence of AT1a receptors.
Keywords: Kidney, losartan, receptor endocytosis, urinary sodium excretion
The kidney plays a major role in blood pressure regulation and body salt and fluid balance in part by producing the vasoconstrictor and sodium retaining-hormone ANG II. All major components of the renin-angiotensin system necessary for ANG II formation are present in the kidney, with renin expressed in juxtaglomerular apparatus, angiotensin-converting enzyme (ACE) in the brush-border of proximal tubule cells, and ANG II receptors in various renal cells (1, 6, 9, 14, 25, 26). Kidney-derived renin and ANG II are released in the circulation, acting as an endocrine hormone system to maintain blood pressure, enhance cardiovascular performance, and stimulate aldosterone synthesis. At the local level, ANG II exerts paracrine and/or autocrine regulation of glomerular hemodynamics, renal microcirculation, and tubular transport (15, 20, 29). Although the ability of the kidney to produce ANG II contributes to high intrarenal ANG II levels in normal and ANG II-induced hypertensive rats, the augmentation is also the result of the accumulation of circulating/extracellular ANG II via angiotensin type 1 (AT1) receptors. Both local synthesis and ANG II uptake account for the high ANG II environment in the kidney (13, 14, 22, 23, 27, 30).
Previous studies have shown that kidney cells take up circulating and locally produced ANG II, thereby accumulating ANG II in the interstitial and intracellular compartments (22, 23, 27, 30). Von Thun et al. (23) reported that hypertension induced by chronic infusion of ANG II augmented renal ANG II levels to a greater extent than could be explained by plasma renin or ANG II concentrations. Zou et al. (30) later showed that the renal accumulation of infused ANG II was AT1 receptor mediated. These findings were later supported by studies in pigs infused with 125I-labeled ANG II and in renal cortical endosomes of ANG II-infused hypertensive rats (22, 27). However, rodent kidneys express two isoforms of AT1 receptors, AT1a and AT1b, and pharmacological blockers cannot distinguish the relative contribution of AT1a vs. AT1b to this mechanism (7). Mutational studies using Chinese hamster ovary cells expressing either AT1a or AT1b showed that both receptors internalized after exposure to ANG II to similar efficiencies (5, 7). We have recently shown AT1 receptor (equivalent to rodent AT1a)-mediated endocytosis of extracellular ANG II in rabbit proximal tubule cells (13). It remains unclear how these mutational and cell biology studies apply to integrative renal physiology. Cervenka et al. (3) demonstrated that AT1a knockout mice subjected to acute volume expansion fail to alter intrarenal ANG II levels. In the present study, we used AT1a receptor-deficient mice to test the hypothesis that mice lacking the AT1a receptor are unable to accumulate ANG II intracellularly in the kidney in response to chronic ANG II infusion because of the absence of AT1a receptor-mediated endocytosis and a relatively smaller contribution of AT1b receptors after AT1a is deleted.
METHODS
Animals and genotyping
Adult male wild-type C57BL/6J (~25 g, 10 wk old; Agtr1a+/+) were purchased from Jackson Laboratories and maintained on a normal rodent chow and had free access to tap water. Upon arrival, mice were trained for 1 wk for measurement of systolic blood pressure via a computerized tail-cuff method (Visitech, Cary, NC). A breeding pair of heterozygous AT1a mice (Agtr1a+/−) was purchased from Jackson Laboratories, originally deposited by Dr. Oliver Smithies of the University of North Carolina (B6.129P2-Agtr1tm1Unc/J; see Refs. 17–19). Male heterozygous Agtr1a+/− and homozygous AT1a receptor knockout mice (Agtr1a−/−) were bred from this colony in our laboratory according to a standard protocol provided by the vendor (Stock no. 002682). All animal protocols were approved by the Institutional Animal Care and Use Committee of Henry Ford Health System. Genotyping of Agtr1a−/− mice was performed by PCR duplicate on tail DNA samples using Jackson Laboratories’ standard protocols (17–19). PCR primers for genotyping the AT1a receptor were purchased from Invitrogen, and their respective sequences are neo generic primers, which amplify a 280-bp DNA product from the bacterial neomycin resistance gene (oIMR0013: 5′-CTT ggg Tgg AgA ggC TAT TC-3′; oIMR0014: 5′-Agg TgA gAT gAC Agg AgA TC-3′), and Agtr1a wild-type primers, which together amplify a 483-bp DNA product from the wild-type allele (0IMR0738: 5′-TgA gAA CAC CAA TAT CAC Tg-3′: oIMR0739: 5′-TTC gTA gAC Agg CTT gAg-3′). Cycling conditions are set for denaturation at 94°C for 3 min, annealing at 55°C for 45 s, and extension at 72°C for 45 s over 35 cycles. Adult male Agtr1a+/− and Agtr1a−/− mice (~25 g, 10–12 wk old) were trained for blood pressure measurements and urine collection for determinations of urinary sodium and potassium excretion via a metabolic cage before commencing the infusion studies.
Long-term infusion of Val5-ANG II via osmotic minipump
After basal systolic pressures and 24-h urinary sodium and potassium excretion were measured from wild-type, Agtr1a+/−, and Agtr1a−/− mice, osmotic minipumps (model 2002; Alza) were implanted intraperitoneally for long-term infusion of Val5-ANG II as described previously (27, 30). Val5-ANG II was infused at 40 ng/min for 2 wk and the infusion rate was determined from preliminary studies in which systolic pressure was increased to ~160 mmHg (27). Three groups each of wild-type, Agtr1a+/−, and Agtr1a−/− mice (n = 6–10) were treated with: 1) vehicle as control; 2) ANG II; and 3) ANG II plus losartan (10 mg · kg−1 · day−1 po). Systolic blood pressure was measured weekly by the computerized tail-cuff methods (Visitech).
Measurements of plasma, whole kidney, and intracellular ANG II
Plasma and whole kidney ANG II levels were measured by a sensitive ANG II enzyme immunoassay as described previously (13, 29). At 2 wk of ANG II infusion, mice were decapitated without anesthesia to prevent anesthetic-induced ANG II formation, and trunk blood was collected in chilled tubes containing a mixed inhibitor cocktail (5 mM EDTA, 10 μM pepstatin A/o-phenanthroline, 10 μM captopril, 10 mg/ml bestatin, and 1 mg/ml aprotinin) for measurement of plasma ANG II as described previously (11, 13, 25). For measurement of whole kidney ANG II, one kidney from each mouse was sliced into two parts with one saved for ANG II receptor autoradiography (see below). The kidney tissues were weighed and homogenized in an ANG II extraction buffer containing 20 mM Tris base, 10 mM EDTA, 5 mM EGTA, 5 mM β-mercaptoethanol, 50 μg/ml phenylmethylsulfonyl fluoride, and 1 μg/ml aprotinin, as described previously (11, 23, 27). To exclude the confounding influence of high plasma or circulating ANG II levels on intrarenal or intracellular ANG II in Agtr1a−/− mice, one kidney from wild-type and Agtr1a−/− mice was perfusion-washed with 5 ml ice-cold acid buffer, which dissociates membrane receptor-bound ANG II from cells before the kidneys were processed for ANG II measurements (13). ANG II was extracted in a phenyl-bonded solid-phase peptide extraction column (Bond Elut-C18; Varian), vacuum-dried overnight, and reconstituted in ANG II assay buffer before ELISA of ANG II (13, 29).
Autoradiographic mapping of AT1a and AT1b receptors in the kidney
In addition to PCR genotyping as described above, ANG II receptor phenotypes in the kidneys of wild-type, Agtr1a+/−, and Agtr1a−/− mice were also mapped by quantitative in vitro autoradiography using either [125I]Val5-ANG II or [125I]Sar1,Ile8-ANG II, an analog antagonist, as we described previously (9, 26, 28). [125I]Sar1,Ile8-ANG II binds both AT1 and AT2 receptors. Additionally, in vitro autoradiography was also used to determine the long-term effects of ANG II infusion and losartan administration in the kidneys of wild-type and Agtr1a−/− mice because ANG II has been shown to downregulate AT1 receptor density in the rat kidney (7, 13, 26). Briefly, one-half of one kidney from each mouse was snap-frozen in isopentane on dry ice at the time of death. Frozen kidney sections, 20 μm thick, were cut on a cryostat and preincubated in a buffer containing 10 mM Na2HPO4, 150 mM NaCl, 5 mM Na2EDTA, and 0.02% NaN3 (pH 7.4) for 15 min to dissociate endogenous ANG II bound to the receptor. Sections were then incubated with the same fresh buffer containing 100 pmol of [125I]Sar1,Ile8-ANG II, 0.2% BSA, and 0.5 mg/ml bacitracin at 22°C for 60 min without (i.e., for total binding) or in the presence of an excess of unlabeled ANG II (1 μM for nonspecific binding), losartan (1 μM), or PD-123319 (1 μM) to compete for [125I]Sar1,Ile8-ANG II binding (9, 26, 28). Total AT1 receptors (AT1a and AT1b) were determined in the presence of an excess of AT2 receptor blocker PD-123319 (1 μM). Because losartan has similar affinity to AT1a and AT1b receptors, the AT1b receptor could not be determined in the kidneys of wild-type and Agtr1a+/− mice. By contrast, the AT1b receptor could be measured in the kidneys of Agtr1a−/− mice as total binding of [125I]Sar1,Ile8-ANG II because the AT1a receptor has been deleted and losartan completely displaced this binding. After incubations, kidney sections were washed, dried, and exposed to X-ray films for 3 days, and resultant autoradiographs were analyzed using computerized densitometry (MCID; Imaging Research, Ontario, Canada; see Refs. 9, 26, 28).
Measurement of urinary sodium and potassium excretion
To determine drinking and urinary excretory responses to long-term administration of ANG II or concurrent administration of ANG II and the AT1 blocker losartan, mice were housed individually in metabolic cages to ensure measurements of 24-h drinking and to collect urine samples as we described for rats (27). To minimize the effects of stress on these measurements, special care was taken to train each mouse individually in a mouse metabolic cage for 3 days before drinking, and urine collections were made. Twenty-four-hour drinking and urine output was measured gravimetrically, and plasma and urinary sodium and potassium concentrations were determined by flame photometry as previously described (27).
Statistical analysis
All data are presented as means ± SE. Differences in all parameters between groups of control, ANG II-infused, and ANG II plus losartan-treated in the same strains were analyzed using one-way ANOVA followed by Dunnett’s comparisons between group means if P < 0.05. The differences in the same parameter between wild-type, Agtr1a+/−, or Agtr1a−/− mice were compared using an unpaired t-test. The significance was set at P < 0.05.
RESULTS
AT1a and AT1b receptor genotyping and renal AT1 receptor mapping in wild-type, Agtr1a+/−, and Agtr1a−/− mice
The PCR products for genotyping three representative wild-type (C57BL/6J; Agtr1a+/+), heterozygous (Agtr1a+/−), or homozygous (Agtr1a−/−) mice are shown in Fig. 1. Wild-type mice yielded a single PCR product of 483 bp, whereas homozygous Agtr1a−/− mice produced a single PCR product of 280 bp. By contrast, heterozygous Agtr1a+/− mice had PCR products of both 483 and 280 bp (Fig. 1, top). The intrarenal localization and relative levels of total AT1 receptors (AT1a and AT1b) in wild-type and Agtr1a+/− mice and AT1b receptors in Agtr1a−/− mice are shown in autoradiographs (Fig. 1, bottom). In wild-type and Agtr1a+/− mice, AT1 receptors predominated in the outer cortex and the inner stripes of outer medulla, but wild-type kidneys had a much higher level of AT1 receptor binding than Agtr1a+/− mice (Fig. 1). However, the proportions of AT1a and AT1b receptors could not be determined by pharmacological means in these mice. In Agtr1a−/− mice, there was only a small proportion (~5–10%) of AT1 receptors that could be displaced by losartan, therefore representing AT1b receptors (Fig. 1). These data suggest that, in the mouse kidney, the majority of AT1 receptors belong to AT1a.
Fig. 1.
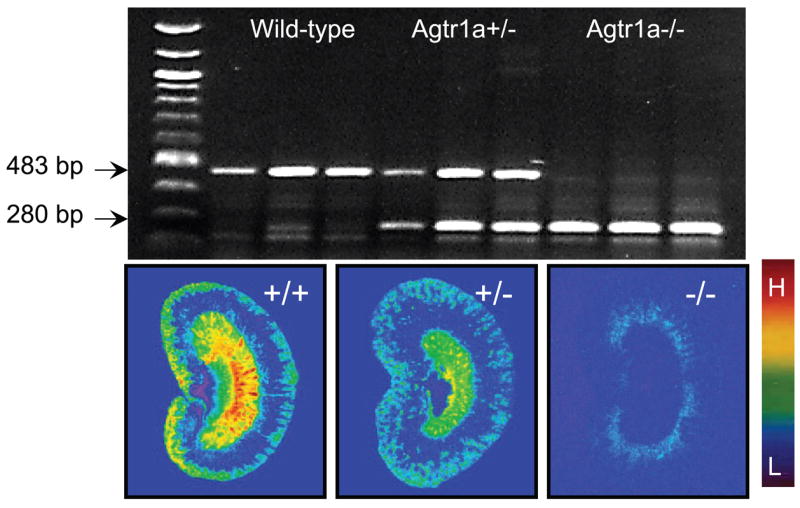
Representative PCR products for genotyping wild-type (Agtr1a+/+), heterozygous (Agtr1a+/−), and homozygous (Agtr1a−/−) mice on tail DNA samples (top) and autoradiographic mapping of angiotensin type 1 (AT1) receptors in the kidney using [125I]Val5-ANG II as the radioligand (bottom). The PCR product of 483 bp represents wild-type mice, whereas that of 280 bp shows homozygous Agtr1a−/− mice. Heterozygous Agtr1a+/− mice have both 483- and 280-bp PCR products. The relative levels of AT1 II receptor binding are shown with red representing the highest (H) and blue representing the background level of binding (L).
Basal systolic blood pressure and urinary excretory functions in wild-type, Agtr1a+/−, and Agtr1a−/− mice
Basal systolic blood pressure and renal excretory function in age- and body weight-matched wild-type, Agtr1a+/−, and Agtr1a−/− mice are summarized in Table 1. These functional measurements were made before long-term administration of ANG II to induce hypertension or losartan in wild-type and Agtr1a+/− mice. Although age and body weights were similar for all mice, the kidney weights and kidney weight-to-body weight ratios in Agtr1a−/− mice were 15% lower than wild-type or Agtr1a+/− mice (P < 0.01). Systolic blood pressure was ~24 ± 5 and 16 ± 3 mmHg lower in Agtr1a−/− mice than in wild-type or Agtr1a+/− mice, respectively (P < 0.01). Agtr1a−/− mice drank more water (171%, P < 0.01) and excreted more sodium (251%, P < 0.01) and potassium (245%, P < 0.01) during a 24-h period than wild-type mice (Table 1). Agtr1a+/− mice had basal systolic blood pressure, drinking, and urinary excretion rates of sodium and potassium between wild-type and AT1a receptor knockout mice (Table 1).
Table 1.
Basal systolic blood pressure and renal functional indexes in Agtr1a+/+, Agtr1a+/−, and Agtr1a−/− mice
| Parameters | Agtr1a+/+ | Agtr1a+/− | Agtr1a−/− |
|---|---|---|---|
| Body wt, g | 26.9±1 | 28.2±0.8 | 27.5±1.1 |
| Kidney wt, g | 0.32±0.02 | 0.34±0.01 | 0.27±0.02a |
| Kidney-to-body wt ratio, X100 | 1.2±0.03 | 1.2±0.01 | 1.0±0.04a |
| Drinking, ml/24 h | 4.2±0.2 | 4.9±0.4 | 7.2±0.8a |
| SBP, mmHg | 112±2 | 104±3a | 88±2a,c |
| UNaV, μmol/24 h | 133.0±7.1 | 156.4±8.5b | 334.7±7.8a,c |
| UKV, μmol/24 h | 257.8±22.5 | 313.6±23.3b | 648.8±8.5a,c |
Values are means ± SE. Agtr1a+/+, wild-type mice; Agtr1a+/−, heterozygous mice; Agtr1a−/−, homozygous mice; SBP, systolic blood pressure; UNaV, urinary sodium excretion; UKV, urinary potassium excretion.
P < 0.05 or
P < 0.01 vs. Agtr1a+/+; and
P < 0.01 vs. Agtr1a+/−.
Effects of long-term infusion of Val5-ANG II and administration of losartan on systolic blood pressure in wild-type, Agtr1a+/−, and Agtr1a−/− mice
Table 2 summarizes systolic blood pressure and drinking and renal excretory responses to ANG II infusion alone or concurrent administration of ANG II and losartan during the 1st wk in wild-type, Agtr1a+/−, and Agtr1a−/− mice. This represents the status of urinary sodium excretion during the early phase of development of hypertension in these mice. As expected, systolic blood pressure was markedly increased by ANG II infusion in both wild-type and Agtr1a+/− mice. With the exception that wild-type mice drank slightly more water and excreted less potassium during ANG II infusion, there were no significant differences in 24-h urinary sodium excretion (Table 2). Although losartan significantly attenuated the effect of ANG II on systolic blood pressure, it did not restore the pressure to basal levels at this stage. In Agtr1a−/− mice, ANG II also increased blood pressure moderately, but it did not significantly affect other functional indexes from their basal levels (Table 2). Concurrent administration of losartan did not alter these parameters either.
Table 2.
SBP, drinking and renal excretory responses to ANG II infusion alone or concurrent administration of ANG II and the AT1 receptor antagonist losartan during the 1st week in wild-type, Agtr1a+/−, and Agtr1a−/− mice
| Wild-type
|
Agtr1a+/−
|
Agtr1a−/−
|
|||||||
|---|---|---|---|---|---|---|---|---|---|
| Responses | C | ANG II | ANG II+L | C | ANG II | ANG II+L | C | ANG II | ANG II+L |
| SBP, mmHg | 113±4 | 153±7b | 132±4b,d | 104±3 | 145±4b | 135±2b,c | 89±5f | 99±4f | 95±3f |
| Drinking, ml/24 h | 2.6±0.3 | 4.3±0.6a | 2.9±0.2 | 5.2±0.2 | 5.5±0.4 | 4.4±0.4 | 9.3±0.7f | 8.0±0.8f | 7.6±0.5f |
| UNaV, μmol/24 h | 158±6.8 | 150±5.9 | 184±7.8 | 235±4.6 | 229±9.5 | 263±4.1 | 236±9.4f | 252±14f | 186±9.9 |
| UKV, μmol/24 h | 397±18.1 | 263±10.5a | 435±14.8a | 539±5.6 | 354±24.7b | 553±11.3d | 527±19.3e | 479±25f | 426±16.7 |
Results are expressed as means ± SE. C, control or basal; L, losartan. The differences in the same response between different groups for the same strain of mice were analyzed by one-way ANOVA:
P < 0.05 or
P < 0.01 vs. control;
P < 0.05 or
P < 0.01 vs. ANG II. The differences in the same response between wild-type or Agtr1a+/− and Agtr1a−/− mice were analyzed by unpaired t-test:
P < 0.05 or
P < 0.01 versus wild-type or Agtr1a+/− mice.
Figure 2 shows systolic blood pressure responses to ANG II infusion alone or concurrent administration of ANG II and losartan in wild-type, Agtr1a+/−, and Agtr1a−/− mice at the 2nd wk, when ANG II-induced hypertension was stabilized. Compared with the response at the 1st wk, blood pressure increased further to 168 ± 4 mmHg in wild-type (P < 0.01) and to 156 ± 4 mmHg in Agtr1a+/− mice (P < 0.01). By contrast, blood pressure was increased only to 101 ± 4 mmHg in Agtr1a−/− mice (P < 0.01). At this time point, concurrent administration of ANG II with losartan normalized blood pressure to control in wild type [118 ± 5 mmHg, not signifi-cant (NS) vs. control] and Agtr1a−/− mice (92 ± 4 mmHg, NS vs. control). Systolic blood pressure was reduced by losartan only by one-half in Agtr1a+/− mice (127 ± 4 mmHg, P < 0.01 vs. control or ANG II; Fig. 2).
Fig. 2.
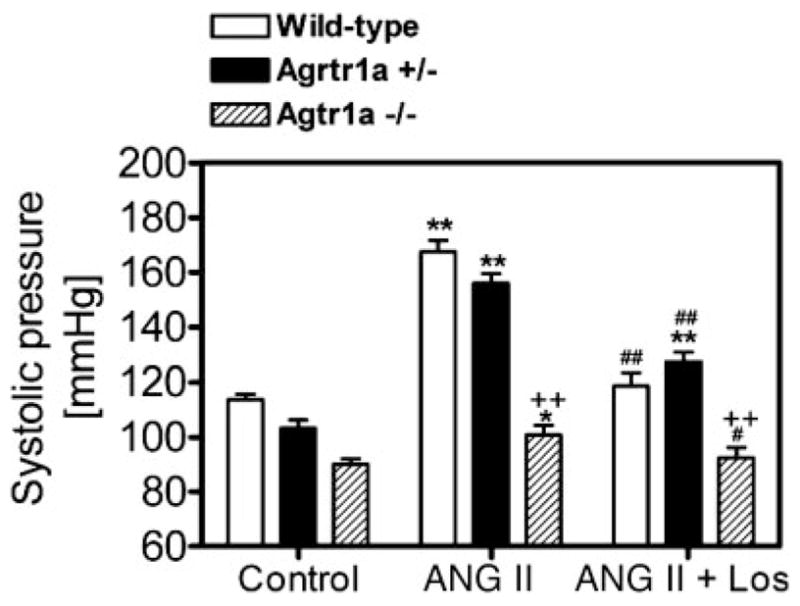
Systolic blood pressure responses to long-term administration of Val5-ANG II and/or losartan (Los) for 2 wk in wild-type, Agtr1a+/−, and Agtr1a−/− mice. *P < 0.05 and **P < 0.01 vs. their respective basal blood pressure. #P < 0.05 and ##P < 0.01 vs. ANG II in the same group. ++P < 0.01 vs. wild-type or Agtr1a+/− mice in response to the same treatment.
Effects of long-term infusion of Val5-ANG II on 24-h urinary sodium and potassium excretion in wild-type, Agtr1a+/−, and Agtr1a−/− mice
As shown in Fig. 3, long-term ANG II infusion induced pressure natriuresis in wild-type mice, increasing 24-h urinary sodium excretion by 53% (P < 0.01 Fig. 3, top). Concurrent administration of ANG II with losartan normalized urinary sodium excretion to control (NS vs. control), in association with normalization of systolic pressure by losartan in these mice (Fig. 2). By comparison, there were no significant differences in 24-h urinary sodium excretion in Agtr1a−/− mice (Fig. 3, top). In Agtr1a+/− mice, 24-h urinary sodium excretion rate was higher than in wild-type mice under basal conditions and during concurrent administration of ANG II and losartan, but the response was not different from those of wild-type or Agtr1a−/− mice during ANG II infusion (Fig. 3, top). There were no significant differences in 24-h urinary potassium excretion rates among the different groups within wild-type, Agtr1a+/−, and Agtr1a−/− mice (ANOVA). However, 24-h urinary potassium excretion was significantly higher in Agtr1a−/− mice than in wild-type mice (Fig. 3, bottom).
Fig. 3.
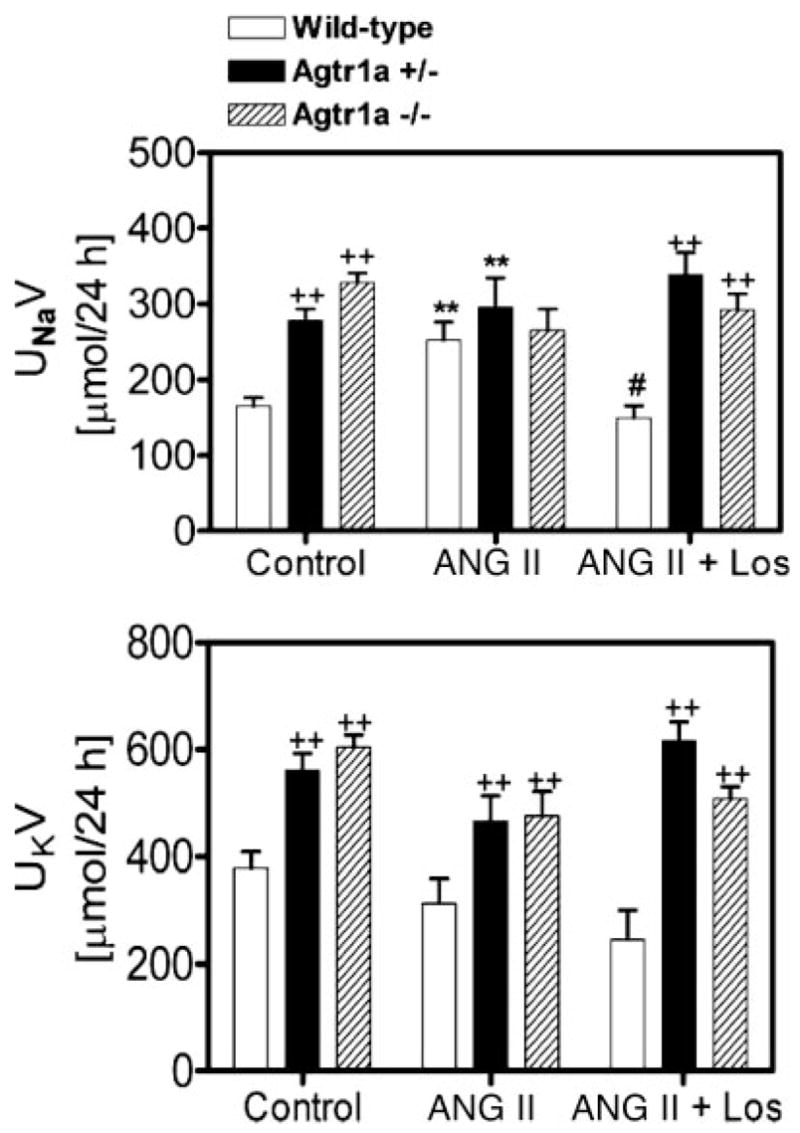
Twenty-four-hour urinary sodium (UNaV) and potassium (UKV) excretory responses to long-term administration of ANG II and/or losartan for 2 wk in wild-type, Agtr1a+/−, and Agtr1a−/− mice. **P < 0.01 vs. respective controls in the same group. #P < 0.05 vs. ANG II in the same group. ++P < 0.01 vs. wild-type or Agtr1a+/− mice in response to the same treatment.
Effect of long-term infusion of Val5-ANG II on the kidney-to-body weight ratio in wild-type, Agtr1a+/−, and Agtr1a−/− mice
Long-term infusion of ANG II for 2 wk induced renal hypertrophy in wild-type and Agtr1a+/− mice, as reflected by increases in the kidney-to-body weight ratio (Fig. 4). However, losartan did not normalize the renal hypertrophic response to ANG II to control. In Agtr1a−/− mice, there were no significant differences in the kidney-to-body weight ratio between control and ANG II- or losartan-treated groups (Fig. 4).
Fig. 4.
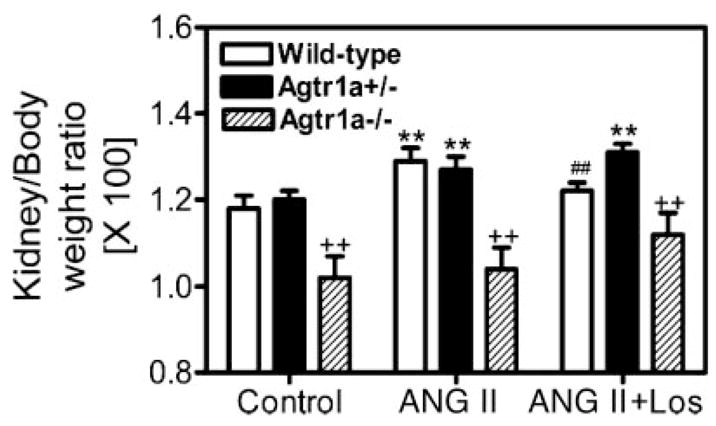
Renal hypertrophic responses to long-term administration of ANG II or concurrent administration of ANG II and losartan for 2 wk in wild-type, Agtr1a+/−, and Agtr1a−/− mice. **P < 0.01 vs. respective controls in the same group. ##P < 0.01 vs. ANG II in the same group. ++P < 0.01 vs. wild-type or Agtr1a+/− mice in response to the same treatment.
Effect of long-term infusion of Val5-ANG II on plasma and kidney ANG II levels in wild-type, Agtr1a+/−, and Agtr1a−/− mice
Figure 5, top, shows that plasma ANG II levels were markedly increased from 104.6 ± 12.6 to 183.8 ± 40.4 fmol/ml by long-term infusion of ANG II in wild-type mice (P < 0.01). Concurrent administration of ANG II with losartan increased plasma ANG II levels further to 223.8 ± 21.3 fmol/ml (P < 0.01 vs. control). In Agtr1a−/− mice, basal plasma ANG II levels were 3.6-fold higher than those of wild-type mice (377 ± 66 fmol/ml, P < 0.01). ANG II infusion or concurrent administration with losartan increased plasma ANG II levels further (ANG II: 566.2 ± 114 fmol/ml, P < 0.05 vs. control; ANG II + losartan: 834.1 ± 55.9 fmol/ml, P < 0.05 vs. ANG II). In Agtr1a+/− mice, plasma ANG II levels were at levels between those of wild-type and Agtr1a−/− mice for their corresponding groups (Fig. 5, top). The whole kidney ANG II levels in wild-type, Agtr1a+/−, and Agtr1a−/− mice at basal conditions and in response to ANG II infusion or concurrent administration with losartan are shown in Fig. 5, bottom. Basal whole kidney ANG II levels were threefold higher in Agtr1a−/− mice [573.2 ± 80.2 pg/100 mg kidney weight (KW)] than wild-type mice (184.60 ± 110 pg/100 mg KW; P < 0.01), which was not significantly different from plasma ANG II levels. In wild-type mice, ANG II infusion markedly increased whole kidney ANG II levels to 509.3 ± 49.7 pg/100 mg KW (P < 0.01), which was reduced to 298.9 ± 58.4 pg/100 mg KW by losartan (P < 0.01). By comparison, there were no significant differences between control and ANG II-treated groups in whole kidney ANG II levels in Agtr1a−/− mice (Fig. 5, bottom). However, losartan decreased whole kidney ANG II levels by ~20% to a level significantly different from the ANG II-treated group in Agtr1a−/− mice (ANG II: 602.1 ± 30.8 pg/100 mg KW; ANG II + losartan: 406.1 ± 83.8 pg/100 mg KW; P < 0.05). The responses of renal ANG II levels to ANG II or losartan in Agtr1a+/− mice were not significantly different from those of wild types (Fig. 5, bottom).
Fig. 5.
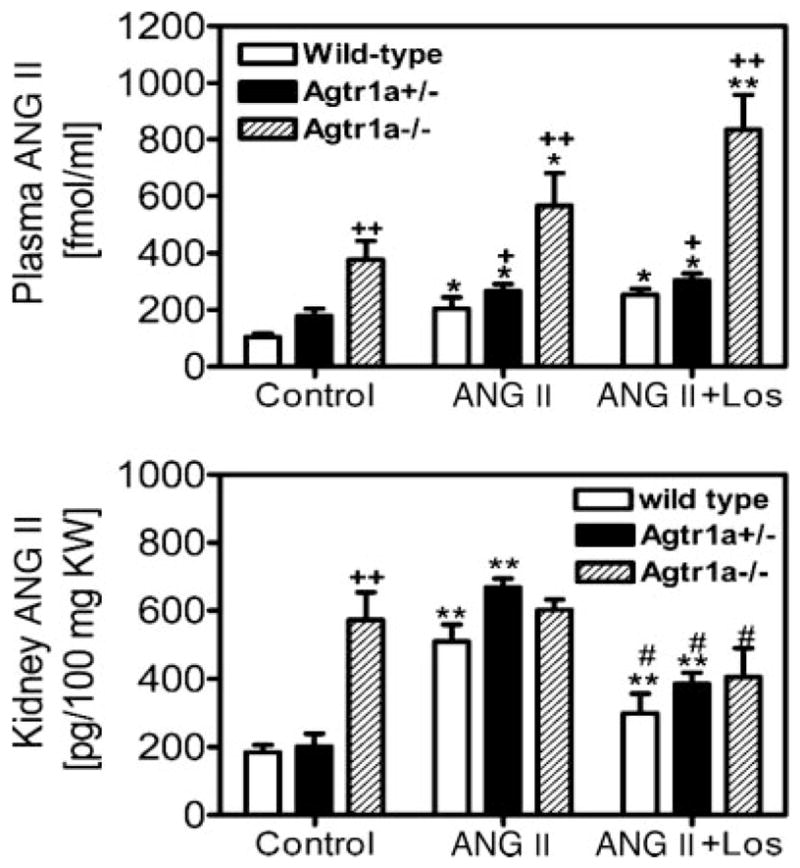
Circulating and whole kidney ANG II levels in response to long-term administration of ANG II or concurrent administration with losartan for 2 wk in wild-type, Agtr1a+/−, and Agtr1a−/− mice. *P < 0.05 and **P < 0.01 vs. respective controls in the same group. #P < 0.05 vs. ANG II in the same group. +P < 0.05 and ++P < 0.01 vs. wild-type or Agtr1a+/− mice in response to the same treatment.
Effect of long-term infusion of Val5-ANG II on intracellular ANG II levels in the kidneys of wild-type and Agtr1a−/− mice
To exclude the influence of high plasma or extracellular ANG II levels on whole kidney ANG II levels in Agtr1a−/− mice, the kidneys from wild-type and Agtr1a−/− mice treated without (control) or with ANG II or concurrent administration of ANG II and losartan (n = 6) were first perfusion washed with 5 ml ice-cold acid buffer, which clears membrane receptor-bound extracellular ANG II from cells before the kidneys were removed and processed for ANG II measurements. Figure 6 shows that intracellular ANG II levels in the kidneys of Agtr1a−/− mice were significantly lower than those of wild-type mice under basal conditions (wild type: 90.7 ± 7.4 pg/100 mg KW vs. Agtr1a−/−: 59.2 ± 14.8 pg/100 mg KW, P < 0.01), during ANG II infusion (wild type: 172 ± 25 pg/100 mg KW vs. Agtr1a−/−: 68 ± 12 pg/100 mg KW, P < 0.01), and during concurrent administration of ANG II and losartan (wild type: 110.7 ± 15.6 pg/100 mg KW vs. Agtr1a−/−: 62.3 ± 8.9 pg/100 mg KW, P < 0.01).
Fig. 6.
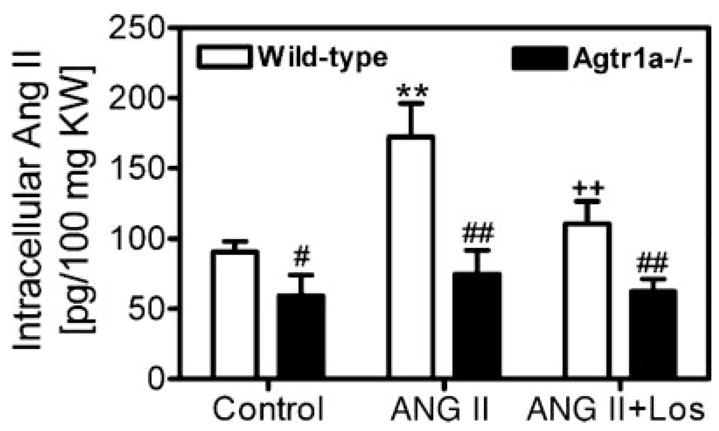
Renal intracellular ANG II levels in response to long-term ANG II infusion or concurrent administration of ANG II and losartan for 2 wk in wild-type and Agtr1a−/− mice. **P < 0.001 vs. control. ++P < 0.01 vs. ANG II infusion in wild-type mice. #P < 0.05 and ##P < 0.01 vs. corresponding wild-type mice.
Effects of long-term ANG II infusion or concurrent administration of ANG II and losartan on renal AT1 receptor binding in wild-type and Agtr1a−/− mice
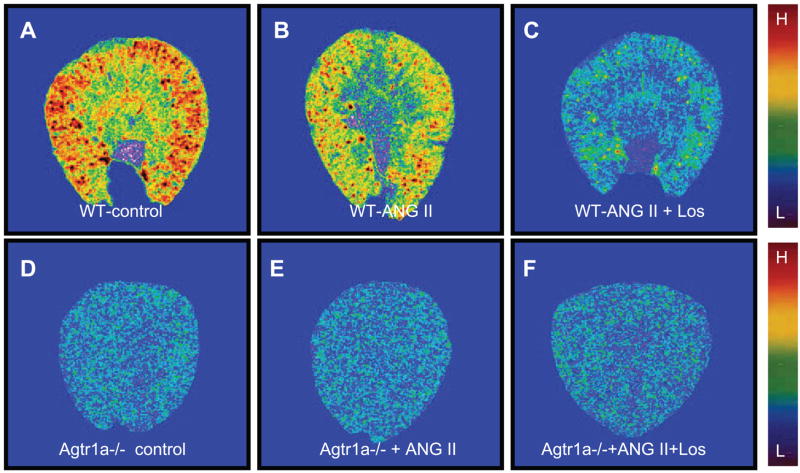
AT1 receptors are known to be downregulated by ANG II in vascular smooth muscle cells and in the kidney in acute experiments, but long-term effects of ANG II and losartan on AT1 receptors have not been well studied in mice. Figure 7 shows in vitro autoradiographic mapping of AT1 receptors in wild-type and Agtr1a−/− mice using [125I]Sar1,Ile8-ANG II, and the quantitative results are shown in Fig. 8. In wild-type mice, long-term ANG II administration decreased AT1 receptor binding by ~33% [control: 1,056 ± 14 disintegrations · min−1 (dpm) · mm−2 vs. ANG II treated: 709 ± 32 dpm/mm2, P < 0.01], and concurrent administration of losartan for 2 wk reduced the binding to ~16% of control (169 ± 33 dpm/mm2; Fig. 8, top). In Agtr1a−/− mice, basal AT1 receptor binding (representing AT1b) was 45 ± 6 dpm/mm2, but ANG II had no significant effects on this binding (33 ± 8 dpm/mm2, NS). By contrast, losartan reduced the remaining AT1 binding in the kidney of Agtr1a−/− mice significantly (25 ± 6 dpm/mm2, P < 0.01 vs. basal; Fig. 8, top). However, there were no significant differences in binding dissociation constant (Kd) between control and ANG II-infused wild-type mice (Fig. 8, bottom).
Fig. 7.
Quantitative in vitro autoradiographic mapping of AT1 receptors in the kidneys of wild-type and Agtr1a−/− mice treated without (control) or with ANG II or with concurrent administration of ANG II and losartan for 2 wk. The levels of AT1 receptor binding in the kidney are shown with red representing the highest and blue representing the background level of binding.
Fig. 8.
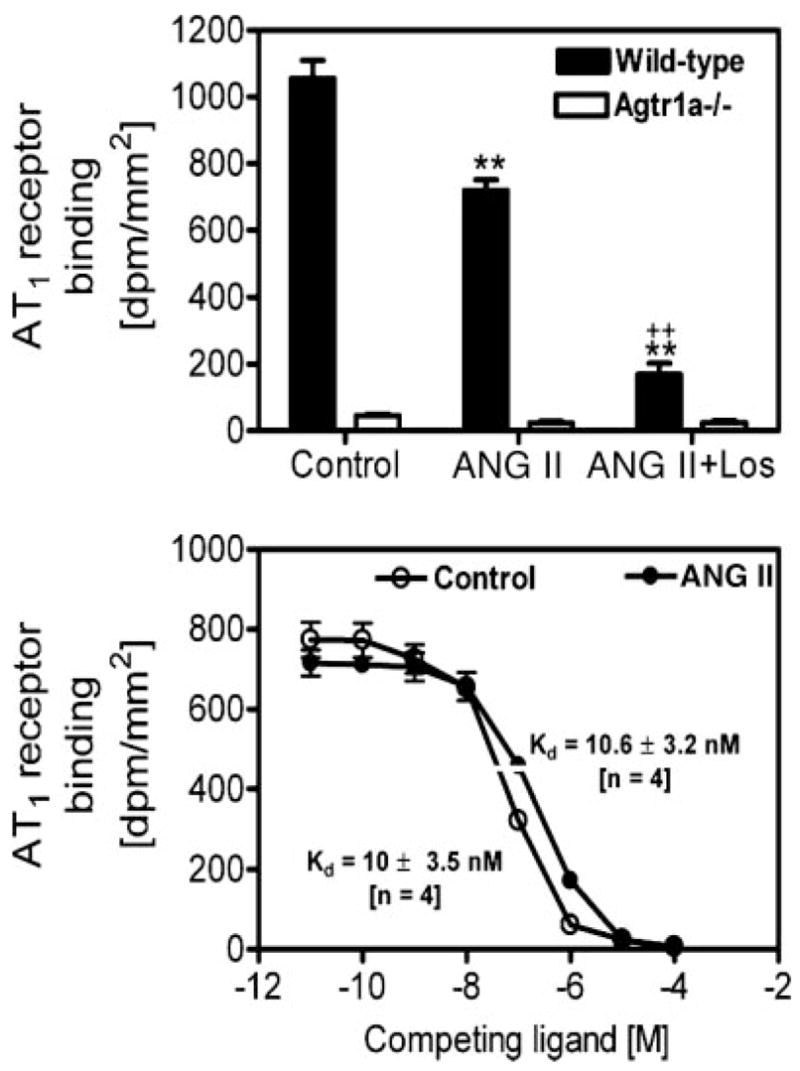
Quantitative results showing the effects of long-term administration of ANG II and/or losartan on the levels of AT1 receptor binding in the kidneys of wild-type and Agtr1a−/− mice, or on the binding dissociation constant (Kd) in wild-type mice treated without (control) or with ANG II for 2 wk. **P < 0.01 vs. control. ++P < 0.01 vs. ANG II in the kidneys of wild-type mice.
DISCUSSION
Although renal histological and functional phenotypes of Agtr1a−/− mice have been studied extensively since it was first reported in 1995 (12), most previous studies had focused on the role of AT1a receptors in mediating acute systemic or intrarenal arteriolar pressor responses to ANG II (9, 12, 17) and the regulation of acute tubuloglomerular feedback responses (10, 20). However, blood pressure and renal excretory responses to long-term ANG II administration have not been examined, nor has the role of AT1a receptors in mediating uptake or accumulation of ANG II in the kidney been studied previously in Agtr1a−/− mice.
The present study demonstrates several key findings. The Agtr1a−/− mice exhibited much lower systolic blood pressure as expected (Fig. 2 and Ref. 12), expressed only a small fraction (5–10%) of AT1b receptors in the kidney (Figs. 1 and 6), had a smaller kidney-to-body weight ratio despite similar body weights (Fig. 4), and drank more water and had higher urinary sodium excretion rates (Tables 1 and 2 and Fig. 3) compared with wild-type and heterozygous Agtr1a+/− mice. Second, long-term ANG II infusion raised blood pressure, induced renal hypertrophy, and increased 24-h urinary sodium excretion in wild-type mice. Concurrent administration of losartan significantly attenuated the responses to ANG II in wild-type mice. Third, long-term ANG II infusion increased systolic blood pressure to a much lesser extent in Agtr1a−/− than in wide-type mice but had no effect on the kidney-to-body weight ratio and 24-h urinary sodium excretion rates. Interestingly, concurrent administration of losartan with ANG II restored systolic pressure to basal levels in Agtr1a−/− mice (Fig. 2). Fourth, Agtr1a−/− mice had markedly elevated basal plasma and whole kidney ANG II levels, but their intracellular ANG II levels were lower than wild-type mice (Fig. 6). Finally, comparison of systemic and renal effects of losartan in ANG II-treated wild-type and Agtr1a−/− mice suggests a relatively minor role for the remaining AT1b receptors in blood pressure and renal regulation in the absence of AT1a receptors. Overall, these results confirm a predominant role of AT1a receptors in the regulation of blood pressure and renal excretory responses to ANG II and intracellular ANG II accumulation during ANG II-induced hypertension.
Previous studies have shown that, in the absence of AT1a receptors, AT1b receptors may assume the role of AT1a receptors to compensate for the loss of predominant AT1a influence (4, 9, 17, 24). Oliverio et al. (17) reported that acute bolus injections of ANG II increased blood pressure by an average of 10 mmHg in Agtr1a−/− mice, and this pressor effect was completely inhibited by AT1 receptor blockers, therefore suggesting a role for AT1b receptors in blood pressure control in the absence of AT1a receptors. However, Chen et al. (4) showed that targeting deletion of AT1b receptors did not alter renal morphology, blood pressure, and aldosterone responses to low or high salt, nor in AT1a receptor mRNA expression in Agtr1b−/− mice. The findings of the latter study are unexpected because targeting deletion of AT1a receptors had no appreciable effects on renal growth or histology (12, 18), but double deletion of AT1a and AT1b led to typical pathological phenotypes similar to those in ACE knockout or angiotensinogen knockout mice (19, 21). In the present study, we focused on a possible compensatory role of AT1b receptors in blood pressure and renal hypertrophic and excretory responses to long-term ANG II administration. We found that ANG II infusion for 2 wk increased blood pressure significantly from ~90 to 101 mmHg in Agtr1a−/− mice compared with an ~55-mmHg increase in wild-type mice. Because losartan completely blocked this pressor response in Agtr1a−/− mice, AT1b receptors may have mediated this response, as suggested by Oliverio et al. (17). However, we found no significant role of AT1b receptors in mediating renal hypertrophic or urinary sodium excretory responses to long-term ANG II administration in Agtr1a−/− mice. There were also no differences in 24-h urinary excretion of sodium and potassium in Agtr1a−/− mice between basal, ANG II infusion, and concurrent administration of losartan (Table 2 and Fig. 3). These findings may not be surprising given that AT1b receptors account for only 5–10% of total AT1 receptors in the mouse kidney, as determined by quantitative in vitro autoradiography (Figs. 1, 7, and 8). Our study suggests that AT1a receptors play the overwhelming role in mediating blood pressure and renal hypertrophic and urinary excretory responses to long-term ANG II infusion and that AT1b receptors may not exert a perceptible role in the regulation of renal growth and urinary excretory responses in Agtr1a−/− mice.
AT1 receptor-mediated endocytosis of extracellular ANG II plays an important role in regulating intracellular signaling in many target cells (7, 13, 29). This process also contributes to accumulation of high levels of ANG II in the rat kidney and in cultured proximal tubule cells (13, 22, 23, 27, 30). However, because the rodent kidney expresses two AT1 receptors, AT1a and AT1b, and both receptors internalize upon exposure to ANG II (5), the conventional view is that both receptors mediate ANG II endocytosis and therefore may contribute to maintaining high intrarenal ANG II levels. In the current study, we demonstrated that infusion of ANG II for 2 wk increased whole kidney ANG II levels more than threefold in wild-type mice. This response was substantially attenuated by AT1 receptor blockade, confirming the essential role of AT1 receptor-mediated mechanisms in mice (22, 27, 30). Because losartan also reduced whole kidney ANG II levels in ANG II-infused Agtr1a−/− mice, AT1b receptors may play a limited role in AT1 receptor-mediated ANG II endocytosis and accumulation in the mouse kidney (Fig. 5).
The finding that Agtr1a−/− mice had higher basal whole kidney ANG II levels than wild-type mice requires an explanation. High circulating ANG II levels in Agtr1a−/− mice are expected (Fig. 5) because the AT1a receptor predominates in most cardiovascular and renal tissues (7), and its deletion would lead to increased unbound ANG II in the circulation and extracellular fluid compartments. Higher plasma ANG II levels have been reported in rats or humans treated with AT1 receptor blockers (2, 27). However, the high whole kidney ANG II level in Agtr1a−/− mice under basal conditions was unexpected because it has been shown that AT1 receptors mediate intrarenal accumulation of ANG II in rats and pigs (22, 23, 27, 30). Moreover, lower renal ANG II levels have been reported in anesthetized, acutely volume-expanded Agtr1a−/− mice (3). There are several explanations for these differences. Oliverio et al. (17) have shown that renin mRNA expression was three times higher in Agtr1a−/− than wild-type mice. This suggests that ANG II may be continuously produced and released because of the lack of AT1 receptor-mediated negative feed-back regulation of renin. Second, markedly increased whole kidney ANG II levels have been reported in AT1a/AT1b receptor double-knockout mice (16, 21). Third, although AT1a receptor-mediated endocytosis of extracellular ANG II is the predominant mechanism responsible for ANG II uptake in the kidney of wild-type mice, AT1b receptors may partly assume this role after the AT1a receptor is deleted (Fig. 5). Furthermore, Gonzalez-Villalobos et al. (8) recently reported that the protein megalin also mediates endocytosis of ANG II in a proximal tubule epithelial cell line. Finally, high whole kidney ANG II levels in Agtr1a−/− mice may simply reflect the high plasma and extracellular fluid levels. This may mask the differences in ANG II levels existing between extracellular and intracellular fluid compartments. To exclude the influence of high plasma/extracellular ANG II on intrarenal ANG II levels, we perfusion washed the kidneys with an acid buffer to dissociate ANG II bound to membrane receptors before harvesting and processing the samples. Under this condition, we found intracellular ANG II levels were indeed lower in Agtr1a−/− mice than in wild-type mice under basal conditions, during ANG II infusion, or concurrent administration with losartan (Fig. 6). These results suggest that lower intracellular ANG II levels in Agtr1a−/− mice are likely because of the lack of AT1a receptor-mediated endocytosis.
In summary, we demonstrate that Agtr1a−/− mice had markedly lower basal blood pressure, smaller kidney-to-body weight ratios, higher circulating and whole kidney ANG II levels, drank more water, and excreted more urinary sodium and potassium. By contrast, the intracellular ANG II level in the kidney was much lower in Agtr1a−/− mice because of the absence of AT1 receptor-mediated endocytosis. This suggests that AT1a receptors play a dominant role in blood pressure regulation and renal hypertrophic and excretory functional responses to long-term ANG II stimulation and receptor-mediated ANG II accumulation in the kidney. By contrast, AT1b receptors only play a limited role when the AT1a receptor is deleted because of its low levels of expression in the kidney. Because the AT1a receptor in rodents is equivalent to human AT1 receptors, our study helps to elucidate the mechanisms by which ANG II receptor blockers exert beneficial effects in treating hypertension and preventing target organ damage in humans.
Acknowledgments
The results of this work were presented at the 60th Annual Fall Conference and Scientific Session of the Council for High Blood Pressure Research in association with the Council for Kidney in Cardiovascular Diseases, American Heart Association, San Antonio, TX, October 4–7, 2006.
GRANTS
This work was supported by National Institutes of Health (NIH) Grant 5RO1DK-067299 and American Heart Association Greater Midwest Affiliate Grant-in-Aid 0355551Z to J. L. Zhuo. L. G. Navar was supported by NIH Grant HL-26371.
References
- 1.Campbell DJ. Circulating and tissue angiotensin systems. J Clin Invest. 1987;79:1–6. doi: 10.1172/JCI112768. [DOI] [PMC free article] [PubMed] [Google Scholar]
- 2.Campbell DJ, Krum H, Esler MD. Losartan increases bradykinin levels in hypertensive humans. Circulation. 2005;111:315–320. doi: 10.1161/01.CIR.0000153269.07762.3B. [DOI] [PubMed] [Google Scholar]
- 3.Cervenka L, Mitchell KD, Oliverio MI, Coffman TM, Navar LG. Renal function in the AT1A receptor knockout mouse during normal and volume-expanded conditions. Kidney Int. 1999;56:1855–1862. doi: 10.1046/j.1523-1755.1999.00757.x. [DOI] [PubMed] [Google Scholar]
- 4.Chen X, Li W, Yoshida H, Tsuchida S, Nishimura H, Takemoto F, Okubo S, Fogo A, Matsusaka T, Ichikawa I. Targeting deletion of angiotensin type 1B receptor gene in the mouse. Am J Physiol Renal Physiol. 1997;272:F299–F304. doi: 10.1152/ajprenal.1997.272.3.F299. [DOI] [PubMed] [Google Scholar]
- 5.Conchon S, Monnot C, Teutsch B, Corvol P, Clauser E. Internalization of the rat AT1a and AT1b receptors: pharmacological and functional requirements. FEBS Lett. 1994;349:365–370. doi: 10.1016/0014-5793(94)00703-9. [DOI] [PubMed] [Google Scholar]
- 6.Davis JO, Freeman RH. Mechanisms regulating renin release. Physiol Rev. 1976;56:1–56. doi: 10.1152/physrev.1976.56.1.1. [DOI] [PubMed] [Google Scholar]
- 7.de Gasparo M, Catt KJ, Inagami T, Wright JW, Unger T. International union of pharmacology. XXIII. The angiotensin II receptors. Pharmacol Rev. 2000;52:415–472. [PubMed] [Google Scholar]
- 8.Gonzalez-Villalobos R, Klassen RB, Allen PL, Navar LG, Hammond TG. Megalin binds and internalizes angiotensin II. Am J Physiol Renal Physiol. 2005;288:F420–F427. doi: 10.1152/ajprenal.00243.2004. [DOI] [PubMed] [Google Scholar]
- 9.Harrison-Bernard LM, Monjure CJ, Bivona BJ. Efferent arterioles exclusively express the subtype 1A angiotensin receptor: functional insights from genetic mouse models. Am J Physiol Renal Physiol. 2006;290:F1177–F1186. doi: 10.1152/ajprenal.00265.2005. [DOI] [PubMed] [Google Scholar]
- 10.Ichihara A, Hayashi M, Koura Y, Tada Y, Sugaya T, Hirota N, Saruta T. Blunted tubuloglomerular feedback by absence of angiotensin type 1A receptor involves neuronal NOS. Hypertension. 2002;40:934–939. doi: 10.1161/01.hyp.0000041220.88322.6d. [DOI] [PubMed] [Google Scholar]
- 11.Imig JD, Navar GL, Zou LX, O’Reilly KC, Allen PL, Kaysen JH, Hammond TG, Navar LG. Renal endosomes contain angiotensin peptides, converting enzyme, and AT1A receptors. Am J Physiol Renal Physiol. 1999;277:F303–F311. doi: 10.1152/ajprenal.1999.277.2.F303. [DOI] [PubMed] [Google Scholar]
- 12.Ito M, Oliverio MI, Mannon PJ, Best CF, Maeda N, Smithies O, Coffman TM. Regulation of blood pressure by the type 1A angiotensin II receptor gene. Proc Natl Acad Sci USA. 1995;92:3521–3525. doi: 10.1073/pnas.92.8.3521. [DOI] [PMC free article] [PubMed] [Google Scholar]
- 13.Li XC, Carretero OA, Navar LG, Zhuo JL. AT1 receptor-mediated accumulation of extracellular angiotensin II in proximal tubule cells: role of cytoskeleton microtubules and tyrosine phosphatases. Am J Physiol Renal Physiol. 2006;291:F375–F383. doi: 10.1152/ajprenal.00405.2005. [DOI] [PMC free article] [PubMed] [Google Scholar]
- 14.Navar LG, Imig JD, Zou L, Wang CT. Intrarenal production of angiotensin II. Semin Nephrol. 1997;17:412–422. [PubMed] [Google Scholar]
- 15.Navar LG, Inscho EW, Majid SA, Imig JD, Harrison-Bernard LM, Mitchell KD. Paracrine regulation of the renal microcirculation. Physiol Rev. 1996;76:425–536. doi: 10.1152/physrev.1996.76.2.425. [DOI] [PubMed] [Google Scholar]
- 16.Nishimura H, Matsusaka T, Fogo A, Kon V, Ichikawa I. A novel in vivo mechanism for angiotensin type 1 receptor regulation. Kidney Int. 1997;52:345–355. doi: 10.1038/ki.1997.340. [DOI] [PubMed] [Google Scholar]
- 17.Oliverio MI, Best CF, Kim HS, Arendshorst WJ, Smithies O, Coffman TM. Angiotensin II responses in AT1A receptor-deficient mice: a role for AT1B receptors in blood pressure regulation. Am J Physiol Renal Physiol. 1997;272:F515–F520. doi: 10.1152/ajprenal.1997.272.4.F515. [DOI] [PubMed] [Google Scholar]
- 18.Oliverio MI, Madsen K, Best CF, Ito M, Maeda N, Smithies O, Coffman TM. Renal growth and development in mice lacking AT1A receptors for angiotensin II. Am J Physiol Renal Physiol. 1998;274:F43–F50. doi: 10.1152/ajprenal.1998.274.1.F43. [DOI] [PubMed] [Google Scholar]
- 19.Oliverio MI, Kim HS, Ito M, Le T, Audoly L, Best CF, Hiller S, Kluckman K, Maeda N, Smithies O, Coffman TM. Reduced growth, abnormal kidney structure, and type 2 (AT2) angiotensin receptor-mediated blood pressure regulation in mice lacking both AT1A and AT1B receptors for angiotensin II. Proc Natl Acad Sci USA. 1998;95:15496–15501. doi: 10.1073/pnas.95.26.15496. [DOI] [PMC free article] [PubMed] [Google Scholar]
- 20.Schnermann JB, Traynor T, Yang T, Huang YG, Oliverio MI, Coffman T, Briggs JP. Absence of tubuloglomerular feedback responses in AT1A receptor-deficient mice. Am J Physiol Renal Physiol. 1997;273:F315–F320. doi: 10.1152/ajprenal.1997.273.2.F315. [DOI] [PubMed] [Google Scholar]
- 21.Tsuchida S, Matsusaka T, Chen X, Okubo S, Niimura F, Nishimura H, Fogo A, Utsunomiya H, Inagami T, Ichikawa I. Murine double nullizygotes of the angiotensin type 1A and 1B receptor genes duplicate severe abnormal phenotypes of angiotensinogen nullizygotes. J Clin Invest. 1998;101:755–760. doi: 10.1172/JCI1899. [DOI] [PMC free article] [PubMed] [Google Scholar]
- 22.van Kats JP, Schalekamp MA, Verdouw PD, Duncker DJ, Danser AH. Intrarenal angiotensin II: interstitial and cellular levels and site of production. Kidney Int. 2001;60:2311–2317. doi: 10.1046/j.1523-1755.2001.00049.x. [DOI] [PubMed] [Google Scholar]
- 23.von Thun AM, Vari RC, El Dahr SS, Navar LG. Augmentation of intrarenal angiotensin II levels by chronic angiotensin II infusion. Am J Physiol Renal Fluid Electrolyte Physiol. 1994;266:F120–F128. doi: 10.1152/ajprenal.1994.266.1.F120. [DOI] [PubMed] [Google Scholar]
- 24.Zhu Z, Zhang SH, Wagner C, Kurtz A, Maeda N, Coffman T, Arendshorst WJ. Angiotensin AT1B receptor mediates calcium signaling in vascular smooth muscle cells of AT1A receptor-deficient mice. Hypertension. 1998;31:1171–1177. doi: 10.1161/01.hyp.31.5.1171. [DOI] [PubMed] [Google Scholar]
- 25.Zhuo JL, Anderson WP, Song K, Mendelsohn FAO. Autoradiographic localization of active renin in the juxtaglomerular apparatus of the dog kidney: effects of sodium intake. Clin Exp Pharmacol Physiol. 1996;23:291–298. doi: 10.1111/j.1440-1681.1996.tb02826.x. [DOI] [PubMed] [Google Scholar]
- 26.Zhuo JL, Alcorn D, Harris PJ, Mendelsohn FAO. Localization and properties of angiotensin II receptors in the kidney. Kidney Int. 1993;44:S40–S46. [PubMed] [Google Scholar]
- 27.Zhuo JL, Imig JD, Hammond TG, Orengo S, Benes E, Navar LG. Ang II accumulation in rat renal endosomes during Ang II-induced hypertension: role of AT1 receptor. Hypertension. 2002;39:116–121. doi: 10.1161/hy0102.100780. [DOI] [PubMed] [Google Scholar]
- 28.Zhuo JL, Alcorn D, Allen AM, Mendelsohn FA. High resolution localization of angiotensin II receptors in rat renal medulla. Kidney Int. 1992;42:1372–1380. doi: 10.1038/ki.1992.429. [DOI] [PubMed] [Google Scholar]
- 29.Zhuo JL, Li XC, Garvin JL, Navar LG, Carretero OA. Intracellular angiotensin II induces cytosolic Ca2+ mobilization by stimulating intracellular AT1 receptors in proximal tubule cells. Am J Physiol Renal Physiol. 2006;290:F1382–F1390. doi: 10.1152/ajprenal.00269.2005. [DOI] [PMC free article] [PubMed] [Google Scholar]
- 30.Zou LX, Imig JD, Hymel A, Navar LG. Renal uptake of circulating angiotensin II in Val5-angiotensin II infused rats is mediated by AT1 receptor. Am J Hypertens. 1998;11:570–578. doi: 10.1016/s0895-7061(97)00410-x. [DOI] [PubMed] [Google Scholar]


