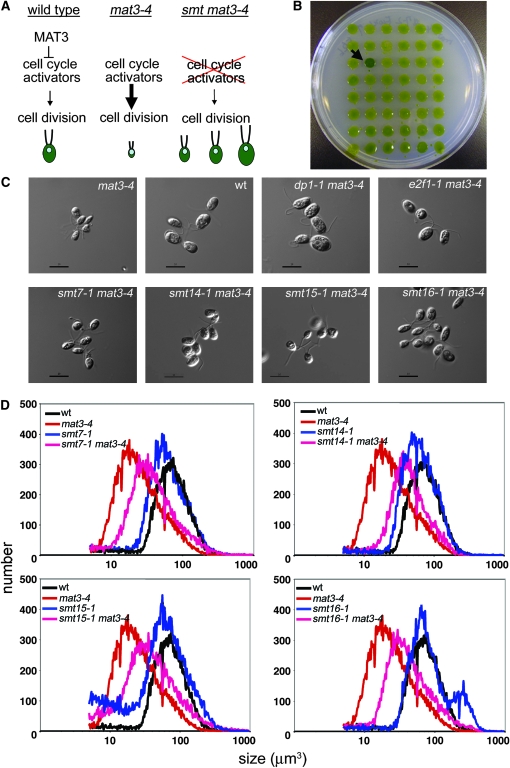
Figure 2.—
Suppressors of mat3-4. (A) Conceptual representation of a suppressor screen. (B) Agar plate showing the color-based isolation of mat3-4 suppressors. The arrow points to a suppressor strain. (C) Nomarski images of daughter cells from the indicated strains. Bar, 10 μm. (D) Cell-size distributions of dark-shifted cultures from the indicated strains. The smaller peak in the smt16-1 sample to the right of the main peak represents unhatched daughters that remained in the mother cell wall after division.

