

Abstract
Background
Much of the information on the physiologic effects, mechanisms of gas exchange, and potential utility of high-frequency oscillation (HFO) has been acquired in animal studies. Specifically, large animal data have been useful in assessing adult application because large animals present many of the same concerns and challenges as adults.
Objective
To review the literature on HFO testing in large animal models, identifying contributions to the understanding of mechanisms of action and the physiology of HFO.
Results
Large animal studies have clarified the mechanisms of gas exchange during HFO, identified approaches to setting mean airway pressure based on lung mechanics, and identified a potentially better approach to applying partial liquid ventilation.
Conclusion
The study of HFO in large animal models has been essential to our understanding of the optimal approach to applying HFO in human studies.
Keywords: high-frequency oscillatory ventilation, partial liquid ventilation, regional gas transport, conventional ventilation, large-animal models
Information on the physiologic effects, the mechanisms of gas exchange, and the potential clinical utility of high-frequency oscillation (HFO) has been acquired in both large-and small-animal studies and from clinical trials. However, large-animal trials, specifically, have provided considerable information regarding the effects of ventilatory variables on regional gas transport during HFO, the effect of ventilatory settings on CO2 elimination, approaches to setting the oscillator to ensure maximum oxygenation, and the potential benefits of combining HFO with partial liquid ventilation (PLV). Large-animal studies have been important in the development of HFO for clinical use in humans because large animals present many of the same concerns and challenges that must be overcome during ventilation of adults. In this article, the specific contributions from large-animal studies will be addressed.
Regional Gas Transport
We have learned during the past 30 yrs that gas transport during conventional ventilation (CV) and HFO (or high-frequency ventilation in general) are similar in many respects but also differ greatly in others. During CV, gas transport along the tracheobronchial tree is primarily by bulk flow or convection. However, during HFO, the net transport of gas molecules can take place even when fresh gas does not directly reach all regions of the lung or when tidal volumes are less than anatomic dead space volume. In the mid 1980s, Jose Venegas’s group (1–5) performed a series of experiments in 10- to 30-kg dogs that helped to explain how ventilation with very small tidal volumes could provide adequate overall and regional ventilation. Most of these experiments were conducted using positron-emitting radioisotope nitrogen-13 (13NN) imaging. Distribution of ventilation with this process is easily identified because of the low solubility of 13NN in blood. As a result, 13NN is confined to the air space, and its regional distribution is not affected by blood flow.
In the first of these experiments Venegas et al. (1) estimated alveolar ventilation using a high-frequency oscillator capable of generating tidal volumes of 30–120 mL at frequencies of 2–25 Hz with equal and constant inspiratory-to-expiratory flows and ratios at a mean lung volume equal to the animal’s functional residual capacity. They found that specific ventilation (SPV; ventilation per unit of compartment volume) followed the following relationship:
| [1] |
where VT is tidal volume, VL is lung volume, and f is frequency. From this relationship and arterial PaCO2 levels, they were able to derive an expression for the normocapnic settings of VT and f, given mean lung volume (VL) and body weight (W):
| [2] |
where (VT·f)n represents the normocapnic product for HFO. These findings were similar to those of other groups (6 – 8) also using similar animal models. Venegas et al. (1) went on to point out that the efficiency of ventilation at small tidal volumes during HFO is much lower than with large tidal volumes, as in CV, and that to successfully ventilate a subject with HFO, a much greater VT·f product is required than would be required during CV (Fig. 1).
Figure 1.
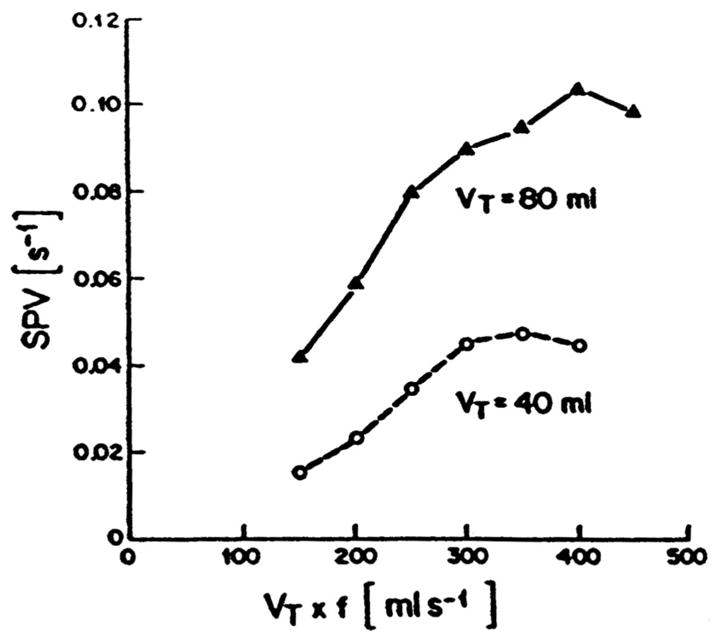
Specific ventilation (SPV) vs. tidal volume × frequency (VT × f) for a constant VT of 80 mL (solid line) and 40 mL (dashed line) from a single dog. Note that a large VT effect is present at constant VT × f, regardless of frequency. VT still has the greatest effect on specific or regional ventilation during high-frequency oscillation. Reproduced with permission from Venegas et al (1).
In a subsequent study in this series, Yamada et al. (2), using similar-sized healthy dogs and 13NN imaging, showed that changes in inspiratory-to-expiratory ratios (I:E) from 1:1 to 1:4 had no significant effect on PaO2, PaCO2, or alveolar ventilation at frequencies of 3, 6, and 9 Hz. During these experiments, tidal volume and mean lung volume were held constant. These data helped to support the assumptions of Permutt et al. (9), that axial dispersion of molecules within the lung is independent of flow. Menon et al. (10) also showed that the general shape of the velocity profiles during inspiration and expiration in HFO up to 9 Hz were insensitive to changes in the bulk flow rate.
The basic effects of mean airway pressure on gas transport were documented by Yamada et al. (3) in 1986. In this study, the authors again used healthy dogs. PaO2, PaCO2, and CO2 production were measured after 10 mins of HFO at three levels of mean airway pressure (0, 5, and 10 cm H2O) and three frequencies (3, 6, and 9 Hz). At each f, VT was adjusted at a mean airway pressure of 0 cm H2O to obtain eucapnia. In these healthy animals, SpO2 decreased and PaCO2 increased at each rate setting as mean airway pressure was increased to 5 and then to 10 cm H2O (Fig. 2). Alveolar ventilation decreased about 23% and 40% at mean airway pressures of 5 and 10 cm H2O, respectively. These changes in this healthy large-animal model were a result of decreases in alveolar ventilation as mean airway pressure increased, probably a result of a decreased cardiac output (leading to increased physiologic dead space). Because ventilation occurred at an FIO2 of 0.21, the decreases in PaO2 observed as PaCO2 increased were most probably a result of the increase in PaCO2, as predicted by the alveolar gas equation.
Figure 2.
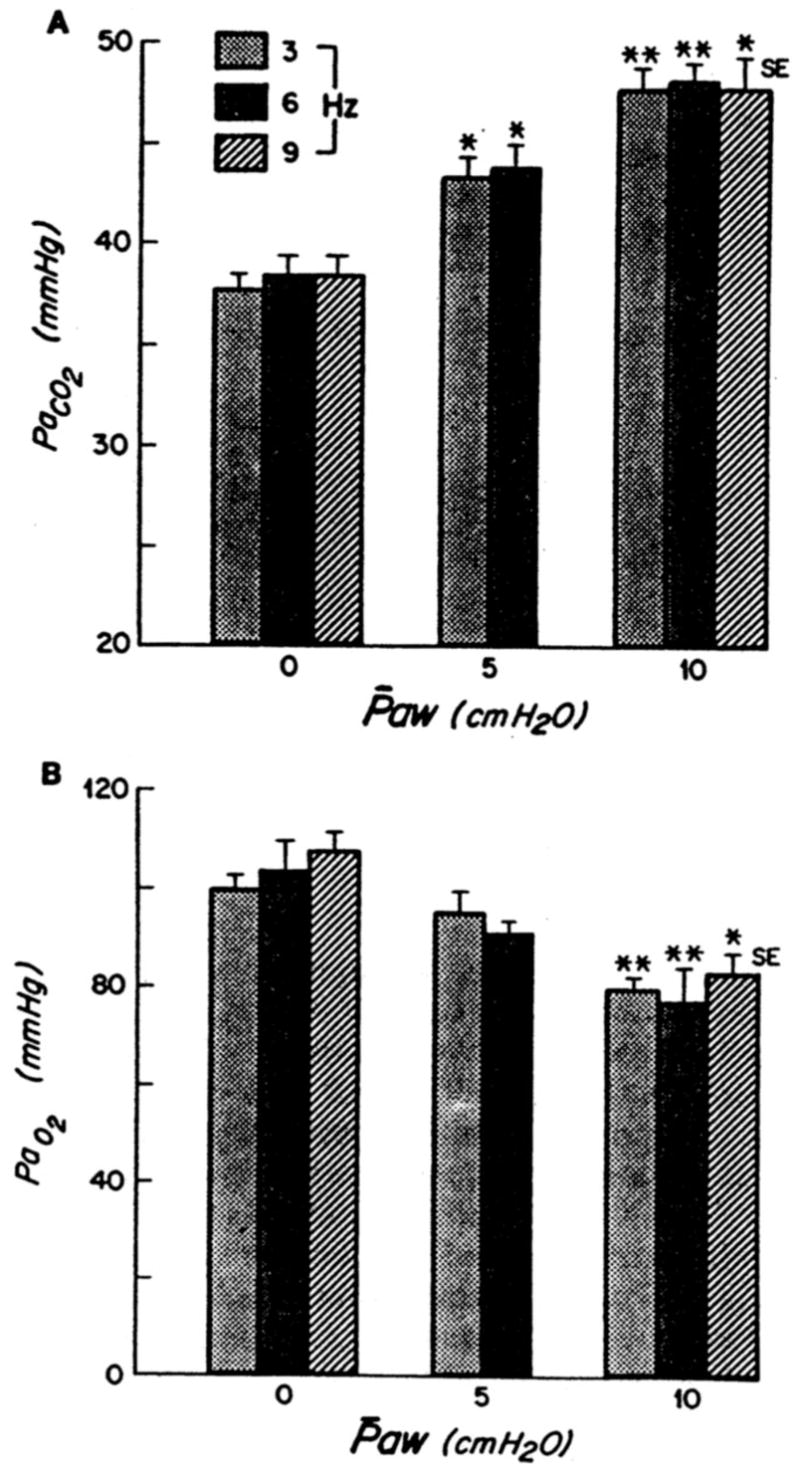
A, PaCO2 vs. mean airway pressure (Paw); B, PaO2 vs. Paw. Each bar represents a different frequency (3, 6, 9 Hz). *p < .01 vs. Paw of 0 cm H2O; **p < .001 vs. Paw of 0 cm H2O. Reproduced with permission from Yamada et al (2).
In a fourth article in this series, Venegas et al. (4), again using healthy 16- to 30-kg dogs and 13NN imaging, defined the regional (basal vs. apical) effect of tidal volume, respiratory frequency, and I:E ratio during HFO. They found that, at a constant VT·f product, increasing VT resulted in higher overall lung ventilation per unit of lung volume as a result of increased basal ventilation per unit of lung volume but little change in apical ventilation per unit of lung volume (Fig. 3). In addition, they determined that increasing VT·f at a constant VT increased overall ventilation without affecting a difference in the basal-to-apical regional ventilation distribution. As they had shown previously (3), I:E had no impact on regional distribution of ventilation. They concluded that as VT increases, gas transport changes from inefficient dispersion to primarily more efficient bulk gas flow (convection), with high regional tidal volume to dead space ratios. These data are consistent with the findings from other groups also using HFO in animal models (11–13).
Figure 3.
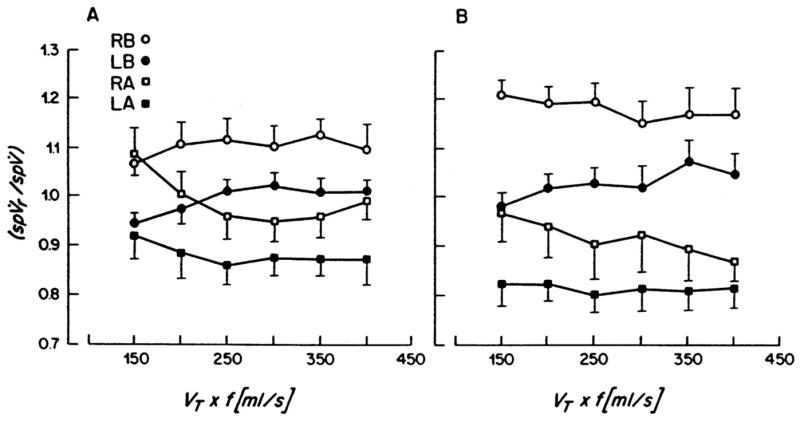
Plots of regional specific ventilation (spVr), normalized by corresponding mean specific ventilation (spV), as a function of frequency for four lung regions: right base (RB), left base (LB), right apex (RA), and left apex (LA). A, tidal volume (VT) = 40 mL; B, VT = 80 mL, mean + SE, n = 6. Reproduced with permission from Venegas et al (4).
In a fifth study in this series, Yamada et al. (5) studied regional mapping of gas transport during HFO vs. CV. HFO was provided at frequencies of 3, 6, and 9 Hz where the tidal volume at 6 Hz produced eucapnia. The VT·f obtained at 6 Hz remained constant as the rate was decreased to 3 Hz or increased to 9 Hz. During CV, rate was set at 10 breaths/min and VT set to produce eucapnia. Regional nonuniformity in gas transport was greatest for HFV at 3 and 6 Hz and lowest at 9 Hz and during CV. A central region at the base of the lungs was preferentially ventilated during HFO, resulting in a time-averaged ventilation in this area equal to that of the main bronchi. The authors argued that this finding is strongly supportive of the fact that convection is a primary mechanism for gas exchange during HFO. These data are consistent with the group’s previous reports in large-animal models (2–4) showing that overall gas transport in HFO is dependent on VT2·f and is in agreement with the findings of others regarding regional distribution of ventilation (14–16). Although some debate has previously occurred regarding the magnitude of the exponent on the tidal volume term of this equation, this controversy has now largely resolved. with a value of approximately 2 now being widely accepted.
The phenomenon of “negative frequency dependence” is commonly observed with the existing high-frequency oscillators. This phenomenon, whereby a reduced respiratory frequency leads to an increase in CO2 excretion, is likely a product of the increase in tidal volume that occurs with a fixed duty cycle. That is, a lower respiratory rate is more than offset by the increase in tidal volume because the square of the tidal volume is the critical factor governing gas exchange at high frequencies. Conversely, an increase in respiratory frequency leads to a decrease in tidal volume, yielding reduced CO2 clearance. This apparent paradox is a common observation with current technologies for delivering HFO.
Gas Exchange
The ability of HFO to maintain PaO2 and PaCO2 in healthy dogs was nicely demonstrated by Bohn et al. (17) in 1980. The authors observed a relatively stable PaCO2 of 33.1 ± 0.5 mm Hg at a frequency of 15 Hz with tidal volumes of 1.9 mL/kg using an uncuffed airway. With FIO2 equal to that of room air, PaO2 could be maintained at ≥95 ± 5 mm Hg for 5 hrs, and with 100% oxygen, PaO2 was ≥580 ± 9 mm Hg for 5 hrs. This was one of the first experiments demonstrating that gas exchange could be maintained with tidal volumes less than dead space volume.
Slutsky et al. (8) examined the effect of varying frequency between 2 and 30 Hz and tidal volume between 1 and 7 mL/kg and lung volume on the efficiency of CO2 elimination in healthy dogs. In all experiments CO2 increased with frequency at a constant VT. However, the most important variable in determining CO2 was VT·f, but there was considerable variability in the response of animals to doubling the VT at a constant VT·f. In some animals, CO2 decreased, although in the majority of animals, CO2 markedly increased. Increasing lung volume by increasing mean airway pressure up to 25 cm H2O had no significant effect on CO2. These data supported the assumptions made by the same group (18) in a previous article that gas exchange in HFO was due to a number of augmentative mechanisms in addition to convective flow, Taylor laminar (19) and turbulent dispersion (20), mixing due to asymmetrical velocity profiles as proposed by Haselton and Scherer (21), and secondary flows at bifurcations (e.g., pendelluft). In 1982, Thompson et al. (22) compared HFO with CV in 15-kg dogs with oleic acid injury. Cardiac output and gas exchange were compared at equivalent mean airway pressures. CV was performed with a tidal volume of 16–21 mL/kg and a frequency of 15–20 breaths/min. HFO was delivered at a frequency of 15 Hz. FIO2 was maintained at 0.5, and mean airway pressure varied over the range of 7.5–27 cm H2O. With HFO, oxygenation improved as mean airway pressure increased; however, the improvement was equal to that during CV at the same mean airway pressure. These data clearly demonstrated that HFO could maintain oxygenation in severe lung injury at a level at least equivalent to that achieved during CV.
Setting of Mean Airway Pressure
As with CV and the setting of positive end-expiratory pressure, there has been concern over the methodology used to set mean airway pressure during HFO. Many have simply recommended setting mean airway pressure equal to or a few centimeters of H2O above that used during CV (23–25). Goddon et al. (26), in a 28 ± 5− kg lavage-injured sheep model investigated the use of the pressure–volume (P-V) curve to set mean airway pressure during HFO. Inflation and deflation P-V curves were measured after lung injury followed by HFO at a frequency of 8 Hz, a delta pressure adjusted to establish PaCO2 with a bias flow of 30 L/min, an FIO2 of 1.0, and an I:E ratio of 1:1. The authors defined Pflex as the lower inflection point on the inflation limb of the P-V curve. Gas exchange and hemodynamics were evaluated at Pflex +2, +6, +10, and +14 cm H2O after 1 hr of ventilation at each level. Before the random setting of each mean airway pressure, the lungs were recruited with 50 cm H2O continuous positive airway pressure for 60 secs. As noted in Figures 4 and 5, PaO2/FIO2 was greatest at Pflex + 6 cm H2O, without adversely affecting the cardiac output. Interestingly, Pflex + 6 cm H2O in this model was equal to 26 + 1 cm H2O, which was equivalent to the point of maximum compliance change on the deflation limb of the P-V curve, also 26 ± 1 cm H2O.
Figure 4.
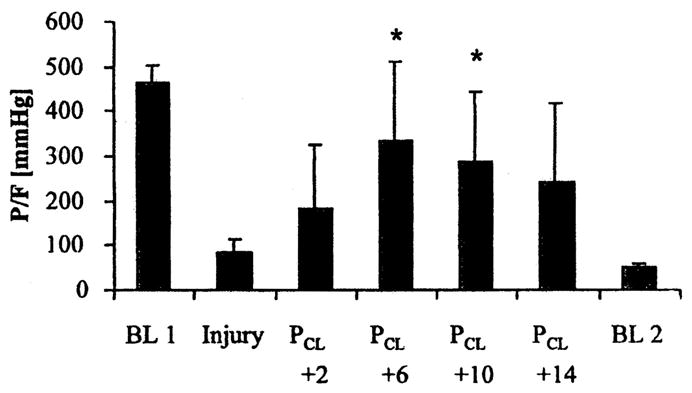
PaO2/FIO2 (P/F) ratio at baseline 1 (BL 1) before injury, injury, four settings of mean airway pressure during high-frequency oscillation (PCL + 2, + 6, + 10, + 14), and at baseline 2 (BL 2). All values are mean + SD. *p < .05 vs. injury. Reproduced with permission from Goddon et al (26).
Figure 5.
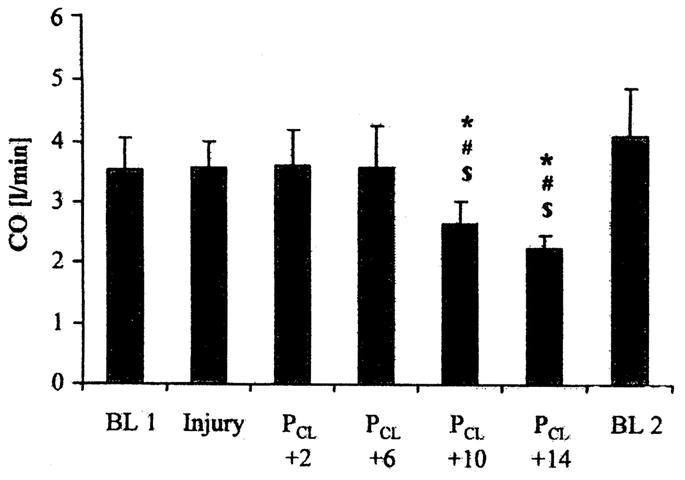
Cardiac output (CO) at baseline 1 (BL 1) before injury, injury, four settings for mean airway pressure during high-frequency oscillation (PCL + 2, + 6, + 10, + 14), and at baseline 2 (BL 2). All values are mean + SD. *p < .05 vs. injury. Reproduced with permission from Goddon et al (26).
Luecke et al. (27) also evaluated the use of the P-V to set mean airway pressure in lavage-injured large (45.9 ± 4.8 kg) swine but, in addition, assessed lung volume at both the base and apex of the lung during these trials using computerized tomography. The oscillator was set at 4 Hz, 30 L/min bias flow, delta pressure of 60 cm H2O, FIO2 of 1.0, and I:E of 1:1. Mean airway pressures were based on Pflex. Initially, mean airway pressure was set at Pflex, then 1.5 × Pflex, and then 2 × Pflex, followed again by 1.5 × Pflex, and finally, again Pflex. At each mean airway pressure setting, computerized tomographic scans were performed at the base and apex of the lungs, and blood gas and hemodynamic data were obtained. Gas exchange and hemodynamic data were best at 1.5 × Pflex on the inflation limb of the P-V curve. In fact, at this setting, PaO2 was established at preinjury values. Increasing the mean airway pressure further did not further increase oxygenation but did decrease oxygen delivery by decreasing cardiac output. In addition, no differences in respiratory or hemodynamic variables were observed at equivalent mean airway pressure on the ascending and descending limb of the P-V curve. Variation in total slice lung volume was less than anticipated from the P-V curve. Overdistending lung volume was estimated at about 3% and did not vary greatly as mean airway pressure changed. Total slice lung volume was greater during HFO than predicted by the P-V curve and near the deflation curve volume at corresponding pressures. That is, the marked hysteresis observed on the P-V curve with this injury model was absent during HFO.
The findings of Godden et al. (26) and Luecke et al. (27) are remarkably similar—1.5 × Pflex was equal to about 27 cm H2O—almost exactly the value obtained by Godden et al (26). These data suggest that the P-V curve is very useful for the setting of mean airway pressure during severe lung injury. Mean airway pressure set at Pflex + 6 cm H2O or at the point of maximum compliance change on the deflation limb of the P-V curve seems ideal.
Tidal Volume during HFO
Sedeek et al. (28), using a 30-kg lavage-injured sheep model, demonstrated that tidal volumes during HFO at low frequencies and high delta pressure approached those currently recommended during CV in acute respiratory distress syndrome patients (29) (Fig. 6). Animals were ventilated at a mean airway pressure equal to the maximum compliance change on the deflation limb of the P-V curve (26 ± 1.9 cm H2O) through an 8-mm internal diameter endotracheal tube with its cuff inflated. Tidal volume was then measured at all combinations of rates of 4, 6, 8, and 10 Hz, pressure amplitudes of 30, 40, 50, and 60 cm H2O, and I:E ratios of 1:1 and 1:2. At both I:E ratios, tidal volume was directly proportional to pressure amplitude and inversely proportional to frequency. A tidal volume of 4.4 ± 1.2 mL/kg was delivered at an I:E of 1:1, delta pressure of 60 cm H2O, and rate of 4 Hz. These findings were similar to those observed in other smaller animal models (30–32). It is interesting to speculate that at the capability of current adult oscillators with delta pressures of 90 cm H2O and rates of 3 Hz, tidal volumes of ≥6 mL/kg would be delivered during HFO in this 30-kg lavage injury sheep model.
Figure 6.
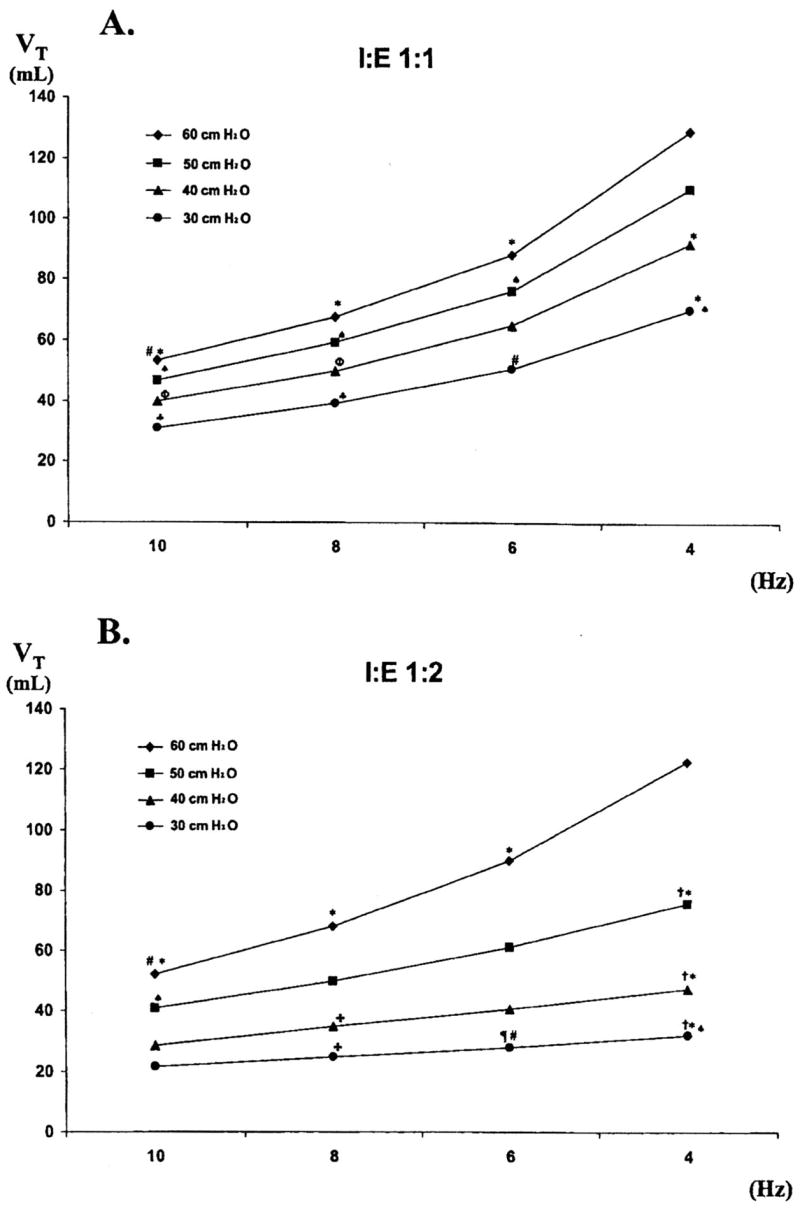
A, the combined effect of altering rate and pressure amplitude on actual tidal volume (VT) measured at an inspiratory/expiratory (I:E) ratio of 1:1; B, the combined effect of altering rate and pressure amplitude on actual VT measured at an I:E ratio of 1:2. All values are mean ± SD. The numbers 30, 40, 50, and 60 at the right of each line represent pressure amplitude in centimeters of H2O. *p < .05 vs. 4 Hz and 60 cm H2O; ♠p < .05 vs. 4 Hz and 50 cm H2O; #p < .05 vs. 6 Hz and 60 cm H2O; ♣p < .05 vs.4 Hz and 30 cm H2O; øp < .05 vs. 4 Hz and 40 cm H2O; &p < .05 vs. 8 Hz and 60 cm H2O; ¶p < .05 vs. 6 Hz and 50 cm H2O; fp < .05 vs. same settings at an I:E ratio of 1:1. Reproduced with permission from Sedeek et al (28).
HFO vs. CV
HFO has been compared with CV in numerous small-animal trials, but limited data are available in large-animal models for which the approach used during CV and HFO were similar. Sedeek et al. (33) performed such a study in a 30-kg lavage-lung injured sheep model using an open-lung approach to ventilatory support provided by HFO, pressure control, and intratracheal pressure ventilation. After injury in all three groups, the lungs were recruited and either positive end-expiratory pressure (pressure control, intratracheal pressure ventilation) or mean airway pressure was then set using a decremental trial. During HFO, rate was 8 Hz, delta pressure was set to achieve a PCO2 of 35–45 mm Hg, and I:E was 1:1. Pressure control was provided at a rate of 30 breaths/min, an I:E of 1:1, and a tidal volume to maintain PaCO2 in the target range. Intratracheal pressure ventilation was established by a bias flow via a double-lumen endotracheal tube in which the rate of occlusion was 120/min at an I:E of 1:1. The bias flow (about 18 L/min) was adjusted to ensure the target PaCO2. As noted in Figure 7, PaO2/FIO2 and PaCO2 were maintained at a similar level over a 4-hr observation period, regardless of approach. No differences were observed in hemodynamic response, but there was a trend to less lung injury in the group receiving HFO and intratracheal pressure ventilation. This may be partially explained by a resultant large tidal volume (8.9 ± 2.1 mL/kg) and high plateau pressure (30.6 ± 2.6 cm H2O) during pressure control. These data clearly illustrate the fact that HFO can be used with at least equal efficacy as CV in severe lung injury.
Figure 7.
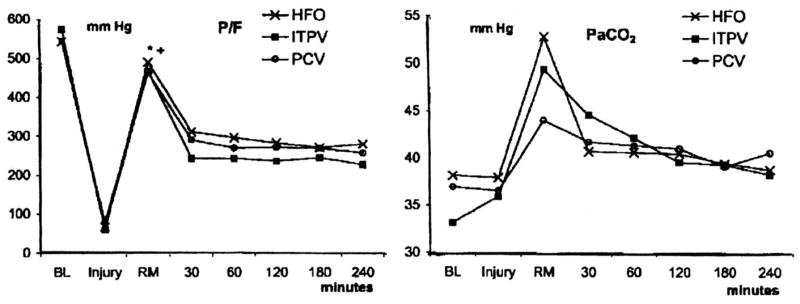
PaO2/FIO2 (P/F) ratio and PaCO2 throughout the course of the study protocol. PaO2/FIO2 among groups was similar throughout all phases of the study. No differences in PaCO2 were observed throughout the study as a result of large SD values. All data are mean values. *p < .05 vs. injury; +p < .05 vs. 30, 60, 90, 120, 180, and 240 mins; BL, baseline; HFO, high-frequency oscillation injury (lavage injury); ITPV, intratracheal pulmonary ventilation; PCV, pressure-control ventilation; RM, immediately after lung recruitment at set positive end-expiratory pressure or mean airway pressure; 30, 60, 120, 180, 240 mins, time after lung recruitment. Reproduced with permission from Sedeek et al (33).
HFO and PLV
The use of PLV in patients has not resulted in improved outcome (34–36). Some have argued that a primary reason for this failure to identify outcome benefit is the approach to providing ventilatory support during PLV (37, 38). All clinical trials have been performed using CV.
As previously described by Fuhrman et al. (39) and Arnold (37), during PLV, three distinct populations of alveoli exist based on gravitational location. PLV has been referred to as liquid positive end-expiratory pressure (39) because its effects are primarily experienced by the most gravity-dependent lung units. This population experiences the effect of the perfluorocarbon throughout ventilation because it remains fluid-filled. The least gravity-dependent lung units only experience gas ventilation because they are minimally affected by the perfluorocarbon. It is the population of lung units between these two extremes that are subjected to the actual air–liquid interface. The level of perfluorocarbon in this region varies with inspiration and expiration, so during PLV, a substantial part of the lung still experiences the shear stress of a gas-filled lung or liquid–gas inter-phase (37).
Arnold (37) and Mammel (38) argue that HFO may be the ideal method of ventilating and oxygenating during PLV. As discussed by Arnold (37), this combination has a number of distinct advantages. The perfluorocarbon reverses the atelectasis in the dependent lung and directs pulmonary blood flow to the non-dependent lung (40). Because of its lower VT and peak alveolar pressure, HFO could ventilate the nondependent lung with adequate mean airway pressure to avoid overdistension and atelectasis in this region (41). Arnold (37) proposed that the small VT associated with HFO minimizes the shear stress and subsequent injury in the regions containing liquid and air. Although much of the work addressing the use of HFO during PLV has been performed on small-animal models (42–47), a number of large-animal HFO–PLV studies have been performed by Doctor et al (48–50).
Histopathologic evidence of improved recruitment in dependent and nondependent lung during HFO–PLV was demonstrated by Doctor et al. (48) in a swine (29.6 kg) saline lavage–lung injured model. After injury and 1 hr of stabilization, animals were randomized to HFO or HFO–PLV with 30 mL/kg perfluorocarbon dosing, then ventilated for 2 hrs. Over the course of the study, there were no differences between groups in gas exchange, hemodynamic function, or pulmonary vascular resistance. However, atelectasis scores were reduced greatly in the HFO–PLV group. The lack of gas exchange difference may have been a result, at least in part, of a low mean airway pressure during HFO. Lung mechanics were not used to set the mean airway; it was simply set arbitrarily at 12 cm H2O above the mean airway pressure during CMV.
In 2001, Doctor et al. (49) examined the perfluorocarbon dose-response during HFO in a 28.9-kg saline lavage–induced acute lung injury swine model. The gas exchange and hemodynamic effects of 0, 5, 15, and 20 mL/kg of perfluorocarbon were evaluated during HFO. After lung injury, lungs were recruited by a stepwise increase in mean airway pressure, beginning at 10 cm H2O above the mean airway pressure during CV. After recruitment, the animals were stabilized on HFO at 4 Hz, a delta pressure to achieve a PaCO2 of 45–55 mm Hg, I:E of 1:1, FIO2 of 0.6, and mean airway pressure of about 20 cm H2O. After stabilization, animals were randomized to the different perfluorocarbon dose groups. HFO–PLV was best tolerated with the 5- and 15-mL/kg dose of perfluorocarbon. PaCO2, pH, cardiac index, and pulmonary vascular resistance did not change significantly during any dose or among doses. The lowest oxygenation index was identified during the 15-mL/kg dosing, and the PO2 tended to be best at the 15-mL/kg dose. These data are in contrast to much of the other dose-response data in animals during CV in which oxygenation benefit increased as dosing increased to 30 mL/kg (51) unless high levels of positive end-expiratory pressure were applied (40).
One of the longest laboratory evaluations of PLV was performed by Doctor et al. (50) in 2003. The authors evaluated the extended effect of HFO–PLV on gas exchange and injury quantification. Three groups of five lavage-injured, 28.9 ± 3.1− kg swine were studied. One group received only HFO, the second received 10 mL/kg perfluorocarbon in the supine positions plus HFO, and a third received 10 mL/kg perfluorocarbon plus HFO in the prone position. HFO was applied at a rate of 4 Hz to all groups. Mean airway pressure was adjusted to maintain a SpO2 of 90% ± 2% with an FIO2 of 0.6. Delta pressure was set after lung injury to achieve a PaCO2 of 45–55 mm Hg without adjustment after perfluorocarbon dosing. Both PaO2 and oxygenation index improved rapidly and significantly in the HFO prone–PLV group compared with the other groups, but this benefit was lost after about 6 hrs. Tissue myeloperoxidase activity was reduced globally by HFO–PLV (either group, p < .01), and regional lung injury scores in dependent lung were improved (p = .05). However, global lung injury scores were improved by HFO–PLV (both groups, p < .05) only in atelectasis, edema, and alveolar distension but not in cumulative score.
This series of studies, along with the data in small-animal models, does provide some enthusiasm for the continued exploration of the clinical application of PLV. The use of CV as opposed to HFO in clinical trials may have contributed to their negative results, and the use of HFO–PLV may yield more encouraging results.
SUMMARY
Large-animal models have contributed greatly to our understanding of the basic physiology of HFO and methods for clinical application during severe lung injury. These studies have clarified the mechanisms of gas exchange during HFO and have established the fact that, in adults, HFO is effective because of bulk gas flow. CO2 elimination during HFO is increased by either decreasing rate or increasing delta pressure because both changes increase tidal volume. Mean airway pressure setting during HFO may be set using the static P-V curve or a decremental trial following lung recruitment. In either case, the mean airway pressure that maximizes oxygenation without compromising cardiac output seems to be about Pflex + 6 cm H2O, 1.5 × Pflex, or the point of maximum compliance change on the deflation limb of the P-V curve. Finally, HFO may provide a gas delivery mechanism that allows successful application of PLV in the management of acute respiratory distress syndrome. Clearly, large-animal models, because they present challenges similar to those observed during human trials, are a critical component of increasing our understanding of the use of HFO in patients.
References
- 1.Venegas JG, Custer J, Kamm RD, et al. Relationship for gas transport during high-frequency ventilation in dogs. J Appl Physiol. 1985;59:1539–1547. doi: 10.1152/jappl.1985.59.5.1539. [DOI] [PubMed] [Google Scholar]
- 2.Yamada Y, Hales CA, Venegas JG. Inspiratory-to-expiratory time ratio and alveolar ventilation during high-frequency ventilation in dogs. J Appl Physiol. 1986;61:1903–1907. doi: 10.1152/jappl.1986.61.5.1903. [DOI] [PubMed] [Google Scholar]
- 3.Yamada Y, Venegas JG, Strieder DJ, et al. Effects of mean airway pressure on gas transport during high-frequency ventilation in dogs. J Appl Physiol. 1986;61:1896–1902. doi: 10.1152/jappl.1986.61.5.1896. [DOI] [PubMed] [Google Scholar]
- 4.Venegas JG, Yamada Y, Custer J, et al. Effects of respiratory variables on regional gas transport during high-frequency ventilation. J Appl Physiol. 1988;64:2108–2118. doi: 10.1152/jappl.1988.64.5.2108. [DOI] [PubMed] [Google Scholar]
- 5.Yamada Y, Burnham C, Hales CA, et al. Regional mapping of gas transport during high-frequency and conventional ventilation. J Appl Physiol. 1989;66:1209–1218. doi: 10.1152/jappl.1989.66.3.1209. [DOI] [PubMed] [Google Scholar]
- 6.Kamm RD, Collins JM, Jushi CH, et al. Axial dispersion of a passive contaminant in oscillatory flow. Abstr. Proceedings of the 35th Annual Conference on Engineering in Medicine and Biology; 1982. p. 23. [Google Scholar]
- 7.Kamm RD, Slutsky AS, Drazen JM. High-frequency ventilation. CRC Crit Rev Bioeng. 1984;9:347–379. [PubMed] [Google Scholar]
- 8.Slutsky AS, Kamm RD, Rossing TH, et al. Effects of frequency, tidal volume, and lung volume on CO2 elimination in dogs by high frequency (2–30 Hz), low tidal volume ventilation. J Clin Invest. 1981;68:1475–1484. doi: 10.1172/JCI110400. [DOI] [PMC free article] [PubMed] [Google Scholar]
- 9.Permutt S, Mitzner W, Weinmann G. Model of gas transport during high-frequency ventilation. J Appl Physiol. 1985;58:1956–1970. doi: 10.1152/jappl.1985.58.6.1956. [DOI] [PubMed] [Google Scholar]
- 10.Menon AS, Weber ME, Chang HF. A model study of flow dynamics in human central airways: III Oscillatory velocity profiles. Respir Physiol. 1984;55:255–275. doi: 10.1016/0034-5687(84)90026-4. [DOI] [PubMed] [Google Scholar]
- 11.Berdine GB, Lehr JL, McKinley DS, et al. Nonuniformity of canine lung washout by high-frequency ventilation. J Appl Physiol. 1986;61:1388–1394. doi: 10.1152/jappl.1986.61.4.1388. [DOI] [PubMed] [Google Scholar]
- 12.Moffat SL, Byford L, Forkert L. Interregional gas mixing and gas transport during high-frequency oscillations. Respir Physiol. 1985;62:1–13. doi: 10.1016/0034-5687(85)90046-5. [DOI] [PubMed] [Google Scholar]
- 13.Schmid ER, Knopp TJ, Rehder K. Intrapulmonary gas transport and perfusion during high-frequency oscillation. J Appl Physiol. 1981;51:1507–1514. doi: 10.1152/jappl.1981.51.6.1507. [DOI] [PubMed] [Google Scholar]
- 14.Hoffman EA. Effect of body orientation on regional lung expansion: A computed tomographic approach. J Appl Physiol. 1985;59:468–480. doi: 10.1152/jappl.1985.59.2.468. [DOI] [PubMed] [Google Scholar]
- 15.Hoffman EA, Ritman EL. Effect of body orientation on regional lung expansion in dog and sloth. J Appl Physiol. 1985;59:481–491. doi: 10.1152/jappl.1985.59.2.481. [DOI] [PubMed] [Google Scholar]
- 16.Hubmayr RD, Walters BJ, Chevalier PA, et al. Topographical distribution of regional lung volume in anesthetized dogs. J Appl Physicol. 1983;54:1048–1056. doi: 10.1152/jappl.1983.54.4.1048. [DOI] [PubMed] [Google Scholar]
- 17.Bohn DJ, Miyasaka K, Marchak BE, et al. Ventilation by high-frequency oscillation. J Appl Physiol. 1980;48:710–716. doi: 10.1152/jappl.1980.48.4.710. [DOI] [PubMed] [Google Scholar]
- 18.Slutsky AS, Drazen JM, Ingram RH, et al. Effective pulmonary ventilation with small volume oscillations at high frequencies. Science. 1980;209:609–611. doi: 10.1126/science.6771872. [DOI] [PubMed] [Google Scholar]
- 19.Taylor GI. Dispersion of soluble matter in solvent flowing slowly through a tube. Proc R Soc London Ser A. 1953;219:186–203. [Google Scholar]
- 20.Taylor GI. The dispersion of matter in turbulent flow through a pipe. Proc R Soc London Ser A. 1954;223:446–468. [Google Scholar]
- 21.Haselton FR, Scherer PW. Bronchial bifurcations and respiratory mass transport. Science. 1980;208:69–71. doi: 10.1126/science.7361109. [DOI] [PubMed] [Google Scholar]
- 22.Thompson WK, Marchak BE, Froese AB, et al. High-frequency oscillation compared with standard ventilation in pulmonary injury model. J Appl Physiol. 1982;52:543–548. doi: 10.1152/jappl.1982.52.3.543. [DOI] [PubMed] [Google Scholar]
- 23.Fort P, Farmer C, Westerman J, et al. High-frequency oscillatory ventilation for adult respiratory distress syndrome: A pilot study. Crit Care Med. 1997;25:937–947. doi: 10.1097/00003246-199706000-00008. [DOI] [PubMed] [Google Scholar]
- 24.Mehta S, Lapinsky SE, Hallett DC, et al. Prospective trial of high-frequency oscillation in adults with acute respiratory distress syndrome. Crit Care Med. 2001;29:1360–1369. doi: 10.1097/00003246-200107000-00011. [DOI] [PubMed] [Google Scholar]
- 25.Derdak S, Mehta S, Stewart TE, et al. High-frequency oscillatory ventilation for acute respiratory distress syndrome in adults. Am J Respir Crit Care Med. 2002;166:801–808. doi: 10.1164/rccm.2108052. [DOI] [PubMed] [Google Scholar]
- 26.Goddon S, Fujino Y, Hromi JM, et al. Optimal mean airway pressure during high-frequency oscillation. Anesthesiology. 2001;94:862–869. doi: 10.1097/00000542-200105000-00026. [DOI] [PubMed] [Google Scholar]
- 27.Luecke T, Meinhardt JP, Herrmann P, et al. Setting mean airway pressure during high-frequency oscillatory ventilation according to the static pressure-volume curve in surfactant-deficient lung injury. Anesthesiology. 2003;99:1313–1322. doi: 10.1097/00000542-200312000-00012. [DOI] [PubMed] [Google Scholar]
- 28.Sedeek KA, Takeuchi M, Suchodolski K, et al. Determinants of tidal volume during high-frequency oscillation. Crit Care Med. 2003;31:227–231. doi: 10.1097/00003246-200301000-00035. [DOI] [PubMed] [Google Scholar]
- 29.The Acute Respiratory Distress Syndrome Network. Ventilation with lower tidal volumes as compared with traditional tidal volumes for acute lung injury and the acute respiratory distress syndrome. N Engl J Med. 2000;342:1301–1308. doi: 10.1056/NEJM200005043421801. [DOI] [PubMed] [Google Scholar]
- 30.Dimitriou G, Greenough A, Kavvadia V, et al. Volume delivery during high frequency oscillation. Arch Dis Child Fetal Neonatal Ed. 1998;78:F148–F150. doi: 10.1136/fn.78.2.f148. [DOI] [PMC free article] [PubMed] [Google Scholar]
- 31.Dimitriou G, Greenough A, Kavvadia V, et al. Comparison of two inspiratory: Expiratory ratios during high frequency oscillation. Eur J Pediatr. 1999;158:796–799. doi: 10.1007/s004310051208. [DOI] [PubMed] [Google Scholar]
- 32.Courtney SE, Weber KR, Spohn WA, et al. Measurement of tidal volume using a pneumotachometer during high-frequency oscillation. Crit Care Med. 1990;78:651–653. doi: 10.1097/00003246-199006000-00015. [DOI] [PubMed] [Google Scholar]
- 33.Sedeek KA, Takeuchi M, Suchodolski K, et al. Open-lung protective ventilation with pressure control ventilation, high-frequency oscillation, and intratracheal pulmonary ventilation results in similar gas exchange, hemodynamics, and lung mechanics. Anesthesiology. 2003;99:1102–1111. doi: 10.1097/00000542-200311000-00016. [DOI] [PubMed] [Google Scholar]
- 34.Hirschl RB, Pranikoff T, Gauger P, et al. Liquid ventilatory in adults, children, and full-term neonates. Lancet. 1995;346:1201–1202. doi: 10.1016/s0140-6736(95)92903-7. [DOI] [PubMed] [Google Scholar]
- 35.Hirschl RB, Pranikoff T, Wise C, et al. Initial experience with partial liquid ventilation in adult patients with the acute respiratory distress syndrome. JAMA. 1996;275:383–389. [PubMed] [Google Scholar]
- 36.Hirschl RB, Croce M, Gore D, et al. Prospective, randomized controlled pilot study of partial liquid ventilation in adult acute respiratory distress syndrome. Am J Respir Crit Care Med. 2002;165:781–787. doi: 10.1164/ajrccm.165.6.2003052. [DOI] [PubMed] [Google Scholar]
- 37.Arnold JH. High-frequency oscillatory ventilation and partial liquid ventilation: Liquid breathing to a different beat (frequency) Crit Care Med. 2000;28:2660–2662. doi: 10.1097/00003246-200007000-00087. [DOI] [PubMed] [Google Scholar]
- 38.Mammel M. High-frequency oscillation and partial liquid ventilation. Crit Care Med. 2001;29:1293. doi: 10.1097/00003246-200106000-00052. [DOI] [PubMed] [Google Scholar]
- 39.Fuhrman BP, Herman LJ, Rotta AT. Partial liquid ventilation: A multifaceted approach to acute respiratory distress syndrome. New Horizons. 1999;7:433–439. [Google Scholar]
- 40.Kirmse M, Fujino Y, Hess D, et al. Relationship between fill-volume during partial liquid ventilation (PLV) and the lower inflation point on the static pressure-volume curve. Am J Respir Crit Care Med. 1998;158:1550–1556. doi: 10.1164/ajrccm.158.5.9708100. [DOI] [PubMed] [Google Scholar]
- 41.Doctor A, Ibla JC, Grenier EM. Pulmonary blood flow distribution during partial liquid ventilation. J Appl Physiol. 1998;84:1540–1550. doi: 10.1152/jappl.1998.84.5.1540. [DOI] [PubMed] [Google Scholar]
- 42.Gothberg S, Parker TA, Abman SH, et al. High-frequency oscillatory ventilation and partial liquid ventilation after acute lung injury in premature lambs with respiratory distress syndrome. Crit Car Med. 2000;28:2450–2456. doi: 10.1097/00003246-200007000-00044. [DOI] [PubMed] [Google Scholar]
- 43.Braden HP, Mellema JD, Bratton SL, et al. High-frequency oscillatory ventilation with partial liquid ventilation in a model of acute respiratory failure. Crit Care Med. 1997;25:299–302. doi: 10.1097/00003246-199702000-00018. [DOI] [PubMed] [Google Scholar]
- 44.Kinsella JP, Parker TA, Galan H, et al. Independent and combined effects of inhaled nitric oxide, liquid perfluorochemical, and high-frequency oscillatory ventilation in premature lambs with respiratory distress syndrome. Am J Respir Crit Care Med. 1999;159:1220–1227. doi: 10.1164/ajrccm.159.4.9807150. [DOI] [PubMed] [Google Scholar]
- 45.Smith KM, Bing DR, Meyers PA, et al. Partial liquid ventilation: A comparison using conventional and high-frequency techniques in an animal model of acute respiratory failure. Crit Care Med. 1997;25:1179–1186. doi: 10.1097/00003246-199707000-00020. [DOI] [PubMed] [Google Scholar]
- 46.Smith KM, Mrozek JD, Simonton SC, et al. Prolonged partial liquid ventilation using conventional and high-frequency ventilatory techniques: Gas exchange and lung pathology in an animal model of respiratory distress syndrome. Crit Care Med. 1997;25:1888–1897. doi: 10.1097/00003246-199711000-00030. [DOI] [PubMed] [Google Scholar]
- 47.Sukuman M, Bommaraju M, Fisher JE, et al. High-frequency partial liquid ventilation in respiratory distress syndrome: Hemodynamics and gas exchange. J Appl Physiol. 1998;84:327–328. doi: 10.1152/jappl.1998.84.1.327. [DOI] [PubMed] [Google Scholar]
- 48.Doctor A, Massoni MC, DelBalzo U, et al. High-frequency oscillatory ventilation of the perfluorocarbon-filled lung: Preliminary results in an animal model of acute lung injury. Crit Care Med. 1999;27:2500–2507. doi: 10.1097/00003246-199911000-00029. [DOI] [PubMed] [Google Scholar]
- 49.Doctor A, Price B, Bhargava N, et al. High-frequency oscillatory ventilation of the perfluorocarbon-filled lung: Dose-response relationships in an animal model of acute lung injury. Crit Care Med. 2001;29:847–854. doi: 10.1097/00003246-200104000-00033. [DOI] [PubMed] [Google Scholar]
- 50.Doctor A, Al-Khadra E, Tan P, et al. Extended high-frequency partial liquid ventilation in lung injury: Gas exchange, injury quantification, and vapor loss. J Appl Physiol. 2003;95:1248–1258. doi: 10.1152/japplphysiol.00598.2002. [DOI] [PubMed] [Google Scholar]
- 51.Tutuncu AS, Faithfull NS, Kachmann B. Intratracheal perfluorocarbon administration combined with mechanical ventilation in experimental respiratory distress syndrome: Dose-dependent improvement of gas exchange. Crit Care Med. 1993;21:962–969. doi: 10.1097/00003246-199307000-00008. [DOI] [PubMed] [Google Scholar]