Abstract
The surface uplift history of the Tibetan Plateau and Himalaya is among the most interesting topics in geosciences because of its effect on regional and global climate during Cenozoic time, its influence on monsoon intensity, and its reflection of the dynamics of continental plateaus. Models of plateau growth vary in time, from pre-India-Asia collision (e.g., ≈100 Ma ago) to gradual uplift after the India-Asia collision (e.g., ≈55 Ma ago) and to more recent abrupt uplift (<7 Ma ago), and vary in space, from northward stepwise growth of topography to simultaneous surface uplift across the plateau. Here, we improve that understanding by presenting geologic and geophysical data from north-central Tibet, including magnetostratigraphy, sedimentology, paleocurrent measurements, and 40Ar/39Ar and fission-track studies, to show that the central plateau was elevated by 40 Ma ago. Regions south and north of the central plateau gained elevation significantly later. During Eocene time, the northern boundary of the protoplateau was in the region of the Tanggula Shan. Elevation gain started in pre-Eocene time in the Lhasa and Qiangtang terranes and expanded throughout the Neogene toward its present southern and northern margins in the Himalaya and Qilian Shan.
Keywords: climate, tectonics, magnetostratigraphy, Hoh Xil Basin, Cenozoic
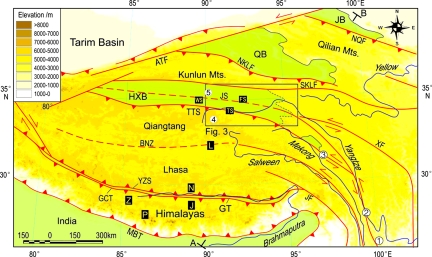
The Tibetan Plateau is the most extensive region of elevated topography in the world (Fig. 1). How such high topography, which should have an effect on climate, monsoon intensity, and ocean chemistry (1–5), has developed through geologic time remains disputed. Various lines of investigation, including evidence from the initiation of rift basins (6), potassium-rich (K-rich) volcanism (7), tectonogeomorphic studies of fluvial systems and drainage basins (8), thermochronologic studies (9), upper-crustal deformation histories (10, 11), stratigraphic and magnetostratigraphic studies of sediment accumulation rates (12), paleobotany (13), and oxygen isotope-based paleoaltimetry (14–22), have suggested different uplift histories. Authors of recent geologic studies (11) have proposed that significant crustal thickening (and by inference, surface uplift) in the Qiangtang terrane occurred in the Early Cretaceous [≈145 mega-annum (Ma) age], followed by major crustal thickening within the Lhasa terrane between ≈100 and 50 Ma ago. This hypothesis remains disputed (23). Other models of plateau growth range from Oligocene (e.g., ≈30 Ma ago) gradual surface uplift (7) to more recent (<7 Ma ago) and abrupt surface uplift (24), with oblique stepwise growth of elevation northward and eastward after the India-Eurasia collision (7, 20, 25, 26). With few exceptions (e.g., see refs. 11 and 27), most of these models focus on data from the Himalaya and southern Tibet and remain relatively unconstrained by geologic data from the interior of the Tibetan Plateau.
Fig. 1.
A simplified tectonic map of the Tibetan Plateau and Himalaya that shows the major tectonic blocks, suture zones, large faults, and basins discussed in the text. JB, Jiuquan basin; QB, Qaidam basin; GBC, Gangrinboche conglomerates; GCT, great counter thrust; GT, Gangdese thrust; NKLF, north Kunlun fault; SKLF, south Kunlun fault; ATF, Altyn Tagh fault; XF, Xianshui River fault; TTS, Tanggula thrust system; JF, Jingsha fault; BNS, Bangong–Nujiang suture zone; YZS, Yarlung Tsangpo suture zone; MBT, main boundary thrust. Small circles with numbers represent sites for Ar/Ar dating: 1–3, sites studied in ref. 7; 4, sites at which samples of K-rich lavas in the Zhuerkenwula mountain area (west of longitude 91°30′E; see Figs. 3 and 4 a and c) were collected for Ar/Ar dating; 5, HXB volcanic sites (see Fig. 4 b and c). Labeled boxes (with letters) represent areas at which previous studies for paleoelevation, sedimentology, and magnetostratigraphy of Cenozoic sections were conducted: L, Lunpola (20); FS, Fenghuo Shan (18); N (13, 17); J (43); P (44); Z (see SI Fig. 12 in SI Appendix). WS, FS, and TS represent the Wulanwula, Fenghuoshan, and Tongtianhe sections, respectively, shown in Fig. 2. The large box in the center shows the location of the map shown in Fig. 3.
The Hoh Xil Basin (HXB) of the north-central Tibetan Plateau (Figs. 1 and 2) is the most widespread exposure of Paleogene sediments on the high plateau and contains >5,000 m of Cenozoic nonmarine strata (28). Although the HXB (5,000-m average elevation) is a part of the high plateau today, it once was a basin bounding the northern boundary of the Paleogene proto-Tibetan Plateau. The HXB, characterized by low-gradient fluvial and lacustrine facies, may be an analogue of the Qaidam or Tarim basin systems on the northern margins of the modern high plateau, which are a variety of foreland basins termed “collisional successor basins” by Graham et al. (29). Here, we argue that the HXB is a foreland basin system that developed in concert with the rise and erosion of adjacent high mountain belts. Specifically, our work supports the idea that HXB evolution was coeval with the surface uplift of the Qiangtang terrane to the south and that high elevation characterized the central Tibetan Plateau by Eocene time.
Fig. 2.
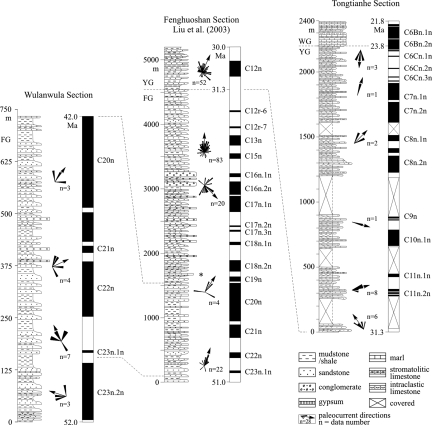
Lithologic and magnetochronostratigraphic correlations of measured sections in the Tongtianhe, Fenghuoshan, and Wulanwula subbasins of the HXB. Magnetochronostratigraphy of the Fenghuoshan subbasin is from ref. 32. Paleocurrent directions indicate westerly and southerly provenances in the Eocene and most of the Oligocene and northerly provenance in the latest Oligocene. The star in the Fenghuoshan section indicates the carbonate sampling site discussed in ref. 18.
Sedimentology and Magnetostratigraphy of the HXB
HXB sediments are exposed most extensively in the Fenghuo Shan (“shan” means “mountain” in Chinese) region and can be divided into three lithostratigraphic units. The basal Fenghuoshan Group (FG) consists of cobble-pebble conglomerate, red sandstone, and bioclastic limestone of fluvial, fan-delta, and lacustrine origin. The overlying Yaxicuo Group (YG) is distinguished by sandstone, mudstone, marl, and gypsum deposited in fluvial and playa environments. A pronounced angular unconformity separates the YG from the overlying Wudaoliang Group (WG), which consists of lacustrine marl and minor amounts of black oil shale. The FG and YG together are >5,000 m thick and deformed by overturned folds and numerous south-directed thrusts, whereas the 100- to 200-m-thick WG is only gently tilted.
Nearly 300 paleocurrent measurements indicate that the paleoflow direction recorded in the FG is dominantly northward (Fig. 2), consistent with provenance studies and proximal-to-distal facies distributions that show that detritus in the HXB was derived from the Qiangtang terrane to the south (30) and controlled by the Tanggula thrust system [for data, see supporting information (SI) Figs. 7 and 8 in SI Appendix]. Paleocurrent indicators in the YG are also directed to the north in its lower part but are increasingly deflected eastward higher in the section, with some southerly indicators at the top of the section (Fig. 2). Thus, paleoflow indictors are mainly directed northward away from the Tanggula Shan front and eastward parallel to the front.
Chinese workers traditionally have regarded the initiation of the HXB as Cretaceous on the basis of pollen biostratigraphy (31). Our magnetostratigraphic studies from several HXB sections, however, suggest that these strata are much younger (32). The FG was deposited ≈52.0–31.3 Ma ago (Early Eocene to Early Oligocene), and the YG was deposited 31.3–23.8 Ma ago (Early Oligocene) (Fig. 2). The base of the WG is biostratigraphically dated at ≈22 Ma ago (Miocene) (31). Average magnetostratigraphically derived sedimentation rates for the FG and YG exceed 200 m/Ma and, in detail, indicate at least three general periods of sediment accumulation (32). From ≈55 to 40 Ma ago, sedimentation rates averaged ≈150 m/Ma, increased significantly to 1,500 m/Ma at ≈40 Ma ago, and decreased to ≈400 m/Ma from ≈39 to 30 Ma ago. The rapid acceleration in sedimentation rates at ≈40 Ma ago coincides with the deposition of a coarsening-upward boulder-cobble conglomerate. We interpret these conglomerates as syntectonic and, therefore, that they may record activity on basin-bounding thrusts such as the Tanggula thrust system (Fig. 3).
Fig. 3.
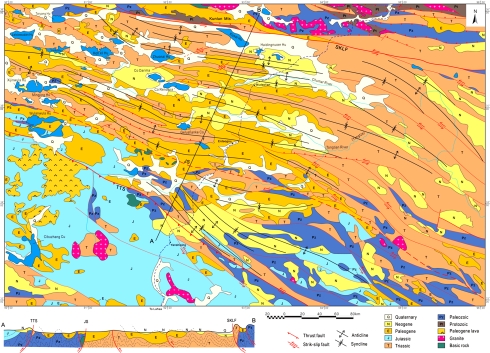
Simplified geologic map of the Hoh Xil region (boxed area in Fig. 1) based on 1:250,000-scale regional geologic mapping, showing the distribution of tectonically disrupted strata of the HXB and structural features. Note that the Jinsha River suture zone (JS, dashed red line) that separates Qiangtang and Songpan-Ganzi terrane is covered in this region. The dashed black line indicates the Qinghai-Tibet highway. TTS, Tanggula thrust system; SKLF, south Kunlun fault; A–B, location of the cross section on the lower left of the figure, which shows significant upper-crustal shortening in the Hoh Xil region. Paleogene volcanic fields of the Zhuerkenwula area are located in the western part of the region shown.
Crustal Shortening and Fission-Track Analyses of North-Central Tibet
As previously discussed, field relationships (Fig. 3) indicate that FG and YG strata were strongly deformed before deposition of the WG (30). Structural cross sections suggest that crustal shortening in the Fenghuo Shan region is ≈43% (30, 33), with the majority of this shortening complete by the end of the Oligocene. These structural relationships are similar to those observed in the Nanqian-Yushu region to the east (27, 34).
Our results from an apatite fission-track study of 25 samples from the Tanggula Shan and HXB provide constraints on the regional cooling history (SI Figs. 9 and 10 in SI Appendix). Early Paleogene apatite fission-track ages and negatively skewed track-length distributions of basement rock samples from the Tanggula Shan indicate a rapid cooling event ≈60–50 Ma ago followed by more gradual cooling thereafter. This cooling history can be explained by either regional Early Cenozoic volcanism (34, 35), tectonic exhumation, or a combination of these processes. Overlap in U/Pb ages in zircon, 40Ar/39Ar ages in biotites (34, 35), and apatite fission-track ages of volcanic and sedimentary samples is consistent with rapid unroofing of the northern Tanggula Shan by motion along the Tanggula thrust system. Moreover, extensive Late Paleogene flat-lying basalts (see below) that overlie strongly deformed Early Paleogene strata indicate that significant upper-crustal deformation and denudation on the northern flank of the Tanggula Shan was mostly compete by ≈40 Ma ago. In the HXB, apatite fission-track samples from 40- to 35-Ma-old FG strata exhibit shorter mean track lengths and track-length distributions suggestive of cooling beginning ≈30 Ma ago. These results are compatible with the sedimentary accumulation records for the HXB, indicating as much as 3,500 m of sediment overburden, and the structural history described above, indicating rapid exhumation of the Fenghuo Shan ≈30–22 Ma ago.
Paleogene High-Potassium Volcanism in North-Central Tibet
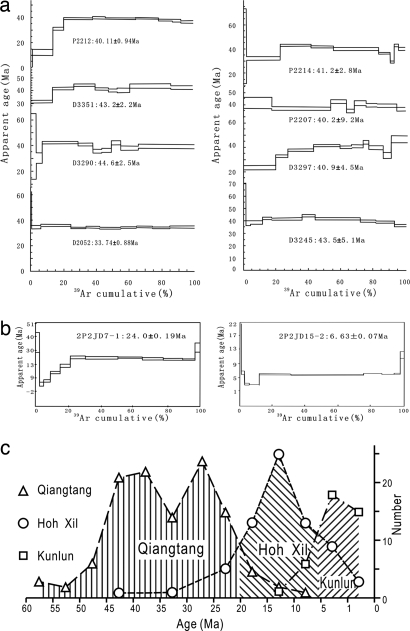
Many workers attribute the surface uplift of the Tibetan Plateau to a dynamic response to convective removal of the lower portion of an overthickened Tibetan lithosphere (36). Hot asthenosphere beneath a thin lithosphere is expected to produce not only dynamic topography but also crustal melts (37). Thus, the occurrence of K-rich, postcollisional volcanism in elevated terranes may be useful for dating the time of surface uplift. Approximately one decade ago, it was widely believed that all postcollisional volcanic rocks in Tibet were younger than ≈13 Ma and restricted to the northern and southern margins of the plateau (38). Recent results of others and those presented here, however, demonstrate that postcollisional volcanic rocks are widely distributed within the plateau interior and are older than those in the north and south (39, 40). In particular, 30- to 40-Ma-old K-rich lavas found across the eastern part of northern Tibet have been cited as evidence for diachronous surface uplift and high elevations because previously reported K-rich volcanics from western Qiangtang are ≈20 Ma old or younger (Fig. 1) (7). Our 40Ar/39Ar geochronologic study of a recently discovered volcanic province in the Zhuerkenwula mountain area (Figs. 3 and 4a) reveals that K-rich volcanism began in western Qiangtang at least 33.7–43.5 Ma ago. Calc-alkaline volcanic rocks of Eocene-Oligocene age were also documented recently in southern Qiangtang (40). In the HXB, however, most K-rich lava units are even younger (6–24 Ma; Fig. 4 b and c) and overlie redbeds of the foreland basin. Thus, east–west diachronous uplift of the Tibetan Plateau is not supported by the ages of K-rich lavas, which actually young northward from the Qiangtang terrane to the Kunlun Shan (Fig. 4c). Whether these melts are the product of lithospheric thinning or intracontinental subduction (35, 41) remains a topic of active research.
Fig. 4.
40Ar/39Ar plateau ages from this study. (a) Zhuerkenwula mountains, which is the largest Cenozoic volcanic province in the northern Tibetan-Kunlun region (≈2,500 km2). The K-rich lavas in this province were previously considered to be <20 Ma old. (b) Plateau ages from the Hoh Xil region. (c) Distributions of radiometric dates of K-rich lavas from the Qiangtang, Hoh Xil, and Kunlun belts (>200 dates collected, mainly from refs. 39 and 60).
Discussion
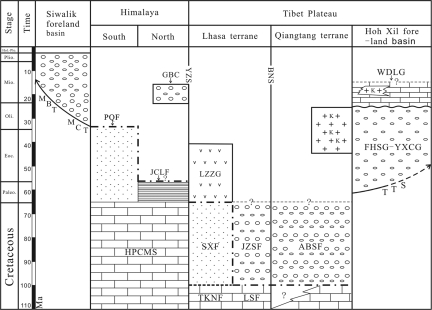
When did regional surface uplift commence? The transition from marine to terrestrial facies is one of the most direct lines of evidence for uplift. The youngest marine strata of the Qiangtang terrane are Lower Cretaceous, whereas those of the Lhasa terrane are Late Cretaceous (Fig. 5). These folded deposits are unconformably overlain by Upper Cretaceous and Paleogene nonmarine deposits, as imaged by recent seismic profiling in the region (SI Fig. 11 in SI Appendix) and mapped in outcrop (11, 42). This structural–stratigraphic relationship indicates that crustal shortening, thickening, and surface uplift were active in both the Qiangtang and Lhasa terranes well before the Early Eocene (10). South of the Lhasa terrane, recent biostratigraphic studies in the Himalayan terrane confirm the record of Paleocene marine deposition in both the northern and southern Tethyan Himalaya (43, 44). Importantly, our work demonstrates that the marine Penqu Formation near Tingri is latest Eocene in age (Priabonian, calcareous nannofossil zone NP20), extending the age of marine incursion in the southern Tethyan Himalaya by ≈5 Ma (44). We also have directly dated an Early Eocene (zone of Buryella clinata–Thursocyrtis ampla) radiolarian chert in Saga County in the northern Tethyan Himalaya (SI Fig. 12 in SI Appendix), where previous studies have only inferred a mid-Paleogene age on the basis of Paleocene biostratigraphy and stratigraphic relationships (43, 45). Thus, by using the disappearance of marine facies as a measure of early surface uplift, we conclude that the emergence of the Himalaya occurred post-Eocene at the earliest, possibly even more recently. Oxygen isotope-based paleoaltimetry studies from the Thakkhola graben and Gyirong basin suggest that the Tethyan Himalaya were at or near modern elevation by the mid-Miocene (14, 15). Collectively, these studies are consistent with the sedimentary record of Himalayan orogenesis (46) and indicate significant southward elevation gain between 40 and ≈12 Ma ago.
Fig. 5.
Generalized geological correlation across the Tibetan Plateau and Himalayan terrane, showing the timing for disappearance of marine strata in the Himalayan, Lhasa, and Qiangtang terranes. The initial age of the Siwalik foreland basin is according to ref. 46. PQF, marine Pengqu Formation (44); GBC, Gangrinboche conglomerate; JCLF, Jiachala Formation of turbidites (43); HPCMS, Himalayan passive continental margin strata; LZZG, Lingzizhong group volcanics; SXF, shallow marine Sexing Formation (59); TKNF, marine member of the Takena Formation; JZSF, Jingzhushan Formation redbeds; LSF, marine Lang Shan Formation; ABSF, Abushan Formation redbeds; WDLG, continental WG; FHSG-YXCG, FG and YG redbeds; +K, K-rich lava; MCT, main central thrust; YZS, Yarlung Tsangpo suture zone; BNS, Bangong–Nujiang suture zone; TTS, Tanggula thrust system. Solid wavy line, nonconformity; dot–dash line, boundary between marine and continental sediments.
When the proto-Tibetan Plateau (the Lhasa and Qiangtang terranes) reached its modern elevation remains uncertain (26), although regional paleoaltimetry studies provide some constraints. Independent paleoaltimetry estimates from the Namling-Oiyung basin in southern Tibet (13, 17) suggest that the elevation of the southern Tibetan Plateau has remained at ≈4.6 km since 15 Ma ago. Farther north, chronologically well constrained stable-isotope studies from the Nima basin along the Bangong–Nujiang suture between the Lhasa and Qiangtang terranes suggest that this region was high and dry, similar to the modern environment, by the Early Oligocene (22). Oxygen isotope studies of Paleogene strata in the Lunpola basin, which also spans the Bangong–Nujiang suture, suggest that the region was 4.0–4.6 km high (20) by the Early Oligocene (22). Paleoaltimetry estimates from the Hoh Xil region are equivocal. Cyr et al. (18) used oxygen isotope values from lacustrine carbonates from the FG and modeled monsoon-dominated isotopic lapse rates to argue that the HXB was ≈2 km high during the Late Eocene, whereas DeCelles et al. (22) reevaluated these data by using lower, empirically based lapse rates from central Tibet and argue that the HXB was 4.7–5.0 km high during the Late Eocene.
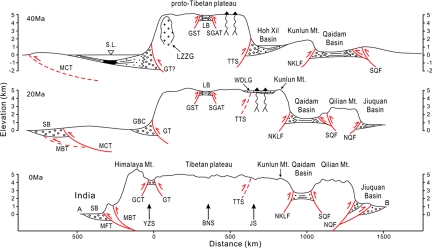
Our evidence from stratigraphy, geochronology of K-rich lavas, and apatite fission-track studies, as well as the paleoaltimetry studies discussed above, support the idea that the Lhasa and southern Qiangtang terranes were at or near their modern elevation since 40 Ma and formed the proto-Tibetan Plateau (Fig. 6). The northern edge of the Tanggula Shan formed the northern margin of the proto-Tibetan Plateau, whereas the Gangdese arc formed the southern boundary, consistent with the inferences of Kapp et al. (11, 47) and Spurlin et al. (34). Oligocene–Early Miocene upper-crustal shortening within the HXB would have been driven by Indo-Asian collisional stresses from the south transmitted across this high proto-Tibetan Plateau and localized along its northern boundary. Thus, we argue that the Tibetan Plateau grew southward and northward from a nucleus of high topography (Fig. 6), consistent with predictions based on simple physical considerations (48, 49). Surface uplift to 5,000 m in the HXB region was probably achieved by a combination of upper-crustal shortening (50), continental underthrusting of the Lhasa and Songpan-Ganzi terranes beneath Qiangtang (11), and mantle dynamics (36).
Fig. 6.
Schematic paleogeographic cross sections of the Himalaya and Tibetan Plateau, showing our proposed surface-uplift history for the Tibetan Plateau, in which the plateau grows northward and southward from an elevated proto-Tibetan Plateau (Lhasa and Qiangtang terranes) beginning in the Late Paleogene. MBT, main boundary thrust; GCT, great counter thrust; LZZG, Lingzizhong group volcanics; WDLG, continental Wudaoliang Group; TTS, Tanggula thrust system; NKLF, north Kunlun fault; NQF, north Qilian Mountain fault; GBC, Gangrinboche conglomerates; YZS, Yarlung Tsangpo suture zone; BNS, Bangong–Nujiang suture zone; JS, Jinsha River suture zone; MCT, main central thrust; SL, sea level; GT, Gangdese thrust; GST, Gaize–Siling Tso thrust; LB, Lunpola basin; SGAT, Shiquanhe–Gaize–Amdo thrust; SQF, the south Qilian Mountain fault; SB, Siwalik foreland basin; MFT, main frontal thrust. The Yaluzangbu River has been fixed as a reference point. See the A–B line in Fig. 1 for the position of the 0-Ma cross-section line.
Concluding Remarks
We propose a temporally and spatially differential surface-uplift history of the Tibetan Plateau (Fig. 6). Our integrated study suggests that the central plateau (the Lhasa and southern Qiangtang terranes) was uplifted by the Late Paleogene. A high proto-Tibetan Plateau may have contributed to climatic changes farther north in central Asia (19). Intriguingly, this timing also corresponds to a period of pronounced global cooling (1, 2) and changes in ocean chemistry (51). The plateau subsequently expanded as a result of the continued northward collision of India with Asia. To the south, the Himalaya rose during the Neogene. To the north, the Qilian Shan rapidly uplifted in the Late Cenozoic. These ranges constitute the modern southern and northern margins, respectively, of the Tibetan Plateau.
Methods and Analytical Techniques
Magnetostratigraphy.
Magnetostratigraphic sampling was conducted approximately every 10 m. Several sites include multiple samples at the same stratigraphic level. Sampling followed standard paleomagnetic practice with in situ drilling by a portable gasoline-powered core drill and sample orientation by sun compass. All experimental work was performed in a magnetically shielded laboratory at the University of California (Santa Cruz). Samples were subjected to progressive thermal and alternating field demagnetization and measured at each step of treatment by a 2G cryogenic magnetometer. Magnetization directions were determined by principal-component analysis (52). The distributions of paleomagnetic directions at each site were calculated by using Fisher statistics (53). Each of the major magnetic polarity zones were defined by several samples of the same polarity. Age constraints and spacing of the observed polarity intervals were used to anchor the observed polarity column to the geomagnetic time scale (54).
Geochronology.
40Ar/39Ar analyses were conducted on plagioclase mineral separates from 10 samples from the western regions of the northern Tibetan Plateau. The analytical procedures followed those described in ref. 55. After irradiation, all samples were step-heated by using a radio-frequency furnace. Argon isotope analyses were conducted on a MM1200 mass spectrometer at the Institute of Geology (China Seismological Bureau). 40Ar/39Ar plateau ages are interpreted as eruption ages for the volcanic samples; all of the plateau ages are well defined over 75% of the cumulative 39Ar released and are statistically indistinguishable from their corresponding inverse isochron ages.
Apatite Fission-Track Analyses.
Samples for fission-track study came from a transect that followed the Lhasa-Golmud highway. All samples were measured at the University of Melbourne (Melbourne, Australia). Standard and induced track densities were measured on mica external detectors (g = 0.5). Ages were calculated by using the zeta method (362.3 ± 8) for dosimeter glass CN-5. Empirical equations (56) that relate time, temperature, fission-track length, and fission-track density were used to extract age, track-length, and thermal history data.
Paleocurrents Direction Determination.
Paleocurrent directions were measured from primary sedimentary structures, including cross stratification, pebble imbrication, and ripple crest orientation. The orientations of paleocurrent indicators were measured in the field with a Brunton compass. For planar paleocurrent indicators (cross-strata, pebble-cobble imbrication), the strike and dip of the planar feature were measured. Structural restoration of paleocurrent data were made by using a computer-based stereonet program.
Radiolarian Biostratigraphy.
Ten radiolarian samples were analyzed at the Institute of Geological Sciences (Jagiellonian University, Krakow, Poland). Samples were processed following the procedures described in ref. 57. Samples were treated with 50% hydrochloric acid for 48 h to remove calcium carbonate and organic carbon and finely sieved (61 μm) with water to remove the fine fraction. The radiolarian species present and abundances were recorded following ref. 58.
Supplementary Material
Acknowledgments.
We thank Christopher J. L. Wilson and his colleagues at the University of Melbourne (Australia) for the apatite fission track data, and two anonymous reviewers for insightful reviews and constructive suggestions. This work was partially supported by National Key Basic Research Program of China Grant 2006CB701400 (to C.W.), 111 Project of China Grant B07011 (to C.W.), and U.S. National Science Foundation Grants EAR0310309 (to X.Z.), EAR0511016 (to X.Z.), and OCE0327431 (to X.Z.). This article is contribution no. 492 of the Paleomagnetism Laboratory and Center for the Study of Imaging and Dynamics of the Earth (Institute of Geophysics and Planetary Physics, University of California, Santa Cruz).
Footnotes
The authors declare no conflict of interest.
This article is a PNAS Direct Submission.
This article contains supporting information online at www.pnas.org/cgi/content/full/0703595105/DC1.
References
- 1.Ruddiman WF, Kutzbach JE. Plateau uplift and climate change. Sci Am. 1991;264:66–74. [Google Scholar]
- 2.Raymo ME, Ruddiman WF. Tectonic forcing of Late Cenozoic climate. Nature. 1992;359:117–122. [Google Scholar]
- 3.An ZS, Kutzbach JE, Prell WL, Porter SC. Evolution of Asian monsoons and phased uplift of the Himalaya-Tibetan Plateau since Late Miocene times. Nature. 2001;411:62–66. doi: 10.1038/35075035. [DOI] [PubMed] [Google Scholar]
- 4.Molnar P, England P, Martinod J. Mantle dynamics, uplift of the Tibetan Plateau, and the Indian Monsoon. Rev Geophys. 1993;31:357–396. [Google Scholar]
- 5.Richter FM, Rowley DB, DePaolo DJ. Sr isotope evolution of seawater: The role of tectonics. Earth Planet Sci Lett. 1992;109:11–23. [Google Scholar]
- 6.Coleman M, Hodges K. Evidence for Tibetan Plateau uplift before 14 Myr ago from a new minimum age for east-west extension. Nature. 1992;374:49–52. [Google Scholar]
- 7.Chung SL, et al. Diachronous uplift of the Tibetan Plateau starting 40 myr ago. Nature. 1998;394:769–773. [Google Scholar]
- 8.Clark MK, et al. Surface uplift, tectonics, and erosion of eastern Tibet from large-scale drainage patterns. Tectonics. 2004;23 doi: 10.1029/2002TC001402. [DOI] [Google Scholar]
- 9.Clark MK, et al. Late Cenozoic uplift of southern Tibet. Geology. 2005;33:525–528. [Google Scholar]
- 10.Murphy MA, et al. Did the Indo-Asian collision alone create the Tibetan Plateau? Geology. 1997;25:719–722. [Google Scholar]
- 11.Kapp P, Yin A, Harrison TM, Ding L. Cretaceous-Tertiary shortening, basin development, and volcanism in central Tibet. Bull Geol Soc Am. 2005;117:865–878. [Google Scholar]
- 12.Pares JM, et al. Northeastward growth and uplift of the Tibetan Plateau: Magnetostratigraphic insights from the Guide Basin. J Geophys Res. 2003;108 doi: 10.1029/2001JB001349. [DOI] [Google Scholar]
- 13.Spicer RA, et al. Constant elevation of southern Tibet over the past 15 million years. Nature. 2003;421:622–624. doi: 10.1038/nature01356. [DOI] [PubMed] [Google Scholar]
- 14.Garzione CN, et al. High times on the Tibetan Plateau: Paleoelevation of the Thakkhola graben, Nepal. Geology. 2000;28:339–342. [Google Scholar]
- 15.Rowley DB, Pierrehumbert RT, Currie BS. A new approach to stable isotope-based paleoaltimetry: Implications for paleoaltimetry and paleohypsometry of the High Himalaya since the Late Miocene. Earth Planet Sci Lett. 2001;188:253–268. [Google Scholar]
- 16.Dettman DL, Fang XM, Garzione CN, Li JJ. Uplift-driven climate change at 12 Ma: A long δ18O record from the NE margin of the Tibetan Plateau. Earth Planet Sci Lett. 2003;214:267–277. [Google Scholar]
- 17.Currie BS, Rowley DB, Tabor NJ. Middle Miocene paleoaltimetry of southern Tibet: Implications for the role of mantle thickening and delamination in the Himalayan orogen. Geology. 2005;33:181–184. [Google Scholar]
- 18.Cyr AJ, Currie BS, Rowley DB. Geochemical evaluation of Fenghuoshan Group lacustrine carbonates, north-central Tibet: Implications for the paleoaltimetry of the Eocene Tibetan Plateau. J Geol. 2005;113:517–533. [Google Scholar]
- 19.Graham SA, et al. Stable isotope records of Cenozoic climate and topography, Tibetan Plateau and Tarim basin. Am J Sci. 2005;305:101–118. [Google Scholar]
- 20.Rowley DB, Currie BS. Paleo-altimetry of the Late Eocene to Miocene Lunpola basin, central Tibet. Nature. 2006;439:677–681. doi: 10.1038/nature04506. [DOI] [PubMed] [Google Scholar]
- 21.Wang Y, Deng T, Biasatti D. Ancient diets indicate significant uplift of southern Tibet after ca. 7 Ma. Geology. 2006;34:309–312. [Google Scholar]
- 22.DeCelles PG, et al. High and dry in central Tibet during the Late Oligocene. Earth Planet Sci Lett. 2007;253:389–401. [Google Scholar]
- 23.Zhang KJ, Zhang YX, Li B, Zhong LF. Nd isotopes of siliclastic rocks from Tibet, western China: Constraints on provenance and pre-Cenozoic tectonic evolution. Earth Planet Sci Lett. 2007;256:604–616. [Google Scholar]
- 24.Sun JM, Liu TS. Stratigraphic evidence for the uplift of the Tibetan Plateau between ∼1.1 and 0.9 myr ago. Quaternary Res. 2000;54:309–320. [Google Scholar]
- 25.Tapponnier P, et al. Oblique stepwise rise and growth of the Tibet Plateau. Science. 2001;294:1671–1677. doi: 10.1126/science.105978. [DOI] [PubMed] [Google Scholar]
- 26.Harris N. The elevation history of the Tibetan Plateau and its implications for the Asian monsoon. Palaeogeogr Palaeoclimatol Palaeoecol. 2006;231:4–15. [Google Scholar]
- 27.Horton BK, et al. Paleocene-Eocene syncontractional sedimentation in narrow, lacustrine-dominated basins of east-central Tibet. Bull Geol Soc Am. 2002;114:771–786. [Google Scholar]
- 28.Liu ZF, Wang CS. Facies analysis and depositional systems of Cenozoic sediments in the Hoh Xil basin, northern Tibet. Sediment Geol. 2001;140:251–270. [Google Scholar]
- 29.Graham SA, Hendrix MS, Wang LB, Carroll AR. Collisional successor basins of western China: Impact of tectonic inheritance on sand composition. Bull Geol Soc Am. 1993;105:323–344. [Google Scholar]
- 30.Wang C, et al. Tertiary crustal shortening and peneplanation in the Hoh Xil region: Implications for the tectonic history of the northern Tibetan Plateau. J Asian Earth Sci. 2002;20:211–223. [Google Scholar]
- 31.Zhang Y, Zheng J. Geological Survey of the Hoh Xil and Adjacent Regions in Qinghai Province. Beijing: Seismological Press; 1994. [Google Scholar]
- 32.Liu Z, et al. Magnetostratigraphy of tertiary sediments from the Hoh Xil Basin: Implications for the Cenozoic tectonic history of the Tibetan Plateau. Geophys J Int. 2003;154:233–252. [Google Scholar]
- 33.Coward MP, et al. The structure of the 1985 Tibet Geotraverse, Lhasa to Golmud. Philos Trans R Soc London. 1988;327:307–336. [Google Scholar]
- 34.Spurlin MS, et al. Structural evolution of the Yushu-Nanqian region and its relationship to syncollisional igneous activity, east-central Tibet. Bull Geol Soc Am. 2005;117:1293–1317. [Google Scholar]
- 35.Roger F, et al. An Eocene magmatic belt across central Tibet: Mantle subduction triggered by the Indian collision? Terra Nova. 2000;12:102–108. [Google Scholar]
- 36.Houseman G, McKenzie DP, Molnar P. Convective instability of a thickened boundary layer and its relevance for the thermal evolution of continental convergent belts. J Geophys Res. 1981;86:6115–6132. [Google Scholar]
- 37.Platt JP, England PC. Convective removal of lithosphere beneath mountain belts: Thermal and mechanical consequences. Am J Sci. 1993;293:307–336. [Google Scholar]
- 38.Turner S, et al. Post-collision, shoshonitic volcanism on the Tibetan Plateau: Implications for convective thinning of the lithosphere and the source of ocean island basalts. J Petrol. 1996;37:45–71. [Google Scholar]
- 39.Chung SL, et al. Tibetan tectonic evolution inferred from spatial and temporal variations in post-collisional magmatism. Earth Sci Rev. 2005;68:173–196. [Google Scholar]
- 40.Ding L, Kapp P, Yue YH, Lai QZ. Postcollisional calc-alkaline lavas and xenoliths from the southern Qiangtang terrane, central Tibet. Earth Planet Sci Lett. 2007;254:28–38. [Google Scholar]
- 41.Ding L, Kapp P, Zhong DL, Deng WM. Cenozoic volcanism in Tibet: Evidence for a transition from oceanic to continental subduction. J Petrol. 2003;44:1833–1865. [Google Scholar]
- 42.Kapp P, et al. Geological records of the Lhasa-Qiangtang and Indo-Asian collisions in the Nima area of central Tibet. Bull Geol Soc Am. 2007;119:917–932. [Google Scholar]
- 43.Li GB, et al. Discovery of Paleogene marine stratum along the southern side of Yarlung-Zangbo suture zone and its implications in tectonics. Sci China Earth Sci. 2005;48:647–661. [Google Scholar]
- 44.Wang CS, Li XH, Hu XM, Jansa LF. Latest marine horizon north of Qomolangma (Mt Everest): Implications for closure of Tethys seaway and collision tectonics. Terra Nova. 2002;14:114–120. [Google Scholar]
- 45.Ding L, Kapp P, Wan XQ. Paleocene–Eocene record of ophiolite obduction and initial India–Asia collision, south central Tibet. Tectonics. 2005;24:TC3001. [Google Scholar]
- 46.Najman Y. The detrital record of orogenesis: A review of approaches and techniques used in the Himalayan sedimentary basins. Earth Sci Rev. 2006;74:1–72. [Google Scholar]
- 47.Kapp P, et al. The Gangdese retroarc thrust belt revealed. GSA Today. 2007;17:4–9. [Google Scholar]
- 48.England PC, Searle MP. The Cretaceous–Tertiary deformation of the Lhasa block and its implications for crustal thickening in Tibet. Tectonics. 1986;5:1–14. [Google Scholar]
- 49.Molnar P, Lyon-Caen H. Some simple physical aspects of the support, structure, and evolution of mountain belts. Spec Paper Geol Soc Am. 1988;218:179–207. [Google Scholar]
- 50.Dewey JF, Shackleton RM, Chang CF, Sun YY. The tectonic evolution of the Tibetan Plateau. Philos Trans R Soc Lond. 1988;327:379–413. [Google Scholar]
- 51.Edmond JM. Himalayan tectonics, weathering processes, and the strontium isotope record in marine limestones. Science. 1992;258:1594–1597. doi: 10.1126/science.258.5088.1594. [DOI] [PubMed] [Google Scholar]
- 52.Kirschvink JL. The least-square line and plane and the analysis of paleomagnetic data. Geophys J R Astron Soc. 1980;62:699–718. [Google Scholar]
- 53.Fisher RA. Dispersion on a sphere. Proc R Soc London Ser A. 1953;217:295–305. [Google Scholar]
- 54.Cande SC, Kent DV. Revised calibration of the geomagnetic polarity timescale for the Late Cretaceous and Cenozoic. J Geophys Res. 1995;100:6093–6095. [Google Scholar]
- 55.McDougall T, Harrison TM. Geochronology and Thermochronology by the 40Ar/39Ar Method. New York: Oxford Univ Press; 1999. [Google Scholar]
- 56.Ketcham RA, Donelick RA, Carlson WD. Variability of apatite fission-track annealing kinetics: III. Extrapolation to geologic time scales. Am Mineral. 1999;84:1235–1255. [Google Scholar]
- 57.Roelofs AK, Pisias NG. Revised technique for preparing quantitative radiolarian slides from deep-sea sediments. Micropaleontology. 1986;32:182–185. [Google Scholar]
- 58.Moore TC. In: Pisias NG, Mayer LA, Janecek TR, Palmer-Julson A, van Andel TH, editors. Proceedings of the Ocean Drilling Program, Scientific Results; College Station, TX: Ocean Drilling Program; 1995. pp. 191–232. [Google Scholar]
- 59.Zhao ZZ, Li YT, Ye HF, Zhang LW. Stratigraphy of the Qinghai-Tibetan Plateau. Beijing: Science Press; 2001. [Google Scholar]
- 60.Mo X, et al. Petrology and geochemistry of postcollisional volcanic rocks from the Tibetan plateau: Implications for lithosphere heterogeneity and collision-induced asthenospheric mantle flow. In: Dilek Y, Pavlides S, editors. Postcollisional Tectronics and Magmatism in the Mediterranean Region and Asia. Denver: Geol Soc Am; 2006. pp. 507–530. Spec Pap 409. [Google Scholar]
Associated Data
This section collects any data citations, data availability statements, or supplementary materials included in this article.


