Abstract
The osteoblast-specific secreted molecule osteocalcin behaves as a hormone regulating glucose metabolism and fat mass in two mutant mouse strains. Here, we ask two questions: is the action of osteocalcin on β cells and adipocytes elicited by the same concentrations of the molecule, and more importantly, does osteocalcin regulate energy metabolism in WT mice? Cell-based assays using isolated pancreatic islets, a β cell line, and primary adipocytes showed that picomolar amounts of osteocalcin are sufficient to regulate the expression of the insulin genes and β cell proliferation markers, whereas nanomolar amounts affect adiponectin and Pgc1α expression in white and brown adipocytes, respectively. In vivo the same difference exists in osteocalcin's ability to regulate glucose metabolism on the one hand and affect insulin sensitivity and fat mass on the other hand. Furthermore, we show that long-term treatment of WT mice with osteocalcin can significantly weaken the deleterious effect on body mass and glucose metabolism of gold thioglucose-induced hyperphagia and high-fat diet. These results establish in WT mice the importance of this novel molecular player in the regulation of glucose metabolism and fat mass and suggest that osteocalcin may be of value in the treatment of metabolic diseases.
Keywords: fat, insulin, diet-induced obesity, diet-induced diabetes, adiponectin
We recently showed that the uncarboxylated form of the osteoblast-specific secreted molecule osteocalcin functions as a hormone regulating glucose metabolism and fat mass (1). However, this unexpected role for osteocalcin had not previously been exclusively demonstrated in genetically modified animals such as the Osteocalcin−/− and Esp−/− mice (1, 2). The latter mouse model exhibits an osteocalcin gain of bioactivity. Data generated in these two animal models and cell-based assays showed that osteocalcin can increase β cell proliferation, stimulate insulin expression and secretion by pancreatic β cells, enhance energy expenditure, and increase expression of adiponectin, an insulin-sensitizing hormone produced by adipocytes (3, 4).
The next critical question to answer is whether the functions of osteocalcin on energy metabolism extend to WT animals. Moreover, if it is the case, one needs to know whether identical or different concentrations of osteocalcin are required to affect glucose metabolism and fat mass. Answers to these questions are of critical importance for two reasons. First, if osteocalcin has an effect in WT mice it would firmly establish the notion that it is a physiologically important hormone; second, it would start addressing the therapeutic potential of this new player in the regulation of energy metabolism.
Thus, we embarked on a systematic analysis of osteocalcin relevance in regulating energy metabolism in WT mice. We performed in vitro and in vivo assays to determine the doses of osteocalcin able to affect various aspects of energy metabolism and tested different doses of osteocalcin in WT mice fed either a normal diet or a diet favoring obesity and type 2 diabetes. We show here that different, but overlapping, amounts of osteocalcin, in the picomolar to nanomolar range, affect insulin secretion and β cell proliferation on the one hand and fat mass on the other hand. Moreover, osteocalcin can significantly decrease the severity of obesity and type 2 diabetes in WT mice raised under conditions favoring appearance of these two diseases.
Results and Discussion
Differential Effects of Osteocalcin on Islet, β Cell, and Adipocyte Gene Expression.
To define the conditions to best assess the effect of osteocalcin in vivo in WT mice we first asked whether similar or different amounts of this molecule were necessary to affect gene expression in various cell types in cell culture. We had shown previously that osteocalcin can enhance insulin expression 50% above basal level when using primary mouse islets prepared and treated the same day. In the experiments presented here, islets were left to recover overnight before treatment, and as a result we saw up to a 6-fold increase in insulin gene expression after osteocalcin treatment. This large amplitude of the effect of osteocalcin allowed us to perform a dose–response experiment.
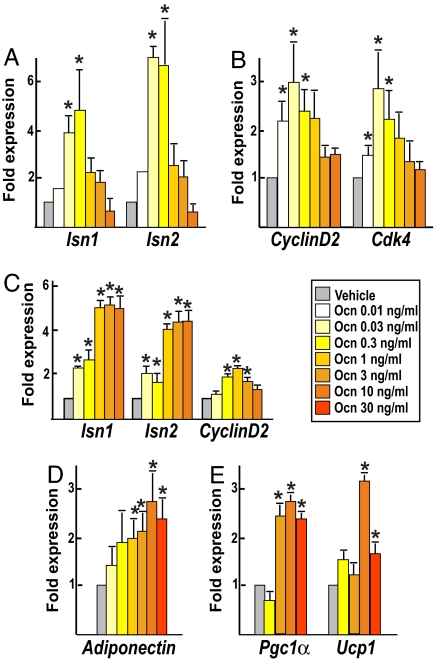
Uncarboxylated osteocalcin concentration is ≈7 ng/ml in WT adult mice (1). Thus, in these experiments we used amounts of osteocalcin ranging 200-fold lower than its physiological concentration to 4-fold higher. At a concentration as low as 0.03 ng/ml (6 pM) osteocalcin already doubled expression of the two mouse insulin genes, Ins1 and Ins2 (5) (Fig. 1A). At 0.3 ng/ml (60 pM) osteocalcin triggered up to a 6-fold increase in Ins1 expression, indicating that at a quite low concentration it is a powerful regulator of insulin expression. Remarkably, at concentrations >0.3 ng/ml, the effect of osteocalcin on insulin expression was progressively reduced (Fig. 1A). In islets, osteocalcin also induced expression of CyclinD2 and Cdk4, two genes necessary for β cell proliferation in vivo (6, 7), with a dose–response similar to the one observed for insulin expression (Fig. 1B). To determine whether osteocalcin acts on β cells directly, we treated MIN6 cells, a mouse β cell line that retains glucose-induced insulin secretion capability (8), with osteocalcin. Expression of both insulin genes and CyclinD2 was increased at doses of osteocalcin as low as 0.3 ng/ml (Fig. 1C). Taken together, these data indicate that in vitro β cell proliferation and insulin expression are significantly affected by relatively low concentrations of osteocalcin, ranging from 0.03 to 0.3 ng/ml, i.e., 6–60 pM.
Fig. 1.
Different doses of osteocalcin affect gene expression in β cells and adipocytes. Real-time PCR analysis of gene expression in pancreatic islets (A and B), MIN6 β cells (C), and primary white (D) or brown (E) adipocytes treated for 4 h with the indicated concentrations of osteocalcin (Ocn) or vehicle is shown. (A) Expression of Ins1, Ins2 insulin genes. (B) Expression of CyclinD2 and Cdk4. (C) Expression of Ins1, Ins2 insulin genes and CyclinD2. (D) Expression of adiponectin (white adipocytes). (E) Expression of Pgc1α and Ucp1 (brown adipocytes). All experiments were repeated three times in duplicate. Results are mean values ± SEM. *, P < 0.05 (osteocalcin vs. vehicle, Student's t test).
We next asked whether similar amounts of osteocalcin were sufficient to affect adipocyte gene expression. To that end, we measured the expression of adiponectin, a regulator of insulin sensitivity, in white adipocytes (1, 3, 4), and Pgc1α and Ucp1, two molecular markers of energy expenditure (9), in brown adipocytes, treated with osteocalcin ex vivo. As shown in Fig. 1D, whereas adiponectin expression was not significantly increased by concentrations of osteocalcin <1 ng/ml its expression was maximally enhanced by amounts of osteocalcin ranging from 10 to 30 ng/ml. Likewise, expression of Pgc1α and Ucp1 in brown adipocytes was maximally increased at doses of osteocalcin >3 ng/ml (Fig. 1E). Although still in the nanomolar range those concentrations are about one order of magnitude higher than what is necessary to induce gene expression in primary pancreatic β cells. Taken together, the results of these cell-based assays indicate that overlapping, but different, amounts of osteocalcin are required to regulate β cell and adipocyte gene expression.
Differential Effects of Osteocalcin on Glucose Metabolism and Fat Mass in Vivo.
In light of these results, we then tested whether different amounts of osteocalcin were required to affect insulin secretion, insulin sensitivity, and fat mass in WT mice. To address this question, we implanted pumps delivering various hourly amounts of osteocalcin in 8-week-old WT mice, measured blood glucose levels, performed metabolic tests and analyzed gene expression, serum parameters, and fat mass 4 weeks later.
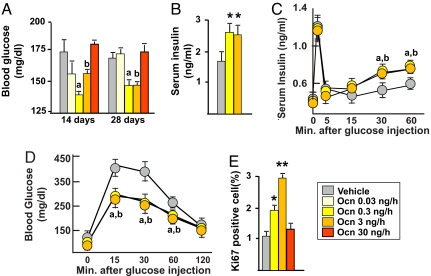
Mice implanted with pumps delivering osteocalcin at 0.3 or 3 ng/h displayed significantly lower blood glucose levels than mice implanted with pumps delivering vehicle; this hypoglycemia was concomitant with an increase in serum insulin level (Fig. 2 A and B). Remarkably, in mice infused with a high rate (30 ng/h) of osteocalcin there was no decrease in blood glucose levels (Fig. 2A). Consistent with an increased in serum insulin levels, glucose-stimulated insulin secretion (GSIS) tests showed that insulin secretion was significantly improved in WT mice infused with either 0.3 or 3 ng/h of osteocalcin (Fig. 2C). As a result of this increase in insulin secretion, tolerance to glucose, measured by glucose tolerance test (GTT), was also significantly improved in WT mice infused with 0.3 and 3 ng/h of osteocalcin (Fig. 2D). In contrast, WT mice implanted with pumps delivering either 0.03 or 10 ng/h of osteocalcin behaved like mice receiving vehicle [supporting information (SI) Fig. 6]. This effect of osteocalcin extended to cell proliferation because Ki67 immunostaining in pancreas showed that β cell proliferation was increased 2- and 3-fold in mice infused with 0.3 and 3 ng/h of osteocalcin, respectively, whereas it was not increased in mice infused with 30 ng/h (Fig. 2E). These results establish that in vivo, as it is the case in vitro, low amounts of osteocalcin up-regulate insulin secretion and β cell proliferation, whereas higher amounts do not.
Fig. 2.
Low doses of osteocalcin increase insulin secretion and β cell proliferation in WT mice. Analyses were performed in mice implanted with osmotic pumps infusing the indicated doses of osteocalcin (Ocn) or vehicle for 14 days (A) and 28 days (A–E). (A) Blood glucose (random feeding). (B) Serum insulin. (C) GSIS. (D) GTT. (E) Quantification of Ki67 immunoreactive cells in pancreatic islets. Results are mean values ± SEM. *, P < 0.05; **, P < 0.01 (Ocn vs. vehicle, Student's t test). a, P < 0.05 (Ocn 0.3 ng/h vs. vehicle); b, P < 0.05 (ANOVA) (Ocn 3 ng/h vs. vehicle). Six to 20 mice per group were analyzed.
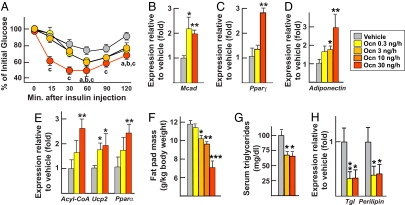
Next, we asked what amounts of osteocalcin were required to regulate insulin sensitivity. To that end we performed insulin tolerance tests (ITTs). Mice implanted with pumps delivering 0.3 and 3 ng/h of osteocalcin showed significantly greater insulin sensitivity than mice receiving vehicle (Fig. 3A). However, and in contrast to what we observed for β cell proliferation and insulin secretion, insulin sensitivity was further improved in mice implanted with pumps delivering 30 ng/h of osteocalcin (Fig. 3A). Accordingly, molecular studies showed that expression of Mcad, a marker of insulin sensitivity in muscle (10, 11), was increased in mice implanted with pumps delivering 0.3 and 30 ng/h of osteocalcin (Fig. 3B), as was expression of Pparγ, a marker of insulin sensitivity in white fat (Fig. 3C). Consistent with this increase in insulin sensitivity, gene expression of adiponectin, an insulin-sensitizing hormone whose expression is down-regulated in Osteocalcin −/− mice, was up-regulated in a dose-dependent manner by osteocalcin at doses ranging from 0.3 to 30 ng/h in WT mice (Fig. 3D). Consequently, expression of adiponectin target genes, including Acyl-CoA, Ucp2, and Pparα (12, 13), was also significantly increased in white fat of mice implanted with pumps delivering osteocalcin at 30 ng/h and to a lesser extent in mice receiving 0.3 ng/h of osteocalcin (Fig. 3E).
Fig. 3.
Osteocalcin favors insulin sensitivity and decreases fat mass in WT mice. All analyses compare mice implanted for 28 days with osmotic pumps delivering the indicated doses of osteocalcin (Ocn) or vehicle. Gene expression was analyzed by real-time PCR (B–E and H). (A) ITT (insulin injection: 0.5 units/kg). (B) Expression of Mcad in muscle. (C) Expression of Pparγ in white fat. (D) Expression of adiponectin in white fat. (E) Expression of adiponectin target genes in white fat. (F) Fat pad mass. (G) Serum triglycerides. (H) Expression of markers of lipolysis in fat. Results are mean values ± SEM. *, P < 0.05; **, P < 0.01; ***, P < 0.001 (Ocn vs. vehicle, Student's t test). a, P < 0.05 (Ocn 0.3 ng/h vs. vehicle); b, P < 0.05 (Ocn 3 ng/h vs. vehicle); P < 0.05; c, P < 0.05 (Ocn 30 ng/h vs. vehicle) (ANOVA). Six to 20 mice per group were analyzed.
Because Esp−/− mice are lean, we next assessed whether osteocalcin could decrease fat mass in WT mice (1). Here, we studied mice implanted with pumps delivering amounts of osteocalcin ranging from 0.3 to 30 ng/h. We did not detect any effect of osteocalcin infusion on food intake and body weight of WT mice fed a regular diet (SI Fig. 7). However, as shown in Fig. 3 F and G, mice receiving 3, 10, and 30 ng/h of osteocalcin exhibited a significant and dose-dependent decrease in fat pad mass and serum triglycerides concentration. In these mice, there was also a decrease in expression of Perilipin and Triglyceride lipase (Tgl), two genes proposed to be regulated by osteocalcin (1, 14, 15) (Fig. 3H). Taken together, these results confirm the in vitro observations and suggest that overlapping, but different, amounts of osteocalcin are required to affect insulin secretion, insulin sensitivity, and fat mass.
Osteocalcin Weakens the Development of Obesity and Diabetes in WT Mice.
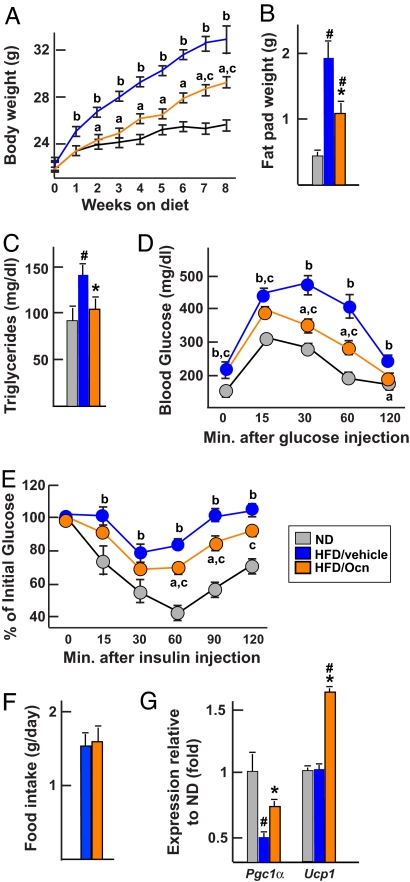
Given the remarkable efficacy of osteocalcin infusion in WT mice, we began to evaluate the potential therapeutic relevance of this molecule by testing its effect in two models of obesity. First, we used a classical model of diet-induced obesity (16). Three groups of WT mice were studied: one fed a normal diet and implanted with placebo pellets, a second fed a high-fat diet and implanted with pellets releasing 3 ng/h of osteocalcin, and a third also fed a high-fat diet but implanted with placebo pellets. As expected, mice fed the high-fat diet and not receiving osteocalcin became obese over a period of 8 weeks and developed glucose intolerance and insulin insensitivity as measured by GTT and ITT, respectively (Fig. 4 A–E). On the other hand, mice fed the high-fat diet and receiving osteocalcin gained significantly less weight and had significantly smaller fat pads and normal levels of triglycerides (Fig. 4 A–C). They were also significantly less glucose-intolerant and more insulin-sensitive than WT mice fed the same diet but without osteocalcin (Fig. 4 D and E). No significant differences in food intake could be observed between the groups of mice implanted with osteocalcin or placebo pellets (Fig. 4F). To determine molecularly whether the protective effect of osteocalcin was secondary, at least in part, to an increase in energy expenditure we measured the expression of Pcg1α and Ucp1 in brown adipose tissue (9). As shown in Fig. 4G, expression of these genes was significantly higher in mice implanted with a pellet delivering osteocalcin than in mice implanted with a placebo pellet.
Fig. 4.
Osteocalcin prevents diet-induced obesity and diabetes. All analyses compare mice fed a normal diet (ND) or a high-fat diet (HFD) and implanted with osteocalcin (Ocn, 3 ng/h) or placebo pellets. (A) Body weight. (B) Fat pad weight. (C) Serum triglycerides. (D) GTT. (E) ITT (insulin injection: 0.75 units/kg). (F) Food intake. (G) Expression of Pgc1α and Ucp1 in brown fat (real-time PCR). Results are mean values ± SEM. *, P < 0.05 (Ocn vs. placebo, Student's t test). #, P < 0.05 (HFD vs. ND, Student's t test). a, P < 0.05 (Ocn vs. placebo); b, P < 0.05 (HFD vs. ND); c, P < 0.05 (Ocn vs. ND) (ANOVA). Six to nine mice per group were analyzed.
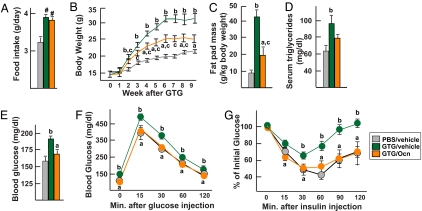
We also tested the effect of osteocalcin on a model of obesity and glucose intolerance induced by hyperphagia. Four-week-old WT mice were injected with gold thioglucose (GTG) to destroy the neurons of the ventromedial hypothalamic nuclei (17). Two weeks later PBS- and GTG-injected mice were implanted with pumps delivering 3 ng/h of osteocalcin or vehicle. GTG increased food intake to the same extent in mice implanted with pumps delivering osteocalcin or vehicle, indicating that neurons controlling appetite has been destroyed in both cases (Fig. 5A). Eight weeks later, the mice were killed and GTG-induced lesions were verified histologically (SI Fig. 8). GTG-injected mice infused with 3 ng/h of osteocalcin gained significantly less weight and had a significantly reduced fat mass and decreased serum triglycerides levels compared with mice infused with vehicle (Fig. 5 B–D). Moreover, when studying blood glucose levels after random feeding, glucose tolerance through GTT, and insulin sensitivity through ITT there was no difference between PBS-injected and GTG-injected mice treated with 3 ng/h of osteocalcin, whereas GTG-injected mice treated with vehicle were glucose-intolerant and insulin-insensitive (Fig. 5 E–G). Taken together, these data show that whether we use a model of hyperphagia (GTG lesioning) or diet-induced obesity osteocalcin protects to a large extend against obesity and type 2 diabetes.
Fig. 5.
Osteocalcin prevents GTG-induced obesity and diabetes. All analyses compare mice injected with PBS or GTG that 2 weeks later were implanted for 28 days with osmotic pumps delivering 3 ng/h of osteocalcin (Ocn) or vehicle. (A) Food intake. (B) Body weights. (C) Fat pad mass. (D) Serum triglycerides. (E) Blood glucose (random feeding). (F) GTT. (G) ITT (insulin injection: 0.75 units/kg). Results are mean values ± SEM. *, P < 0.05 (Ocn vs. vehicle, Student's t test). #, P < 0.05 (vehicle or Ocn vs. PBS, Student's t test). a, P < 0.05 (Ocn vs. vehicle); b, P < 0.05 (PBS vs. GTG); c, P < 0.05 (Ocn vs. PBS) (ANOVA). Six to 11 mice per group were analyzed.
This study extends our recent results in several points. First, we show here that osteocalcin acts directly on β cells in culture, thus suggesting that this is the mechanism whereby it regulates β cell mass and insulin expression in vivo. Second, we show that, unexpectedly, different amounts of osteocalcin are required to regulate β cell proliferation and insulin secretion on the one hand and fat mass and insulin sensitivity on the other hand. In both cases, the amount of osteocalcin required is relatively low, ranging from picomolar to nanomolar amounts. Third, we provide evidence that osteocalcin acts in WT mice to improve glucose handling and reduce fat mass, and that as a result it can reduce the severity of obesity and type 2 diabetes. All of these results were obtained through continuous delivery of osteocalcin. It remains to be determined whether intermittent delivery of that hormone will have the same effects as is the case for insulin or instead will have paradoxical effects as is the case for the parathyroid hormone (18, 19).
Regardless of this latter concern, the results presented here indicate that fostering our knowledge of the mechanisms of action of osteocalcin would enhance our understanding of the overall regulation of energy metabolism. We assume that like most hormones osteocalcin acts through a receptor located on target cells. At the present time the identity of this receptor is unknown. Given the remarkable effects of osteocalcin described here in WT mice, another question to be addressed is to determine whether its metabolic functions are also present in other vertebrate species.
Materials and Methods
Recombinant Osteocalcin Purification.
Purification of bacterially produced mouse recombinant uncarboxylated osteocalcin was performed as described (1). Briefly, GST-osteocalcin fusion protein was bacterially produced and purified on glutathione-Sepharose according to standard procedures. After extensive washes, osteocalcin was then cleaved out from the GST moiety by using thrombin. A HiTrap Benzamidine column was subsequently used to deplete the thrombin from the preparation. Purity (>95%) of the osteocalcin preparation was assessed by Tris-Tricine SDS/PAGE stained with Coomassie (SI Fig. 9). Concentration and integrity of the recombinant osteocalcin protein was precisely determined by using osteocalcin RIA (Immunotopic). Endotoxin concentration in the recombinant osteocalcin preparations used for infusion was determined as below the detection limit (0.12 EU) by using the Limulus Amebocyte Lysate assay (Cambrex).
Animals and Surgery.
C57BL/6J mice were purchased from The Jackson Laboratory. They were implanted s.c. with 28-day osmotic pumps (Alzet) filled with a solution of recombinant osteocalcin or vehicle or with 3-month delivery custom-made osteocalcin (3 ng/h delivery) or placebo pellets (Innovative Research of America). For GTG lesioning, 4-week-old females were injected with a single dose of GTG (0.5 mg/g) or with PBS after an overnight fast and were implanted with osmotic pumps 2 weeks later. High-fat diet contained 58% fat (Research Diets D12331).
Blood Parameters Measurement.
Morning blood glucose was measured with an Accu-check glucometer (Roche). Serum insulin was measured with an ELISA kit (Crystal Chem). Serum triglycerides were measure by a standard colorimetric assay (Sigma).
Metabolic Tests.
GTT was performed after overnight fasting. Two grams/kg of glucose was administrated through an i.p. injection, and blood glucose was measured at the indicated time points. In experiments involving glucose-intolerant mice, animals were fasted for only 4 h and 1g/kg of glucose was injected. An ITT was performed after 4 h of fasting: insulin (Sigma; 0.5 or 0.75 units/kg) was injected i.p., and blood glucose was measured at the indicated time points. In the GSIS test, glucose was injected (3 g/kg) in mice after an overnight fast. Serum was then collected from tail veins at the indicated times. Serum insulin was subsequently measured by ELISA.
Primary Cells Isolation and Culture.
Primary adipocytes were isolated from gonadal fat pads (white adipocytes) or interscapular brown fat (brown adipocytes), dissected, and minced in PBS. Tissues were digested for 1 h at 37°C in 1 mg/ml collagenase (in KRP buffer; 20 mM HEPES, 120 mM NaCl, 6 mM KCl, 1.2 mM MgSO4, 1 mM CaCl2, 0.6 mM Na2HPO4, 0.4 mM NaH2PO4, 2.5 mM d-glucose, 2% BSA, pH 7.4) as described (1, 20). After filtration the brown adipocytes were centrifuged and plated in DMEM (25 mM glucose), 20% FBS, and 20 mM Hepes. Twenty-four hours later, cells were washed and starved for 4 h in DMEM, 1% FBS, and 20 mM Hepes and then treated with osteocalcin for 4 h. Purified white fat adipocytes were directly cultured for 1 h in αMEM supplemented with 1% FBS before 4-h treatments with various concentrations of osteocalcin or vehicle. Primary islets were isolated as described (1, 21). Briefly, after clamping the common bile duct at its entrance to the duodenum, ducts were canulated and pancreas were injected with 3 ml of a collagenase P (0.5 mg/ml; Roche) solution in complete HBSS (HBSS 1× supplemented with 20 mM Hepes, pH 7.4, and 2 mM CaCl2). Dissected pancreata were then digested in 5 ml of complete HBSS for 15 min, after which they were disrupted by shaking. Islets were subsequently purified through Histopaque 1077 density centrifugation (Sigma). Islets were then cultured for 1 h at 37°C in CMRL medium (Gibco) supplemented with 10% FCS, handpicked, and cultured in the same medium overnight before being treated for 4 h with various concentration of osteocalcin or vehicle in αMEM supplemented with 1% FBS. MIN6 cells were maintained in DMEM (25 mM glucose), 2 mM glutamine, 15% FBS, and 70 μM 2-mercaptoethanol as described (8). The day before treatment they were switched to DMEM, low glucose (5.5 mM), and 15% FBS medium and allowed to equilibrate overnight. The third day, cells were starved in DMEM, low glucose, and 1% FBS for 4 h and then treated with various concentrations of osteocalcin for 4 h.
Gene Expression Analyses and Histology.
Real-time PCR was performed on DNaseI-treated total RNA converted to cDNA by using primers from SuperArray and the TaqSYBR Green Supermix (Bio-Rad) with carboxy-X-rhodamine on an MX3000 instrument. β-Actin amplification was used as an internal reference. For Ki67 labeling pancreatic tissues were fixed in 10% PBS/formalin, embedded in paraffin, and sectioned at 5 μm. Sections were immunostained with a mouse anti-Ki67 (Vector; 1:100) antibody and an ABC Elite kit (Vector).
Statistics.
Results are given as means ± SEM. Statistical analyses were performed by using unpaired, two-tailed Student's t, or ANOVA tests.
Supplementary Material
Acknowledgments.
We thank T. Li, X. Liu, and S. Houlihan for assistance; Dr. C. Confavreux for help with the statistical analysis; Dr J. I. Miyazaki (Osaka University, Osaka, Japan) for providing MIN6 cells; G. Jhala and T. Kay for suggestions and advice on islets isolation; and Dr. N. Bergenhem for critical reading of the manuscript. This work was supported by fellowships from the Fond de la Recherche en Santé du Québec (to M.F.) and the Japan Society for the Promotion of Science (to E.H.) and grants from the National Institutes of Health (to G.K.).
Footnotes
The authors declare no conflict of interest.
This article contains supporting information online at www.pnas.org/cgi/content/full/0711119105/DC1.
References
- 1.Lee NK, Sowa H, Hinoi E, Ferron M, Ahn JD, Confavreux C, Dacquin R, Mee PJ, McKee MD, Jung DY, et al. Cell. 2007;130:456–469. doi: 10.1016/j.cell.2007.05.047. [DOI] [PMC free article] [PubMed] [Google Scholar]
- 2.Ducy P, Desbois C, Boyce B, Pinero G, Story B, Dunstan C, Smith E, Bonadio J, Goldstein S, Gundberg C, et al. Nature. 1996;382:448–452. doi: 10.1038/382448a0. [DOI] [PubMed] [Google Scholar]
- 3.Yamauchi T, Kamon J, Waki H, Terauchi Y, Kubota N, Hara K, Mori Y, Ide T, Murakami K, Tsuboyama-Kasaoka N, et al. Nat Med. 2001;7:941–946. doi: 10.1038/90984. [DOI] [PubMed] [Google Scholar]
- 4.Kubota N, Terauchi Y, Yamauchi T, Kubota T, Moroi M, Matsui J, Eto K, Yamashita T, Kamon J, Satoh H, et al. J Biol Chem. 2002;277:25863–25866. doi: 10.1074/jbc.C200251200. [DOI] [PubMed] [Google Scholar]
- 5.Duvillie B, Cordonnier N, Deltour L, Dandoy-Dron F, Itier JM, Monthioux E, Jami J, Joshi RL, Bucchini D. Proc Natl Acad Sci USA. 1997;94:5137–5140. doi: 10.1073/pnas.94.10.5137. [DOI] [PMC free article] [PubMed] [Google Scholar]
- 6.Rane SG, Dubus P, Mettus RV, Galbreath EJ, Boden G, Reddy EP, Barbacid M. Nat Genet. 1999;22:44–52. doi: 10.1038/8751. [DOI] [PubMed] [Google Scholar]
- 7.Kushner JA, Ciemerych MA, Sicinska E, Wartschow LM, Teta M, Long SY, Sicinski P, White MF. Mol Cell Biol. 2005;25:3752–3762. doi: 10.1128/MCB.25.9.3752-3762.2005. [DOI] [PMC free article] [PubMed] [Google Scholar]
- 8.Miyazaki J, Araki K, Yamato E, Ikegami H, Asano T, Shibasaki Y, Oka Y, Yamamura K. Endocrinology. 1990;127:126–132. doi: 10.1210/endo-127-1-126. [DOI] [PubMed] [Google Scholar]
- 9.Uldry M, Yang W, St-Pierre J, Lin J, Seale P, Spiegelman BM. Cell Metab. 2006;3:333–341. doi: 10.1016/j.cmet.2006.04.002. [DOI] [PubMed] [Google Scholar]
- 10.Bogacka I, Xie H, Bray GA, Smith SR. Diabetes. 2005;54:1392–1399. doi: 10.2337/diabetes.54.5.1392. [DOI] [PubMed] [Google Scholar]
- 11.Tolwani RJ, Hamm DA, Tian L, Sharer JD, Vockley J, Rinaldo P, Matern D, Schoeb TR, Wood PA. PLoS Genet. 2005;1:e23. doi: 10.1371/journal.pgen.0010023. [DOI] [PMC free article] [PubMed] [Google Scholar]
- 12.Yamauchi T, Kamon J, Waki H, Imai Y, Shimozawa N, Hioki K, Uchida S, Ito Y, Takakuwa K, Matsui J, et al. J Biol Chem. 2003;278:2461–2468. doi: 10.1074/jbc.M209033200. [DOI] [PubMed] [Google Scholar]
- 13.Yoon MJ, Lee GY, Chung JJ, Ahn YH, Hong SH, Kim JB. Diabetes. 2006;55:2562–2570. doi: 10.2337/db05-1322. [DOI] [PubMed] [Google Scholar]
- 14.Haemmerle G, Lass A, Zimmermann R, Gorkiewicz G, Meyer C, Rozman J, Heldmaier G, Maier R, Theussl C, Eder S, et al. Science. 2006;312:734–737. doi: 10.1126/science.1123965. [DOI] [PubMed] [Google Scholar]
- 15.Martinez-Botas J, Anderson JB, Tessier D, Lapillonne A, Chang BH, Quast MJ, Gorenstein D, Chen KH, Chan L. Nat Genet. 2000;26:474–479. doi: 10.1038/82630. [DOI] [PubMed] [Google Scholar]
- 16.Rossmeisl M, Rim JS, Koza RA, Kozak LP. Diabetes. 2003;52:1958–1966. doi: 10.2337/diabetes.52.8.1958. [DOI] [PubMed] [Google Scholar]
- 17.Brecher G, Laqueur GL, Cronkite EP, Edelman PM, Schwartz IL. J Exp Med. 1965;121:395–401. doi: 10.1084/jem.121.3.395. [DOI] [PMC free article] [PubMed] [Google Scholar]
- 18.Champion MC, Shepherd GA, Rodger NW, Dupre J. Diabetes. 1980;29:206–212. doi: 10.2337/diab.29.3.206. [DOI] [PubMed] [Google Scholar]
- 19.Tam CS, Heersche JN, Murray TM, Parsons JA. Endocrinology. 1982;110:506–512. doi: 10.1210/endo-110-2-506. [DOI] [PubMed] [Google Scholar]
- 20.Fasshauer M, Klein J, Kriauciunas KM, Ueki K, Benito M, Kahn CR. Mol Cell Biol. 2001;21:319–329. doi: 10.1128/MCB.21.1.319-329.2001. [DOI] [PMC free article] [PubMed] [Google Scholar]
- 21.McKenzie MD, Dudek NL, Mariana L, Chong MM, Trapani JA, Kay TW, Thomas HE. Int Immunol. 2006;18:837–846. doi: 10.1093/intimm/dxl020. [DOI] [PubMed] [Google Scholar]
Associated Data
This section collects any data citations, data availability statements, or supplementary materials included in this article.


