

Abstract
The feasibility of using Gd dendrimer-based macromolecules (Gd-G8 dendrimer) as a dual CT and MR contrast agent for monitoring convection-enhanced delivery (CED) of therapy in the brain is evaluated both in vitro and in vivo with optimal dosing established. In vitro CT attenuation values of the Gd-based agents (~6.0 HU/mM) were ~1.6 times greater than iodine-based agents and the attenuation of the Gd-DTPA was comparable to Gd-G8 dendrimer. Visible enhancement was observed on both CT and MR using Gd-G8 dendrimer over a range of 23–78 mM, however, a concentration of at least 47 mM in Gd was required for adequate delineation of the injection site on both CT and MR. MR offers greater sensitivity than CT in estimating the volume of distribution (Vd) and effectively quantified the agent’s concentration and diffusion using T1 mapping at much lower concentrations of Gd (<10mM in [Gd]).
Keywords: contrast agent, computed tomography, magnetic resonance, Gd-based agent, dendrimer
Introduction
Each year approximately 20,000 patients are diagnosed with primary malignant brain tumors in the United States with ~13,000 deaths [1]. Aggressive combinations of surgical resection, radiation and chemotherapy often fail to significantly prolong survival. In part, this is related to the inability of therapeutic agents to cross the blood brain barrier (BBB) [2]. Moreover, systemic delivery of drugs capable of crossing the BBB (<1% of the plasma concentration [2]) can lead to significant toxicity. In view of the disadvantages of current therapies, delivery techniques which bypass the BBB and administer therapeutics directly within the tumor have been developed. Direct injection of a therapeutic actually relies on the intact BBB to partially confine the therapeutic agent within the tumor rather than exclude it as is the case with intravascular drugs. Convection-enhanced delivery (CED) was developed to homogeneously distribute small-to large-MW therapeutic agents with an effective volume of distribution (Vd) that is linearly proportional to the volume of infusion (Vi) [3]. Factors affecting CED and the resultant distribution of the drug are: a) target location (gray vs white matter), b) tissue density, c) tumor permeability, d) interstitial pressure, e) the agent’s inherent properties such as molecular weight, viscosity, polarity and target avidity, and f) volume of infusion [2,3]. However, bulk flow fluid dynamics within tumor tissue are substantially different from that of normal brain and consequentially less predictable. Because of the unpredictability of the fate of infusate in the brain, there is a need to monitor the distribution of CED-administered agents.
Imaging contrast agents can be mixed with the infusate during CED to monitor the distribution of a size-matched drug provided they have similar convective properties. Computed tomography (CT) and magnetic resonance imaging (MRI) are ideal modalities for this because of their high spatial and temporal resolution. CT has the advantage of direct quantification of the contrast agent since x-ray attenuation (i.e. signal intensity) is linearly related to the agent’s concentration [4]. Although MRI provides better anatomic contrast without ionizing radiation and higher agent sensitivity than CT, the relationship of signal intensity to agent concentration is more complex and sensitive to systematic errors in the imaging parameters. To quantify the concentration of the contrast agent by MR, a T1 map must first be generated from T1-weighted images which are then used to calculate Gd concentration ([Gd]) map [5].
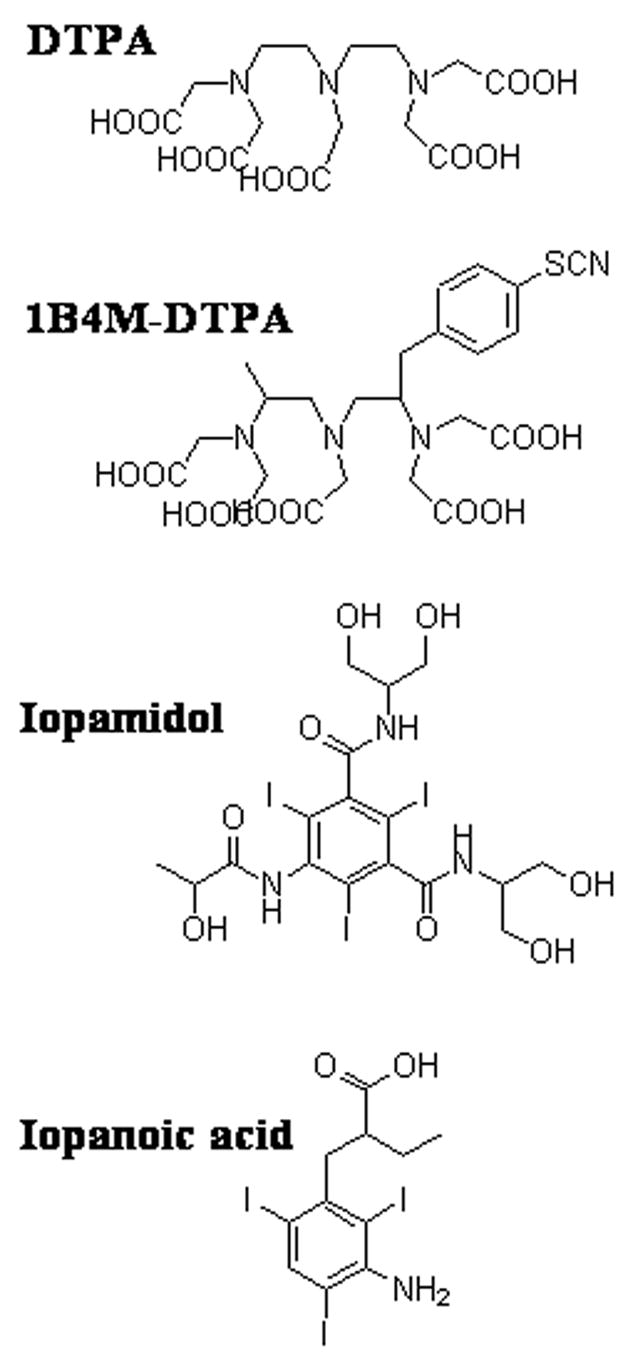
Low molecular weight (LMW) Gd agents have been used clinically for both MR and CT imaging after intravenous or intra-arterial administration; however, they are inappropriate surrogate markers for CED due to their rapid clearance rate. Macromolecular Gd agents based on albumin [6] and liposomes [7] have been used to monitor CED by MRI in rodents and non-human primates. In this study we examine the use of Gd-based dendrimers as surrogate markers for monitoring drug distribution. Gadolinium-labeled dendrimers offer several desirable features such as biocompatibility, monodispersity, in vivo stability, and may be created in different sizes (i.e., generations) [8,9] enabling them to be matched in size with different therapeutic agents. They are also an attractive platform for multimodal imaging due to the large number of terminal surface functional groups available for modification (Figure 1). Conjugation of bifunctional chelates such as 2-(4-isothiocyanatobenzyl)-6-methyl-diethylenetriaminepentaacetic acid (1B4M-DTPA) (Figure 2) to the dendrimer surface allows for chelation of a large number of Gd(III) ions for imaging with CT and MR.
Figure 1.
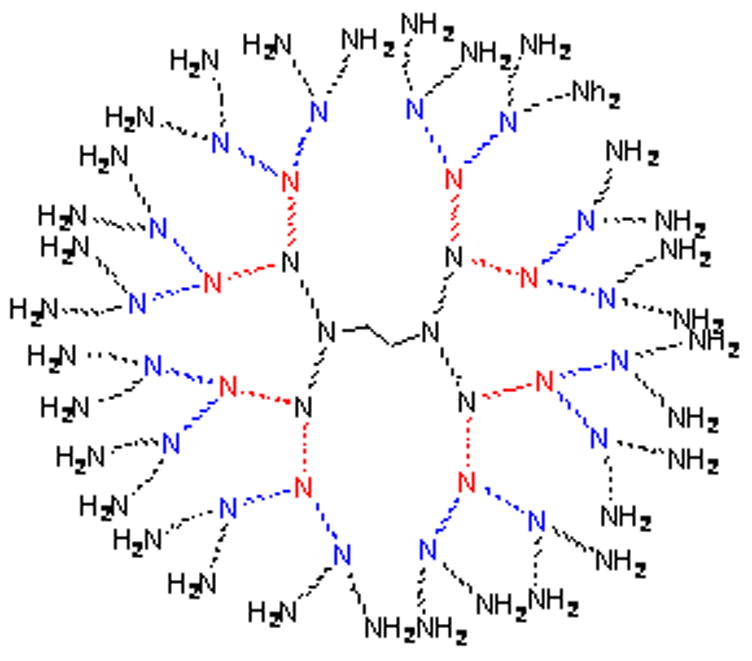
Figure 2.
Herein, we report on the feasibility of generation-8 PAMAM dendrimer conjugated with Gd(III)-1B4M-DTPA (Gd-G8 dendrimer) as a dual-modality imaging agent and as a surrogate marker for CED are reported.
Results
Synthesis and Characterization of Gd-G8 Dendrimer
The chelate, 1B4M-DTPA, is well-established to give stable Gd-complexes in vivo [10]. The thiourea linkage utilized to conjugate the bifunctional derivative of DTPA, 1B4M-DTPA, to G8 dendrimer possesses well-established stability and general usage. A ~2.5-fold excess of 1B4M-DTPA per terminal amino group was used to maximize the number of chelates on the dendrimer. Purification of the chelated-dendrimer (precursor 1) is achieved through exhaustive diafiltration and monitored by SE-HPLC. The average number of chelates covalently bound to the dendrimer was estimated as ~500 (49 % conjugation) out of the 1024 theoretically available amino terminal groups in the G8 dendrimer as established from the elemental analysis. This low saturation yield is attributed to the decreasingly available terminal amino groups with increasing steric hindrance encountered as the conjugation reaction proceeds. Another factor is the presence of imperfections in the core dendrimer which may have less than the ideal 1024 terminal amino groups [8].
The number of Gd(III) atoms incorporated in the chelated-dendrimer (1) was established through ICP-AES by measuring the %Gd by weight of dendrimer. Non-specifically bound Gd(III) was removed via diafiltration and the filtrate checked for free Gd(III) ions using an Arsenazo III assay [11]. As with the precursor 1, SE-HPLC analysis demonstrated the purity and molecular size of Gd-G8 dendrimer. From the elemental analyses of the Gd-G8 dendrimer and the precursor 1, the average number of Gd incorporated was ~355 (~71% of the available chelates) per Gd-G8 dendrimer. This Gd number was also correlated with the the difference between the number of chelates before and after Gd(III) incorporation determined by using an Arsenazo III assay [12].
In Vitro Evaluation of Gd-G8 dendrimer
The r1 and r2 relaxivities at 3-Tesla of the Gd-G8 dendrimer were 12.76 ± 0.03 and 42.08 ± 0.38 (mM Gd)−1s−1, respectively, versus 5.11 ± 0.11 and 5.44 ± 0.06 (mM Gd) −1s−1, respectively, for Gd-DTPA. The increase in the relaxivities (r1 and r2) of the Gd-G8 dendrimer was observed to correlate to the increased molecular size of Gd(III) dendrimers [13,14].
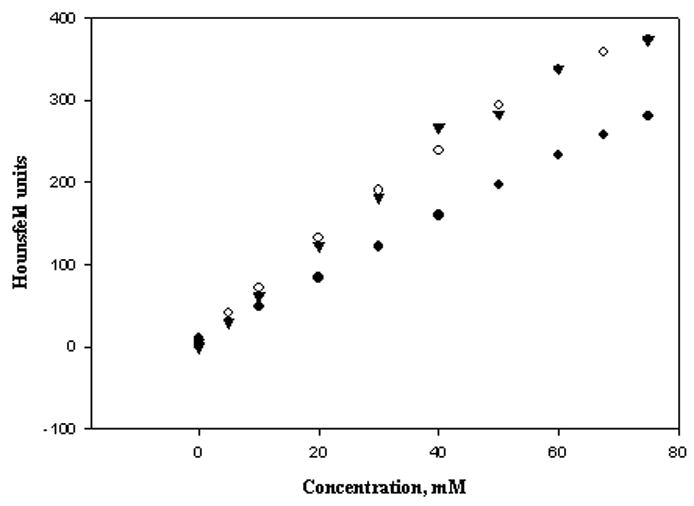
A linear relationship between concentration and CT attenuation values for all four contrast agents (r2 = 0.9968 Gd-G8 dendrimer, 0.9991 Gd-DTPA, 0.9992 iopamidol, 0.9652 iopanoic acid) was observed. As expected from the K-edge properties (50 keV for Gd(III) vs. 33.2 keV for I [15]), Gd-based contrast agents demonstrated higher CT attenuation than iodine-based ones under the same conditions (Table 1). The attenuation of the Gd-based agents (Gd-G8 dendrimer 6.01 ± 0.11 and Gd-DTPA 6.02 ± 0.05 HU/mM) is ~1.6 times greater than those obtained with the iodine-based agents (iopamidol 3.68 ± 0.03 and iopanoic acid 3.26 ± 0.19 HU/mM) on a per iodine atom basis. The comparable CT attenuation values obtained for the two different Gd-based agents indicated that CT attenuation is not sensitive to the molecular size and is attributed only to the K-edge property of the atom.
Table 1.
CT and MR properties of the contrast agents
| Sample ID | CT attenuation HU/mM | r1, /mM/sec | r2, /mM/sec |
|---|---|---|---|
| Iopanoic acid (EtOH)a | 3.26 ± 0.19 | Na | na |
| Iopamidol (1X PBS) a | 3.68 ± 0.03 | Na | na |
| Magnevist (1X PBS) | 6.02 ± 0.05 | 5.11 ± 0.11 | 5.44 ± 0.06 |
| Gd-G8 dendrimer (1X PBS) | 6.01 ± 0.11 | 12.76 ± 0.03 | 42.08 ± 0.38 |
In calculating the CT attenuation, the concentration values for the iodinated agents was adjusted to reflect the total iodine atoms per molecule.
Errors are reported as standard errors.
In Vivo Evaluation of Gd-G8 dendrimer
To establish the optimal dose needed for individual and for combined CT and MR imaging, a fixed volume (4 μL) of different concentrations of the Gd-G8 dendrimer agent (5, 10, 23, 47, and 78 mM in Gd) were infused by CED into the right striatum of male rats with a saline infusion as negative control. T1-weighted images at all concentrations (5–78 mM in Gd) demonstrated strong T1 contrast outlining a small infusion area, clearly distinguishable from the surrounding tissue and from the negative control (Figures 4, 5). A dark center in the infusion area was observed where the [Gd] in the tissue was sufficiently high (>2 mM) to induce signal loss due to shortened T2 (Figure 4). This became more problematic as the concentration of infusate (Gd-G8 dendrimer) increased. Although the volume of distribution (Vd) can be estimated using the R1 map, in these dark areas where there is a complete signal loss, the [Gd] can not be quantified accurately (Figure 6). This was observed at 47 mM and minimally at 23 mM concentration. In the case of 78 mM, the concentration in the infused area was very high making it difficult to estimate the Vd and the [Gd]. Similarly, on T2-weighted images, the contrast agent was discernible from the surrounding tissue at all concentrations. Calculation of [Gd] at high infusate concentrations (≥23 mM) was not accurate although the Vd can be determined accurately (Figure 6). However, at low infusate concentrations, the T2 change was not sufficient to demarcate the boundary, hence, the R1 map is superior for Gd quantification and Vd estimation (Table 2). Estimates of the Vd were obtained on MR for all infused concentrations (mean Vd ~ 28 μL) using the R1 at low concentrations or R2 map at high concentrations.
Figure 4.
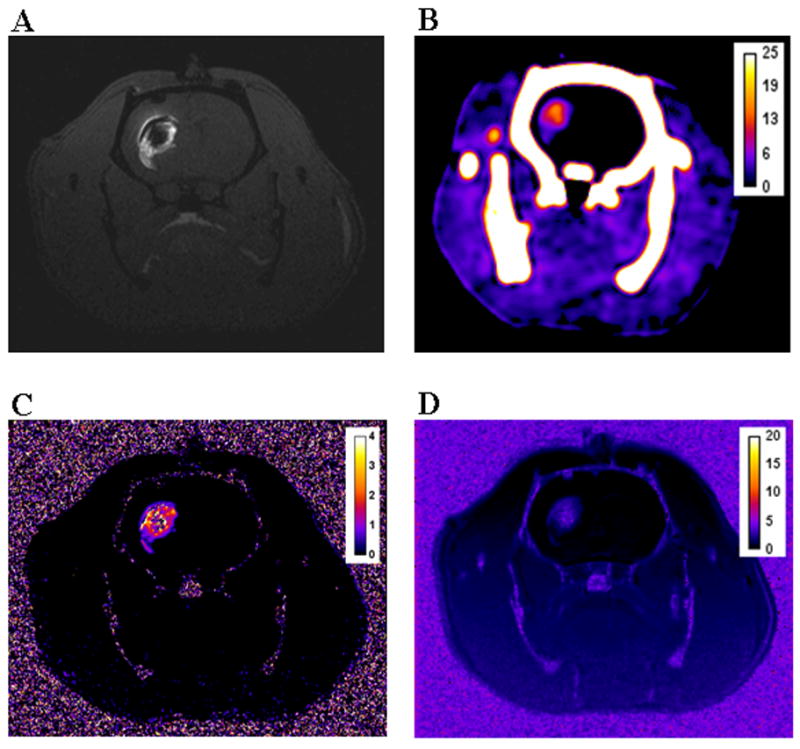
Figure 5.
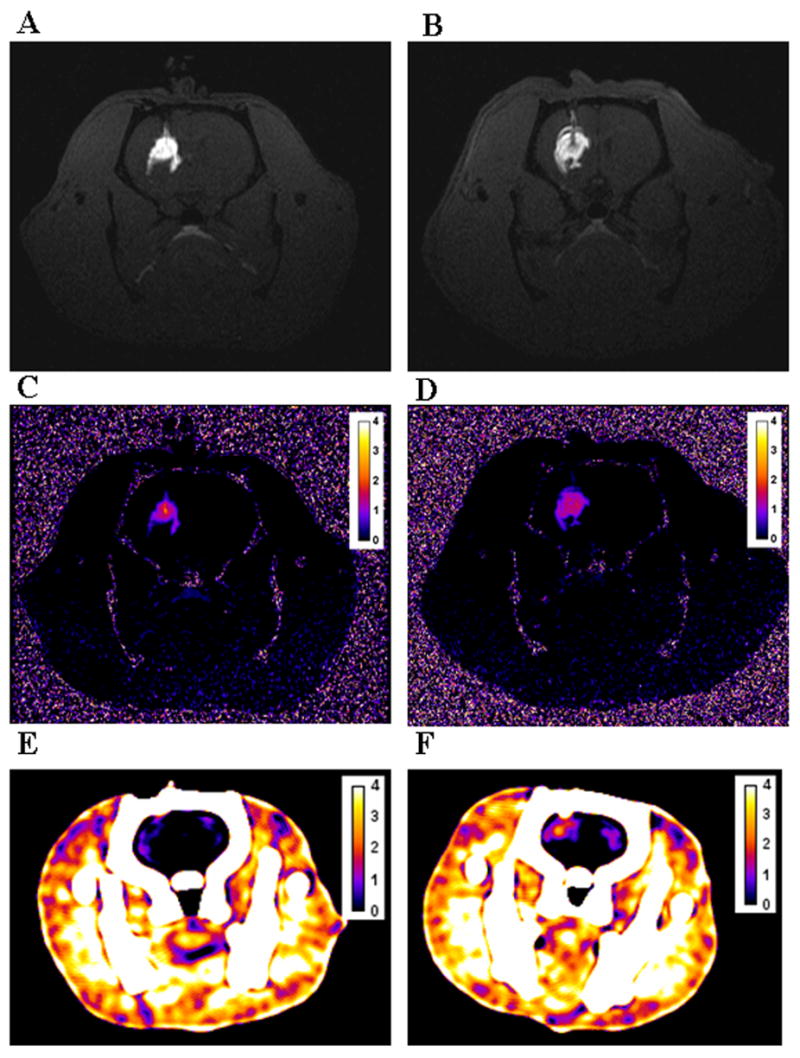
Figure 6.
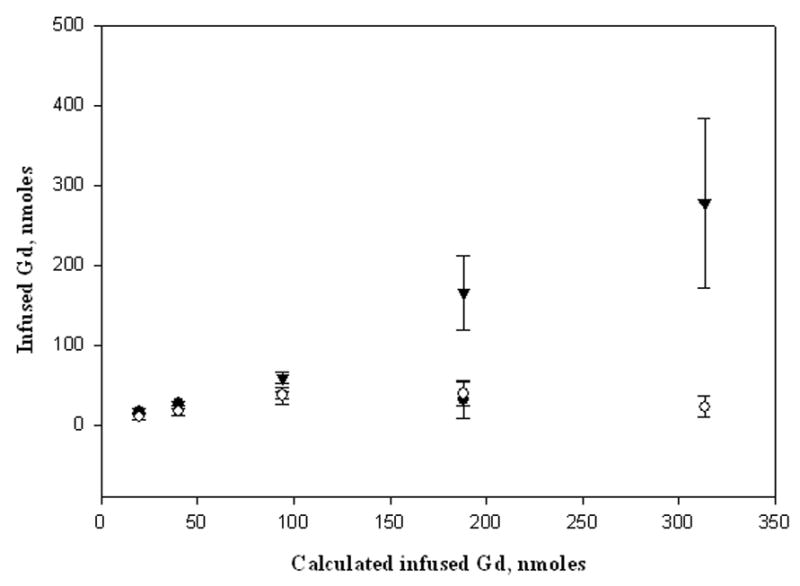
Table 2.
Volume of distribution and quantification results
| [Gd], mM | Vd from R1 mapa, μL | Vd from R2 mapb, μL | Vd from CT, μL |
|---|---|---|---|
| 5.0 | 28.15 ± 4.24 | 20.17 ± 3.49 | cbd |
| 10.0 | 28.48 ± 3.07 | 23.69 ± 1.41 | cbd |
| 23.5 | 27.18 ± 10.56 | 31.11 ± 4.19 | 23.74 ± 3.27 |
| 46.7 | 33.21 ± 9.05 | 31.08 ± 9.51 | 31.45 ± 10.12 |
| 78.3 | Cbd | 30.96 ± 1.83 | 31.45 ± 3.23 |
Vd calculated from the T1-weighted MR images using the fSPGR pulse sequence.
Vd calculated from the T2-weighted MR images using the fast spin echo pulse sequence.
Errors are reported as standard deviations.
cbd = can not be determined
CT attenuation values and [Gd] could be quantified within the brain for infusions between 23 and 78 mM in Gd. The calculated Vd and [Gd] from CT were comparable to the calculations obtained using the T2-weighted sequence at high infusate concentrations (at 47 mM, p = 0.96; at 78 mM, p = 0.83) (Table 2). However, at an infusion concentration of 23 mM, the estimated Vd was lower than the mean average using the T2-weighted images (p = 0.047) since the edges were hard to delineate accurately as they approached the baseline HU variation in the brain. At the 10 mM infusate concentration, CT contrast was barely discernible and produced a signal close to the baseline HU variation so neither Vd nor [Gd] measurements were reliable, while at the 5 mM dose, signal on CT was completely undetectable (Figure 5). In contrast, MR was more accurate in quantifying [Gd] at lower infusate concentrations (<23mM) where CT was ineffective.
Discussion
This study shows that a dual CT and MR surrogate marker for intracerebral CED is possible if a sufficiently high concentration (47 mM in Gd of Gd-G8 dendrimer) is employed. Using CT, infusate concentrations higher than 23 mM provided a simple direct method of Gd quantification based on the robust relationship of the CT attenuation to the [Gd] in the tissue. In vitro evaluation of the Gd-G8 dendrimer demonstrated its potential as a CT contrast agent. The higher K-edge of Gd compared to iodine makes it an attractive dual modality agent. However, at low infusate concentrations (<10 mM), CT is unable to track the agent. On the other hand, MR is able to track the contrast agent at all concentrations although the Gd quantification is more complex. Thus, ~47 mM in Gd of the Gd-G8 dendrimer proved to be the lowest infusate concentration that can be satisfactorily imaged with both CT and MR. This concentration is probably too high for clinical use.
In theory, the lowest infusate concentration possible should be used for a surrogate marker. A low concentration of the agent, especially Gd-based contrast agents, is desirable to decrease any potential side effects since one practical concern is the toxicity of free Gd(III) due to dissociation from the chelate [16]. Use of strong chelators such as 2-(4-isothiocyanatobenzyl)-1,4,7,10-tetraazacyclododecane-N, N′, N″, N‴-tetraacetic acid (p-SCN-Bz-DOTA), DTPA and 1B4M-DTPA decreases the potential of Gd(III) dissociation [10]. Though cyclic DOTA derivatives form more stable complexes with Gd(III) than acyclic DTPA derivatives [17], inherent problems encountered in the synthesis and saturation of macromolecular agents may limit its practicality as the chelate of choice [18]. The full intact DTPA derivative, 1B4M-DTPA, forms a more stable complex with Gd(III) than those Gd(III) complexes formed with cyclic anhydride DTPA conjugate derivatives [19], and is also less immunogenic than DOTA-derivatives [20].
A variety of macromolecular agents could potentially be used as CED surrogate markers. Macromolecular agents such as albumin-DTPA [21], poly-L-lysine-based [22] and PAMAM-based dendrimers [23] have all shown longer residence time due to their larger size and have higher molar relaxivities compared to LMW Gd-based MR contrast agents. Albumin-based macromolecular agents have been shown to be able to conjugate up to ~19 DTPA ligands [21] and have shown improved image enhancement, but are limited to a single size. Poly-L-lysine based macromolecular agents pose problems owing to the polydisperse nature of the poly-L-lysine backbone obtained in the polymerization synthesis process.
PAMAM dendrimers are stable in vivo, biocompatible, commercially available at different nano-sizes (generations), monodisperse, have well-defined architecture, have charge localization on the exterior of the molecule, and have a large number of terminal groups available for modification [8]. Compared to Gd-albumin, Gd dendrimers can be synthesized in different sizes, while retaining similar chemical properties and a higher number of Gd can be chelated to the surface of dendrimers due the large number of potential binding sites. Hence, with the dendrimer-based contrast agents, it should be possible to administer such agents at lower concentrations.
While several studies have demonstrated the use of dendrimer-based Gd as MR contrast agents, they have never been assessed as CT contrast agents [24–26]. In this study, a G8 PAMAM dendrimer-based agent was synthesized which had on average 355 Gd per molecule and possessed ~2.5 fold higher molar relaxivity than Gd-DTPA.
Conclusions
We have demonstrated that dendrimer-based contrast agents such as Gd-G8 dendrimer are feasible surrogate markers for accurately monitoring the distribution of CED-administered macromolecular therapeutic agents in a small volume using CT or MR or both. MR offers greater sensitivity than CT in estimating the Vd and can effectively quantify the agent’s concentration and diffusion at lower agent concentrations. Further studies employing different generations of dendrimers to mimic the distribution and diffusion of a range of therapeutic agents of varying sizes are planned. A limitation of the current study is that we only followed the distribution of the Gd-G8 dendrimer for <30 minutes after injection. Further studies monitoring the agent(s) over longer periods of time (days) are planned. This preliminary study was limited to normal brain tissue, thus, further studies will include rats with implanted brain tumors to assess impact on diffusion and distribution in a tumor-affected microenvironment.
Materials and Methods
PAMAM dendrimer generation-8 (G8 dendrimer) with an ethylenediamine core in MeOH (10% w/v), citric acid, sodium citrate, gadolinium acetate hydrate, and sodium bicarbonate were purchased from Aldrich (St. Louis, MO). Magnevist™ (Gd-DTPA) was obtained from Schering (Berlin, Federal Republic of Germany). Iopamidol (Isovue 300) was obtained from Bracco Diagnostics (Princeton, NJ). Iopanoic acid (3-amino-a-ethyl-2,4,6-triiodobenzenepropanoic acid) was purchased from TCI America (Portland, OR). Ethanol was purchased from Mallinckrodt and used as received. Phosphate buffered saline (1X PBS) at pH 7.2 was obtained from Digene (Gaithersburg, MD). Bifunctional chelating agent, 2-(4-isothiocyanatobenzyl)-6-methyl-diethylenetriaminepentaacetic acid, 1B4M-DTPA, was prepared and purified as previously described [27]. Size exclusion HPLC (SE-HPLC) was performed using a Beckman System Gold (Fullerton, CA) equipped with model 126 solvent delivery module and a model 168 UV detector (λ254 and 280 nm) controlled by 32 Karat software. Size exclusion chromatography was performed on a Tosohaas G3000SWxl 10 μm, 7.8 mm × 30 cm column (Tosoh Bioscience, Montgomeryville, PA) and a Zorbax GF450 6 μm, 9.4 mm × 250 mm (Agilent Technologies, Santa Clara, CA), with a TSK-gel 10 μm guard column (Tosoh Bioscience, Montgomeryville, PA) using phosphate buffered saline (1X PBS) solution as the eluent at 0.5 mL/min and 1.0 mL/min, respectively. All water used was purified using a Hydro Ultrapure Water Purification system (Rockville, MD).
Elemental analyses were performed in duplicates by Desert Analytics (Tucson, AZ) using combustion analysis method for C, H, N and S, and inductively coupled plasma-atomic emission spectroscopy (ICP-AES) method for determining the %Gd.
Conjugation of 1B4M-DTPA to the dendrimer (precursor 1)
Conjugation of the chelate 1B4M-DTPA to the dendrimer was done as has been previously described [28]. Briefly, the dendrimer (0.43 μmole) was added to a bicarbonate buffer solution (pH 8.5). Chelate, 1B4M-DTPA, (1.2 mmole) was added to the dendrimer solution as a solid in portions during the course of a week. The mixture was stirred at room temperature for 14 days, while the pH was maintained at 8.5 by the addition of 5 % NaHCO3. On the 14th day, the reaction mixture was heated at 30°C for an additional 24 h. The reaction solution was then transferred into a 250-mL Amicon diafiltration cell (Millipore, Billerica, MA) with a 30 kDa cut-off membrane (Millipore, Billerica, MA) and subjected to exhaustive dialysis using deionized water until no chelate was detected in the filtrate by SE-HPLC. The residual solution was lyophilized and the dendrimer-1B4M conjugate was obtained as an off-white solid (~ 90% ave yield). Compound 1 (precursor to Gd-G8 dendrimer): Anal. Calcd. for G8•(1B4M-DTPA)500Na2500(HCO3)500(H2O)1650: C, 42.28; H, 6.27; N, 13.53; S, 2.54. Found: C, 41.78, 42.26; H, 5.59, 5.68; N, 14.00, 14.43; S, 2.49, 2.47. SE-HPLC (RT): 10.15 min (G3000SWxl) and 13.50 min (GF450).
Gd complexation to the dendrimer-1B4M conjugates (Gd-G8 dendrimer)
Incorporation of Gd(III) to the chelated dendrimer was achieved as has been previously described [28]. A slight excess of gadolinium acetate (0.1 mmol in excess) in 0.3 M citrate buffer (pH ~ 4.5) was added to a solution of 1 in the same buffer. The solution was stirred at room temperature for 15 h and then transferred into a 250-mL diafiltration cell with a 30 kDa cut-off membrane. The solution was subjected to an exhaustive diafiltration with deionized water and monitored by SE-HPLC. The retentate was lyophilized and the product was obtained as an off-white solid (87% yield). Compound Gd-G8 dendrimer: Anal. calcd. for G8•(1B4M-DTPA)500Gd335(C6H7O7)35Na800(H2O)670: C, 43.86; H, 6.22; N, 14.22; S, 2.67; Gd, 8.78. Found: C, 43.51, 43.79; H, 5.76, 6.11; N, 14.72, 15.04; S, 2.69, 2.55; Gd, 8.61, 8.75. SE-HPLC 10.15 min (G3000SWxl) and 14.11 min (GF450).
Relaxivity Measurements
Solutions of Gd-G8 dendrimer and of Gd-DTPA (0.25 – 1.0 mM in Gd) in 1X PBS were prepared and relaxivity measurements were obtained at ~22°C using a 3-Tesla clinical scanner (Signa Excite, General Electric Medical System, Waukesha, WI) equipped with a rectangular single loop receiver coil (84×126×6 mm). Images of the solutions using an 8-echo 2D-spin echo (2D-SE) sequence were acquired with repetition times (TR) of 167, 300, 617, 1250, 2500 and 5000 ms at echo time (TE) ~9 ms. T1 and T2 maps were calculated using ImageJ MRI Analysis plug-in (www.rsb.info.nih.gov/ij/plugins/mri-analysis.html). T1 and T2 relaxivities, r1 and r2, were determined from the slopes of the plot of relaxation rates, R1 = 1/T1 and R2 = 1/T2, vs [Gd] (Table 1).
CT Hounsfield units measurements
Aqueous solutions (0 – 75 mM in [Gd] or in [I]) of Gd-G8 dendrimer and iopamidol were prepared in 1X PBS along with ethanolic solutions of iopanoic acid for comparison. Measurements were obtained using a clinical CT scanner (GE Lightspeed Ultra, General Electric Medical Systems, Milwaukee, WI) acquired at 140 kVp, 85 mA, 0.625-mm slice thickness, matrix resolution 512×512, voxel resolution 0.19×0.19×1.00 mm and exposure time (ET) of 1.0 s in helical mode. A coronal reconstruction was performed and the data were analyzed by ImageJ (www.rsb.info.nih.gov). CT attenuation values were measured in Hounsfield units (HU) averaged over the region of interest (ROI). A plot of the signal intensity in HU vs. the concentration of the agents (Gd-G8 dendrimer in [Gd], iopamidol and iopanoic acid in [I]) was obtained (Figure 3).
Figure 3.
Infusion of the Agent into the striatum
All procedures were performed in accordance with the National Institutes of Health guidelines on the use of animals in research and were approved by the Animal Care and Use Committee of the National Institute of Neurological Disorders and Stroke.
Adult male Sprague-Dawley rats (Taconic Farms, Rockville, MD) (n = 3–4) weighing between 300 and 500 g were used in this study. The animals were anaesthetized with intraperitoneal injection of ketamine (80 mg/kg) and xylazine (10 mg/kg) and placed in a stereotaxic frame (Model 900, Kopf Instruments, Tujunga, CA). A midline scalp incision was made over the vertex extending to the right frontal region of the skull centered 1 mm anterior and 3 mm to the right of the bregma. A 32-gauge blunt needle attached to a 25-μL gas tight Hamilton syringe (Thomson Instruments, Clear Brook, VA) was inserted into the right striatum by using the aforementioned stereotaxic coordinates to a depth of 5 mm below the dura mater. CED [3] was used to deliver 4.0 μL of Gd-G8 dendrimer, or 1X PBS as negative control, into the right striatum at a rate of 0.1μL/min. At the end of the infusion period, the wound was sutured and the animal was immediately transported to the MRI facility and sacrificed prior to scanning by administering an intraperitoneal injection of sodium pentobarbital (100mg/kg).
Post-infusion MR Imaging
Images were obtained on a 3-Tesla clinical scanner (GE Signa Excite, General Electric Medical Systems, Milwaukee, WI) using a rectangular saddle-shaped surface coil (50×40 and 38 mm in diameter) with two internal references. Coronal and axial T1-weighted images were acquired using a 3D-fast spoiled gradient echo (3D-fSPGR) sequence, (repetition time/echo time 11.2/3.9 msec; bandwidth 31.25 kHz; flip angles 10° and 30°; matrix size 256×160×80; voxel resolution 80×80×300μm; 2 excitations). Coronal fast spin echo sequence (FSE) with TR of 5000 ms and TE of 15 and 42 ms (bandwidth 15.63; 10 echo train lengths; matrix size 192×160×40; voxel resolution 160×160×600μm; 2 excitations) were used to obtain T2-weighted images.
Gadolinium concentration maps were calculated from the T1-weighted and T2-weighted images using ImageJ macros. A region of interest (ROI) contra-lateral to the infusion site was used for the pre-contrast T1/T2 values and T2-weighted signal intensities, and the internal references were used to calculate the relaxivities to determine the [Gd]. R1 maps were calculated from the dual flip angle fSPGR images [5] and then converted to [Gd] using the equation where T1o is the precontrast T1 value and r1 is the T1 relaxivity determined from the internal references. Delta R2 maps were calculated from the ratio of signal intensities of the T2-weighted images to the pre-contrast value and converted to [Gd] using the equation where Io is the precontrast value and r2 is the T2 relaxivity determined from the internal references.
Post-infusion CT Imaging
After MR imaging, all animals were frozen prior to CT imaging to permit convenient access to the off hours scanning schedule of the clinical CT (GE LightSpeed Ultra, General Electric Medical Systems, Milwaukee, WI). CT imaging was acquired at 140 kVp, 85 mA, 0.625-mm slice thickness, matrix resolution 512×512, voxel resolution 0.19×0.19×1.00 mm and exposure time (ET) of 2.0 s (DFOV 96 mm) in axial mode. The data were analyzed using ImageJ. [Gd] was calculated by subtracting the normal brain mean value from the image then dividing the difference by the slope obtained from the above-mentioned phantom experiment which relates Hounsfield units to [Gd] (Table 1).
Estimation of Volume of Distribution (Vd)
The Vd of the agent (mm3 or μL) in the CT and MR images was estimated from the product of the slice thickness (mm) and the sum of the areas (mm2) from the region of interest (ROI) per slice that contains the Gd-G8 dendrimer using ImageJ with a 10% threshold level set from the maximum concentration [6] (Table 2).
Analysis of Data
The data are presented as mean ± standard error of means, and the significance of the data was assessed by student t-test.
Acknowledgments
This research was supported by the Intramural Research Program of the NIH, National Cancer Institute, Center for Cancer Research. This project has been funded in part with federal funds from the National Cancer Institute, National Institutes of Health, under contract N01-CO-12400.
References
- 1.Jemal A, Siegel R, Ward E, Murray T, Xu J, Thun MJ. Cancer statistics, 2007. CA Cancer J Clin. 2007;57:43–66. doi: 10.3322/canjclin.57.1.43. [DOI] [PubMed] [Google Scholar]
- 2.Maysinger D, Morinville A. Drug delivery to the nervous system. Trends Biotechnol. 1997;15:410–418. doi: 10.1016/S0167-7799(97)01095-0. [DOI] [PubMed] [Google Scholar]
- 3.Chen MY, Lonser RR, Morrison PF, Governale LS, Oldfield EH. Variables affecting convection-enhanced delivery to the striatum: a systematic examination of rate of infusion, cannula size, infusate concentration, and tissue-cannula sealing time. J Neurosurg. 1999;90:315–320. doi: 10.3171/jns.1999.90.2.0315. [DOI] [PubMed] [Google Scholar]
- 4.Elleaume H, Charvet AM, Corde S, Estève F, le Bas JF. Performance of computed tomography for contrast agent concentration measurements with monochromatic x-ray beams: comparison of K-edge versus temporal subtraction. Phys Med Biol. 2002;47:3369–3385. doi: 10.1088/0031-9155/47/18/307. [DOI] [PubMed] [Google Scholar]
- 5.Deoni SCL, Rutt BK, Peters TM. Rapid combined T1 and T2 mapping using gradient recalled acquisition in the steady state. Magn Reson Med. 2003;49:515–526. doi: 10.1002/mrm.10407. [DOI] [PubMed] [Google Scholar]
- 6.Nguyen TT, Pannu YS, Sung C, Dedrick RL, Walbridge S, Brechbiel MW, Garmestani K, Beitzel M, Yordanov AT, Oldfield EH. Convective distribution of macromolecules in the primate brain demonstrated using computerized tomography and magnetic resonance imaging. J Neurosurg. 2003;98:584–590. doi: 10.3171/jns.2003.98.3.0584. [DOI] [PubMed] [Google Scholar]
- 7.Saito R, Bringas JR, McKnight TR, Wendland MF, Mamot C, Drummond DC, Kirpotin DB, Park JW, Berger MS, Bankiewicz KS. Distribution of liposomes into brain and rat brain tumor models by convection-enhanced delivery monitored with magnetic resonance imaging. Cancer Res. 2004;64:2572–2579. doi: 10.1158/0008-5472.can-03-3631. [DOI] [PubMed] [Google Scholar]
- 8.Tomalia DA. Birth of a new macromolecular architecture: Dendrimers as quantized building blocks for nanoscale synthetic organic chemistry. Aldrichimica Acta. 2004;37:39–57. [Google Scholar]
- 9.Tomalia DA. Birth of a new macromolecular architecture: dendrimers as quantized building blocks for nanoscale synthetic polymer chemistry. Prog Polym Sci. 2005;30:294–324. [Google Scholar]
- 10.Brechbiel MW, Gansow OA. Backbone-substituted DTPA ligands for 90Y Radioimmunotherapy. Bioconjugate Chem. 1991;2:187–194. doi: 10.1021/bc00009a008. [DOI] [PubMed] [Google Scholar]
- 11.Flaschka HA, Barnard AJ Jr, editors. Chelates in analytical chemistry: A collection of monographs. Marcel Dekker, Inc; New York: 1969. Budêsinsky B. Monoarylazo and bis(arylazo) derivatives of chromotropic acid as photometric agents; pp. 1–91. [Google Scholar]
- 12.Pippin CG, Parker TA, McMurry TJ, Brechbiel MW. Spectrophotometric method for the determination of a bifunctional DTPA ligand in DTPA-monoclonal antibody conjugates. Bioconjugate Chem. 1992;3:342–345. doi: 10.1021/bc00016a014. [DOI] [PubMed] [Google Scholar]
- 13.Wiener EC, Brechbiel MW, Brothers H, Magin RL, Gansow OA, Tomalia DA, Lauterbur PC. Dendrimer-based metal chelates: a new class of magnetic resonance imaging contrast agents. Magn Reson Med. 1994;31:1–8. doi: 10.1002/mrm.1910310102. [DOI] [PubMed] [Google Scholar]
- 14.Konda SD, Aref M, Wang S, Brechbiel MW, Wiener EC. Specific targeting of folate-dendrimer MRI contrast agents to the high affinity folate receptor expressed in ovarian tumor xenografts. MAGMA. 2001;12:104–113. doi: 10.1007/BF02668091. [DOI] [PubMed] [Google Scholar]
- 15.Elleaume H, Charvet AM, Corde S, Estève F, le Bas JF. Performance of computed tomography for contrast agent conentration measurements with monochromatic x-ray beams: comparison of K-edge versus temporal subtraction. Phys Med Biol. 2002;47:3369–3385. doi: 10.1088/0031-9155/47/18/307. [DOI] [PubMed] [Google Scholar]
- 16.Cacheris WP, Quay SC, Rocklage SM. The relationship between thermodynamics and the toxicity of gadlinium complexes. Magn Reson Imaging. 1990;8:467–481. doi: 10.1016/0730-725x(90)90055-7. [DOI] [PubMed] [Google Scholar]
- 17.Camera L, Kinuya S, Garmestani K, Wu C, Brechbiel MW, Pai LH, McMurry TJ, Gansow OA, Pastan I, Paik CH, Carrasquillo JA. Evaluation of the serum stability and in vivo biodistribution of CHX-DTPA and other ligands for yttrium labeling of monoclonal antibodies. J Nucl Med. 1994;35:882–889. [PubMed] [Google Scholar]
- 18.Wu C, Brechbiel MW, Kozak RW, Gansow OA. Metal-chelate-dendrimer-antibody constructs for use in radioimmunotherapy and imaging. Bioorg Med Chem Lett. 1994;4:449–454. [Google Scholar]
- 19.Kinuya S, Jeong JM, Garmestani K, Saga T, Camera L, Brechbiel MW, Gansow OA, Carrasquillo JA, Neumann RD, Paik CH. Effect of metabolism on retention of indium-111-labeled monoclonal antibody in liver and blood. J Nucl Med. 1994;35:1851–1857. [PubMed] [Google Scholar]
- 20.Watanabe N, Goodwin DA, Meares CF, McTigue M, Chaovapong W, Ransone CM, Renn O. Immunogenicity in rabbits and mice of an antibody-chelate conjugate: comparison of (s) and (R) macrocyclic enantiomers and an acyclic chelating agent. Cancer Res. 1994;54:1049–1054. [PubMed] [Google Scholar]
- 21.Ogan MD, Schmiedl U, Moseley ME, Grodd W, Paajanen H, Brasch RC. Albumin-labeled with Gd-DTPA an intravascular contrast-enhancing agent for magnetic resonance blood pool imaging: preparation and characterization. Invest Radiol. 1987;22:665–671. [PubMed] [Google Scholar]
- 22.Manabe Y, Longley C, Furmanski P. High-level conjugation of chelating agents onto immunoglobulins: use of an intermediary poly(L-lysine)-diethylenetriaminepenta-acetic acid carrier. Biochim Biophys Acta. 1986;883:460–467. doi: 10.1016/0304-4165(86)90285-0. [DOI] [PubMed] [Google Scholar]
- 23.Kobayashi H, Kawamoto S, Jo S-K, Bryant LH, Jr, Brechbiel MW, Star RA. Macromolecular MRI contrast agents with small dendrimers: Pharmocokinetics differences between sizes and cores. Bioconjugate Chem. 2003;14:388–394. doi: 10.1021/bc025633c. [DOI] [PubMed] [Google Scholar]
- 24.Kobayashi H, Brechbiel MW. Dendrimer-based macromolecular MRI contrast agents: characteristics and application. Mol Imaging. 2003;2:1–10. doi: 10.1162/15353500200303100. [DOI] [PubMed] [Google Scholar]
- 25.Kobayashi H, Sato N, Hiraga A, Saga T, Nakamoto Y, Ueda H, Konishi J, Togashi K, Brechbiel MW. 3D-micro-MR angiography of mice using macromolecular MR contrast agents with polyamidoamine dendrimer core with reference to their pharmacokinetic properties. Magn Reson Med. 2001;45:454–460. doi: 10.1002/1522-2594(200103)45:3<454::aid-mrm1060>3.0.co;2-m. [DOI] [PubMed] [Google Scholar]
- 26.Kobayashi H, Kawamoto S, Star RA, Waldmann TA, Tagaya Y, Brechbiel MW. Micro-magnetic resonance lymphangiography in mice using a novel dendrimer-based magnetic resonance imaging contrast agent. Cancer Res. 2003;63:271–276. [PubMed] [Google Scholar]
- 27.Brechbiel MW, Beitzel PM, Gansow OA. Purification of p-nitrobenzyl C-functionalized diethylenetriamine pentaacetic acids for clinical applications using anion-exchange chromatography. J Chromatograph A. 1997;771:63–69. doi: 10.1016/s0021-9673(97)00108-8. [DOI] [PubMed] [Google Scholar]
- 28.Yordanov AT, Kobayashi H, English SJ, Reijnders K, Milenic DE, Krishna MC, Mitchell JA, Brechbiel MW. Gadolinium-labeled dendrimers as biometric nanoprobes to detect vascular permeability. J Mater Chem. 2003;13:1523–1525. [Google Scholar]