

Abstract
We have investigated the effects of moderate global undernutrition during gestation in the rat on the blood pressure of male and female offspring, and on the development of systemic vascular function. Pregnant Wistar rats were nutritionally restricted (R) by feeding with 70% of the normal gestation-matched dietary intake from 0 to 18 days gestation.
R offspring were growth retarded at birth but of similar weight to controls (C) at 20 days. Systolic and/or diastolic and mean arterial blood pressures, measured directly by femoral artery catheter, were elevated from 60 days onward in male R offspring (mean arterial pressure: day 60, P < 0.01; day 100, P < 0.05; day 200, P < 0.005, R vs. C), and from 100 days onward in female R offspring (mean arterial pressure day 100 and day 200, P < 0.05; R vs. C).
Maximal constriction to phenylephrine (PE) (P < 0.05) and to noradrenaline (NA) (P < 0.05) was reduced in isolated femoral arteries of day 20 R pups. These differences did not persist into adulthood. In male adult R offspring (200 days), maximal vasoconstriction to the thromboxane A2 mimetic, U46619 (P < 0.05) and sensitivity to potassium (P < 0.01) were enhanced.
Moderate maternal undernutrition in rat gestation adversely affects cardiovascular function in the offspring. These abnormalities increase with age and are more pronounced in males.
Smallness at birth or disproportionate growth in utero may play a major role in the aetiology of adulthood diseases. Hypertension (Barker et al. 1990), coronary heart disease (Barker et al. 1993), type II diabetes mellitus (Phillips et al. 1994) and renal disease (Hoy et al. 1999) are among the disorders which have been linked to low birth weight or thinness at birth. Whilst most of these associations are based on retrospective population studies, prospective investigations in animals are now providing substantial experimental evidence to support the hypothesis of ‘fetal programming’. In relation to hypertension, studies in pregnant rats have reported that a 50% reduction of dietary protein intake (Langley & Jackson, 1994; Langley-Evans & Jackson 1995; Langley-Evans et al. 1996a,b; Gardner et al. 1997) or severe calorie restriction (Woodall et al. 1996, 1999) leads to elevated blood pressure in adult offspring. Mechanisms implicated have included alteration of the offspring’s renin- angiotensin system (Langley-Evans & Jackson, 1995; Sherman & Langley-Evans, 1998) and stress-induced stimulation of the hypothalamic pituitary adrenal (HPA) axis (Gardner et al. 1997). Severe protein restriction, which is of great significance in underdeveloped countries, is unlikely to be directly applicable to the aetiology of hypertension in Western populations where maternal dietary deprivation due to social deprivation or health ‘trends’ is unlikely to be confined to protein restriction alone. Dietary inadequacy is more likely to be related to altered micronutrient intake, a disproportionate intake of saturated fat or to a moderate ‘global’ reduction of all dietary constituents. In this study we have investigated the last of these, the responses to moderate restriction of all dietary constituents. In a recent investigation, lambs from ewes subjected to only 15% dietary restriction during gestation were hypertensive, and demonstrated perturbed activity of the HPA axis in the absence of growth retardation (Hanson et al. 1999; Hawkins et al. 1999).
In the present study, we have investigated the hypothesis that a 30% reduction of total diet during gestation in the rat will induce hypertension in the offspring. In an attempt to define mechanisms whereby blood pressure may be raised, we have hypothesised that abnormalities of constrictor and dilator function of the peripheral vascular system may play a role. Selected aspects of small artery function have therefore been evaluated in isolated arteries of the femoral circulation, mounted on a small vessel myograph. Since plasma glucose and lipids may affect vascular constrictor and dilator function, these parameters were also evaluated. In order to investigate the potential gender differences, both male and female offspring of pregnant Wistar rats on a restricted diet were studied from neonatal life to adulthood.
METHODS
All procedures involving animals were conducted in accordance with the regulations of the British Home Office Animals (Scientific Procedures) Act, 1986.
Animals and study design
Animals were housed and bred in the local animal facility (University College, London). In the study group, 12- to 14-week-old virgin Wistar rats (not siblings) were maintained under standard conditions (temperature 20oC, humidity 55% and 12-12 h light dark cycle) with free access to tap water and standard rat chow (crude oil 2.6%, protein 14.7% and fibre 5.3%, gross energy 14.8 MJ kg−1, SDS, Special Diet Services, Essex, UK). Male Wistar rats were caged with individual females overnight and on consecutive nights until mating was confirmed by the presence of a vaginal copulation plug (between 1 and 4 days). Females which failed to become pregnant were not used in any further attempts at mating. Female rats were randomly divided into two groups, control (C, n = 10), fed standard chow ad libitum and a nutritionally restricted group (R, n = 11). Preliminary studies were performed in a group of control animals to measure dietary consumption during gestation. Dietary intake increased linearly (r2= 0.9607) with gestation. Initial (day 1) consumption was equal to 23.8 ± 0.7 g day−1 (8.23 g (100 g body weight)−1), rising to 37.4 ± 1.15 g day−1 on day 18 and then decreasing dramatically until parturition. The restricted group were fed 70% of this gestation-matched diet from day 0 to day 18 of gestation. Animals were housed individually and were fed the prescribed diet daily. Daily food intake was monitored. Maternal body weight was measured daily during gestation and every 10 days after delivery. In order to prevent any variation in neonatal growth through availability of milk intake during suckling, litter size was standardised to 10 pups at day 1.
Body and organ weight measurements
For the determination of organ weights, no more than two offspring from each litter at days 1 and 20, or one animal of each sex from any litter at 100 and 200 days of age were randomly chosen, and killed by an overdose of sodium pentobarbitone (200 mg kg−1, i.p.) Brain, heart, lungs, liver, kidneys and adrenal glands of each animal were weighed.
Arterial blood pressure and heart rate
Blood pressure and heart rate were determined after overnight starvation in litter mates of animals used for weight measurements. Only one animal of each sex from any one litter was studied at a given age, and these were randomly chosen. Animals were studied when 60 days old (C: 6 males, 6 females; R: 6 males, 6 females), 100 days old (C: 6 males, 6 females; R: 6 males, 6 females) and 200 days old (C: 5 males, 5 females; R: 6 males, 6 females). The rats were anaesthetised with sodium pentobarbitone (60 mg, i.p.) and a polyethylene catheter (Portex, i.d. = 0.54 mm, o.d. = 0.90 mm) inserted into the iliac artery via the left femoral artery. Depth of anaesthesia was tested by the absence of the paw reflex. Catheters were tunnelled under abdominal skin and exteriorised. The arterial catheter was connected to a pressure transducer (Harvard Apparatus, UK) and signals recorded (MacLab data acquisition system; AD Instruments, UK). Animals were then placed in a dark box in which they could move freely. After a recovery period of 2-3 h, systolic and diastolic arterial blood pressures were recorded in the conscious, unrestrained animals for 1 h and mean arterial blood pressure and heart rate was calculated. Animals were killed by sodium pentobarbitone overdose (i.p.).
Biochemical assays
Arterial blood samples (3 ml) were taken from 100- and 200-day-old offspring immediately after administration of terminal anaesthesia, cooled in ice, centrifuged and the plasma stored at -80oC until assayed. Plasma glucose was determined with the glucose oxidase method (glucose analyser 2300STAT; Yellow Springs Instrumentation, Yellow Springs, OH, USA). Plasma triglycerides (Unimate TRIG; ABX diagnostics, Shefford, UK), cholesterol (Unimate5 CHOL; ABX diagnostics) and non-esterified fatty acids (Wako NEFA C test kit, Alpha Laboratories, Eastleigh, UK) were measured using commercially available assays as indicated.
Determination of isolated artery function
Vascular function was assessed in offspring when 20 days old (C, 7; R, 6), 100 days old (C: 6 males, 5 females; R: 5 males, 6 females) and 200 days old (C: 6 males, 5 females; R: 6 males, 5 females). Only one animal of each sex from any one litter was studied at a given age, and these were randomly chosen. The animals were killed by sodium pentobarbitone overdose. The femoral artery (day 20) or second order branches of the femoral artery (day 100 and 200) (200-400 μm in diameter) were immediately removed and mounted as a ring preparation on a wire-myograph (Mulvany & Halpern, 1977). Arteries were bathed in physiological saline solution (PSS (mmol l−1): NaCl 119, KCl 4.7, CaCl2 2.5, MgSO4 1.17, NaHCO3 25, KH2PO4 1.7, EDTA 0.026 and glucose 5.5) at a pH of 7.4 when gassed with 5% CO2-95% air at 37oC. After the determination of passive tension and internal circumference, the arteries were set to an internal circumference equivalent to 60 mmHg at day 20, a pressure at which these arteries had been shown in preliminary experiments to produce maximal contraction to depolarising potassium solution (125 mmol l−1, KPSS, equimolar substitution of NaCl with KCl in PSS). Arteries from 100- and 200-day-old animals were set to a circumference (L100) equivalent to 90% of that measured when relaxed in situ under a transmural pressure of 100 mmHg (using Laplace’s relationship). We have found previously that L100 produces maximal active tension in response to KPSS in these arteries. The vessels were subjected to a standard run-up procedure involving contractions to 10 mmol l−1 phenylephrine, KPSS and 10 mmol l−1 phenylephrine in KPSS. Arteries which produced tension equivalent to less than 100 mmHg pressure in response to 125 mmol l−1 KPSS were rejected from the study. Vasoconstriction to 125 mmol l−1 KPSS and cumulative concentration responses to phenylephrine (1 x 10⁻⁸ to 5 x 10⁻⁵ mol l−1), noradrenaline (NA; 1 x 10⁻⁸ to 5 x 10⁻⁵ mol l−1), and the thromboxane A2 mimetic (U46619) (PE; 1 x 10⁻¹⁰ to 5 x 10⁻⁶ mol l−1) were examined under isometric conditions. Since changes in vascular function and blood pressure became apparent as the study progressed, vasoconstriction to cumulative concentrations of KPSS (4.7-125 mmol l−1) was also determined at day 200. Arteries were then preconstricted to either 1 x 10⁻⁶ mol l−1 U46619 for 20- and 100-day-old animals or 1 x 10⁻⁵ mol l−1 PE for 200-day-old animals (because U46619 responses declined significantly at 200 days of age). Vasorelaxation to cumulative doses of ACh (1 x 10⁻¹⁰ to 1 x 10⁻⁵ mol l−1) and, after washout and a second preconstriction, to sodium nitroprusside (SNP) (1 x 10⁻¹⁰ to 1 x 10⁻⁵ mol l−1) were then examined.
Drugs and chemicals
Noradrenaline tartrate was obtained fromWinthrop (Guildford, UK) and all others were from Sigma (Poole, UK).
Statistical analysis
Tension (mN mm−1) is expressed as a percentage of maximal contraction to 125 mmol l−1 KPSS to correct for small differences in vessel diameter and vascular smooth muscle mass and to allow comparison between different age groups. Values are expressed as mean ±s.e.m and compared by Student’s t test or Mann-Whitney U test as appropriate. The pEC50 (-log EC50) was calculated by Instat (GrahPAD Software Inc., San Diego, CA, USA) and values compared using Student’s t test or Mann-Whitney U test, with corrections for multiple comparisons if appropriate. Concentration-response curves were compared by two-way repeated-measures ANOVA if calculation of the pEC50 was not appropriate (Statview version 4.5, Abacus Concepts Ltd, USA). Significance was assumed if P < 0.05.
RESULTS
Maternal and offspring body weight
The body weight of the nutritionally restricted dams was similar to controls until day 21 of gestation when it was significantly reduced (R, 403 ± 6 g, n = 10 vs. C, 429 ± 11 g, n = 11, P < 0.05). The weight remained low when measured on day 1 post partum (R, 308 ± 4 g vs. C, 356 ± 9 g, P < 0.05). R maternal weight subsequently increased and was not significantly different from controls at 10 (R, 361 ± 5 g vs. C, 380 ± 15 g) and 20 days (C, 363 ± 7 g vs C, 356 ± 8 g) post partum. There was no difference in litter size between C (mean ±s.e.m., 13.2 ± 0.8, n = 10 litters) and R (13.3 ± 1.1, n = 11 litters) groups. Body weight was reduced in R offspring at day 1 (R, 4.99 ± 0.26 g vs C, 5.97 ± 0.09, P < 0.005), but was no different from offspring of C by day 20 (R, 35.0 + 2.0 g vs C, 36.1 + 1.2 g). Organ weights were expressed as a percentage of body weight. The lungs of the day-old offspring were smaller than controls but liver weight was greater. Kidney and adrenal weights were reduced in R vs. C males at 100 days. None of these differences persisted to 200 days of age (Table 1).
Table 1.
Organ weights in offspring of C and R groups
| Day 1 | Day 20 | |||
|---|---|---|---|---|
| C (n = 10) | R (n = 13) | C (n = 12) | R (n = 13) | |
| Brain (% body weight) | 4.80 ± 0.3 | 5.18 ± 0.16 | 3.96 ± 0.11 | 4.11 ± 0.26 |
| Heart (% body weight) | 0.66 ± 0.02 | 0.68 ± 0.05 | 0.28 ± 0.05 | 0.58 ± 0.01 |
| Lungs (% body weight) | 2.56 ± 0.15 | 1.97 ± 0.08**** | 1.46 ± 0.09 | 1.23 ± 0.05* |
| Liver (% body weight) | 3.71 ± 0.13 | 5.17 ± 0.22**** | 3.28 ± 0.09 | 3.34 ± 0.09 |
| Kidneys (% body weight) | 1.05 ± 0.03 | 1.08 ± 0.04 | 1.07 ± 0.02 | 1.10 ± 0.02 |
| Day 100 | ||||
| C male (n = 8%) | R male (n = 10%) | C female (n = 9%) | R female (n = 11%) | |
|---|---|---|---|---|
| Brain (% body weight) | 0.43 ± 0.02 | 0.44 ± 0.01 | 0.71 ± 0.01 | 0.74 ± 0.02 |
| Heart (% body weight) | 0.27 ± 0.01 | 0.27 ± 0.01 | 0.31 ± 0.014 | 0.31 ± 0.01 |
| Lungs (% body weight) | 0.35 ± 0.01 | 0.32 ± 0.01 | 0.44 ± 0.02 | 0.43 ± 0.01 |
| Liver (% body weight) | 2.76 ± 0.07 | 2.75 ± 0.09 | 2.74 ± 0.06 | 2.79 ± 0.03 |
| Kidneys (% body weight) | 0.56 ± 0.01 | 0.52 ± 0.01* | 0.57 ± 0.01 | 0.55 ± 0.01 |
| Adrenals (% body weight) | 0.017 ± 0.001 | 0.015 ± 0.001* | 0.032 ± 0.002 | 0.032 ± 0.001 |
| Day 200 | ||||
|---|---|---|---|---|
| C male (n = 8%) | R male (n = 10%) | C female (n = 10%) | R female (n = 11%) | |
| Brain (% body weight) | 0.40 ± 0.03 | 0.38 ± 0.02 | 0.62 ± 0.02 | 0.61 ± 0.02 |
| Heart (% body weight) | 0.26 ± 0.01 | 0.26 ± 0.01 | 0.28 ± 0.01 | 0.29 ± 0.01 |
| Lungs (% body weight) | 0.29 ± 0.02 | 0.29 ± 0.01 | 0.40 ± 0.02 | 0.40 ± 0.01 |
| Liver (% body weight) | 2.94 ± 0.12 | 2.94 ± 0.18 | 2.41 ± 0.34 | 2.62 ± 0.12 |
| Kidneys (% body weight) | 0.55 ± 0.02 | 0.53 ± 0.03 | 0.54 ± 0.01 | 0.52 ± 0.01 |
| Adrenals (% body weight) | 0.013 ± 0.001 | 0.011 ± 0.001 | 0.026 ± 0.002 | 0.025 ± 0.001 |
C, control group; R, nutritional restriction group. Values are given as means ± s.e.m.
P < 0.05
P < 0.001, C vs. R.
Biochemical assays
There were no differences in any of the plasma analysis carried out on samples from offspring of C and R dams at 100 or 200 days of age (Table 2). However, some differences between gender and age groups were apparent; plasma glucose was higher in males than females in both C and R groups at day 200.
Table 2.
Plasma analyis in offspring of control and nutritionally restricted dams
| Day 100 | C male (n = 9%) | R male (n = 9%) | C female (n = 7%) | R female (n = 10%) |
|---|---|---|---|---|
| Glucose (mmol l−1) | 8.15 ± 1.17 | 7.96 ± 0.56 | 6.75 ± 0.67 | 6.96 ± 0.74 |
| Cholesterol (mmol l−1) | 1.05 ± 0.08 | 1.11 ± 0.10 | 1.02 ± 0.06 | 0.97 ± 0.04 |
| Triglyceride (mmol l−1) | 0.81 ± 0.14 | 1.11 ± 0.17 | 0.56 ± 0.10 | 0.62 ± 0.10* |
| Free fatty acid (mmol l−1) | 1.02 ± 0.36 | 1.08 ± 0.13 | 1.46 ± 0.25 | 1.17 ± 0.22 |
| Day 200 | C male (n = 9%) | R male (n = 9%) | C female (n = 9%) | R female (n = 10%) |
|---|---|---|---|---|
| Glucose (mmol l−1) | 7.98 ± 0.37 | 7.95 ± 0.38 | 6.22 ± 0.32** | 6.83 ± 0.20* |
| Cholesterol (mmol l−1) | 1.10 ± 0.18 | 1.31 ± 0.09 | 1.00 ± 0.04 | 1.15 ± 0.06 |
| Triglyceride (mmol l−1) | 0.85 ± 0.35 | 1.16 ± 0.19 | 1.07 ± 0.19 | 1.43 ± 0.35 |
| Free fatty acid (mmol l−1) | 1.68 ± 0.23 | 1.21 ± 0.24 | 2.23 ± 0.56 | 1.48 ± 0.27 |
C, control; R, nutritional restriction. Values are given as means ± s.e.m.
P < 0.05
P < 0.01, male vs. female for same group (C or R) at same age. No differences were found between C and R of same sex at any age.
Arterial blood pressure and heart rate
Blood pressure recordings were stable in both R and C groups after the 2-3 h recovery period, and blood pressures in the control group were within the normal range. Blood pressures and the heart rate for the C and R groups are shown in Table 3 for male and female offspring at the three ages studied. Systolic and mean arterial pressures (MAP) were increased in 60-day-old R male vs. 60-day-old C male offspring. In contrast, blood pressures in the 60-day-old R females were similar to C females of the same age (Fig. 1). At 100 and 200 days both male and female R groups showed clear elevation of blood pressure compared to C of the same sex and age. Gender differences in blood pressure were also noted within both R and C groups (Table 3); female blood pressures generally being lower than males of the same age. Blood pressure increased with age in males and females of R and C groups (Table 3, Fig. 1; mean arterial pressure, P < 0.001, 60 days vs 200 days for all groups)
Table 3.
Blood pressure and heart rate in offspring of control and nutrionally restricted dams
| Day 60 | C male (n = 6) | R male (n = 6) | C female (n = 6) | R female (n = 6) |
|---|---|---|---|---|
| Systolic pressure (mmHg) | 113.5 ± 2.4 | 131.0 ± 2.3** | 110.0 ± 2.1 | 115.0 ± 2.6††† |
| Diastolic pressure (mmHg) | 103.1 ± 4.0 | 109.4 ± 2.8 | 92.6 ± 3.0 | 92.2 ± 2.8†† |
| Mean arterial pressure (mmHg) | 108.5 ± 2.8 | 120.4 ± 2.2** | 101.9 ± 2.2 | 103.7 ± 2.0††† |
| Heart rate (beats min−1) | 393.3 ± 11.7 | 417.2 ± 14.2 | 346.2 ± 15.7† | 387.6 ± 12.5 |
| Day 100 | C male (n = 6) | R male (n = 6) | C female (n = 6) | R female( n = 6) |
|---|---|---|---|---|
| Systolic pressure (mmHg) | 127.4 ± 2.0 | 143.0 ± 4.2* | 116.6 ± 2.2††† | 129.2 ± 3.5*† |
| Diastolic pressure (mmHg) | 102.8 ± 3.7 | 118.4 ± 4.2* | 93.3 ± 3.4† | 109.2 ± 4.1* |
| Mean arterial pressure (mmHg) | 115.3 ± 2.5 | 130.5 ± 4.3* | 105.4 ± 2.8† | 118.9 ± 3.9* |
| Heart rate (beats min−1) | 361.2 ± 16.4 | 379.2 ± 12.0 | 362.0 ± 16.5 | 395.2 ± 10.9 |
| Day 200 | C male (n = 5) | R male (n = 6) | C female (n = 5) | R female (n = 5) |
|---|---|---|---|---|
| Systolic pressure (mmHg) | 131.9 ± 2.6 | 150.4 ± 2.3**** | 131.2 ± 4.2 | 146.9 ± 4.0* |
| Diastolic pressure (mmHg) | 108.7 ± 2.8 | 122.4 ± 3.6* | 100.5 ± 4.4 | 120.4 ± 3.9** |
| Mean arterial pressure (mmHg) | 120.5 ± 2.6 | 136.6 ± 2.8*** | 116.6 ± 4.4 | 134.0 ± 4.0* |
| Heart rate (beats min−1) | 402.1 ± 7.2 | 405.7 ± 4.1 | 339.3 ± 21.6† | 411.3 ± 20.2* |
C: control, R: nutritional restriction. Values are given as means ± s.e.m.
P < 0.05
P < 0.01
P< 0.005
P < 0.001, and, C vs. R of same sex at same age
P < 0.05
P < 0.01
P < 0.005, male vs. female for same age and same group (R or C)
Figure 1. Systolic, diastolic and mean arterial pressures in offspring of control (C) dams (□) and of nutritionally restricted (R) dams (▪) at 60, 100 and 200 days of age.

Values are given as means +s.e.m. *P < 0.05, **P < 0.01 and ***P < 0.005 for R vs. C of same age.
Vascular responses in vitro
Data for arterial size and vascular function in the isolated arteries are shown in Table 4. The normalised artery internal diameter was similar in the C and R groups at each age studied.
Table 4.
Vascular function in offspring of control and nutritionally restricted dams
| Day 20 | Day 100 | |||||
|---|---|---|---|---|---|---|
| C (n =7) | R (n = 6%) | C male (n = 6%) | R male (n = 5%) | C female (n = 5%) | R female (n = 6%) | |
| Lumen diameter (μm) | 277.8 ± 17.1 | 301.0 ± 40.8 | 302.3 ± 24.7 | 304.1 ± 27.8 | 369.6 ± 30.2 | 324.7 ± 29.6 |
| Maximal contraction | ||||||
| 125 mmol l−1 K (mN mm−1) | 2.26 ± 0.23 | 2.79 ± 0.46 | 1.96 ± 0.28 | 1.96 ± 0.53 | 2.81 ± 0.23 | 2.73 ± 0.31 |
| Phenylephrine (%K) | 45.7 ± 9.4 | 19.2 ± 7.7* | 71.6 ± 5.5 | 76.1 ± 2.8 | 76.8 ± 7.1 | 75.7 ± 2.3 |
| Noradrenaline (%K) | 31.1 ± 7.8 | 8.3 ± 3.7* | 98.3 ± 2.8 | 94.9 ± 5.0 | 98.0 ± 3.8 | 100.5 ± 3.1 |
| U46619 (%K) | 90.9 ± 9.0 | 97.6 ± 10.6 | 32.9 ± 4.6 | 55.2 ± 10.3* | 62.5 ± 8.7† | 49.9 ± 5.8 |
| Maximum relaxation | ||||||
| ACh (%) | 97.0 ± 1.3 | 90.4 ± 8.0 | 40.3 ± 4.1 | 51.7 ± 7.2 | 59.8 ± 9.1† | 69.4 ± 8.6 |
| SNP (%) | 98.2 ± 3.1 | 100.3 ± 3.4 | 96.5 ± 3.2 | 87.9 ± 3.8* | 98.2 ± 2.1 | 89.0 ± 2.4* |
| pEC50 (–log m) | ||||||
| K | — | — | — | — | — | — |
| Phenylephrine | 5.91 ± 0.23 | 5.75 ± 0.13 | 5.29 ± 0.11 | 5.17 ± 0.07 | 5.22 ± 0.08† | 5.32 ± 0.03 |
| Noradrenaline | — | — | 5.46 ± 0.17 | 5.24 ± 0.12 | 5.36 ± 0.12 | 5.42 ± 0.03 |
| U46619 | 6.82 ± 0.16 | 6.99 ± 0.30 | 6.27 ± 0.12† | 6.51 ± 0.11 | 6.47 ± 0.17 | 6.62 ± 0.14 |
| ACh | 7.19 ± 0.18 | 6.73 ± 0.07 | n.a. | n.a. | n.a. | n.a. |
| SNP | 7.64 ± 0.10 | 7.42 ± 0.19 | 7.40 ± 0.15 | 6.90 ± 0.24 | 7.15 ± 0.14 | 7.10 ± 0.21 |
| Day 200 | ||||
|---|---|---|---|---|
| C male (n = 6%) | R male (n = 6%) | C female (n = 5%) | R female (n = 5%) | |
| Lumen diameter (μm) | 245.4 ± 17.8 | 283.9 ± 13.9 | 282.7 ± 32.8 | 247.6 ± 23.8 |
| Maximal contraction | ||||
| 125 mmol l−1 K (mN mm−1) | 1.96 ± 0.26 | 2.52 ± 0.52 | 2.74 ± 0.50 | 1.89 ± 0.24 |
| Phenylephrine (%K) | 73.4 ± 4.3 | 75.9 ± 4.0 | 85.5 ± 3.8 | 79.0 ± 3.6 |
| Noradrenaline (%K) | 95.6 ± 3.9 | 88.9 ± 3.1 | 98.9 ± 3.0 | 96.7 ± 3.8 |
| U46619 (%K) | 22.1 ± 3.7 | 38.0 ± 3.7* | 44.6 ± 4.3†† | 50.9 ± 4.5 |
| Maximum relaxation | ||||
| ACh (%) | 30.4 ± 15.0 | 33.1 ± 8.2 | 21.9 ± 4.4 | 26.8 ± 3.5 |
| SNP (%) | 85.1 ± 4.3 | 85.8 ± 2.6 | 87.8 ± 2.1 | 88.2 ± 4.0 |
| pEC50 (–log m) | ||||
| K | 1.18 ± 0.01 | 1.30 ± 0.02** | 1.30 ± 0.01†† | 1.30 ± 0.03 |
| Phenylephrine | 5.27 ± 0.07 | 5.22 ± 0.06 | 5.37 ± 0.08 | 5.38 ± 0.12 |
| Noradrenaline | 5.40 ± 0.09 | 5.31 ± 0.11 | 5.53 ± 0.17 | 5.35 ± 0.05 |
| U46619 | 6.37 ± 0.05 | 6.75 ± 0.15* | 6.72 ± 0.12 | 6.59 ± 0.22 |
| ACh | n.a. | n.a. | n.a. | n.a. |
| SNP | 7.38 ± 0.09 | 6.94 ± 0.22 | 7.23 ± 0.13 | 6.98 ± 0.04 |
C. control; R, nutritional restriction. Values are given as means ± s.e.m.
P < 0.05
P < 0.01, male vs. female for same age and same group (R or C)
P < 0.05
P < 0.01, C vs. R of same sex at same age for responses observed to ACh at day 100 and day 200. % K, percentage of maximal contraction to 125 mmol l−1 KPSS. n.a., calculation of pEC50 was not appropriate.
Constrictor responses
Day 20 R offspring showed reduced maximal responses to PE (Fig. 2) and NA (Fig. 3) compared with C offspring of the same age. PE responses showed similar changes with age in both R and C groups; maximal constriction to PE increased from day 20 to day 200 (P < 0.001 in all groups). Similarly maximal responses to NA increased over the same period (P < 0.001 in all groups). Conversely, in both R and C groups responses to U46619 declined progressively from day 20 to day 200 (Fig. 4 maximum contraction 20 vs. 200 days, P < 0.001 for all groups).
Figure 2. Vasoconstriction to phenylephrine (PE) in femoral arteries (day 20) and branches of the femoral artery (day 100 and 200) in offspring of control (C) and nutritionally restricted (R) dams.
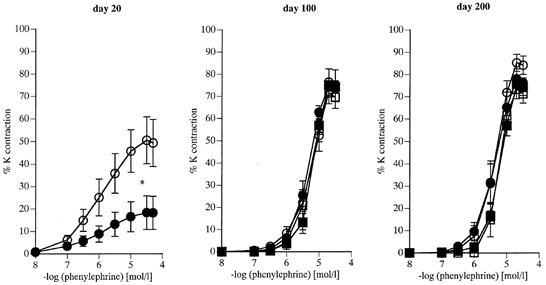
Data are expressed as a percentage of the response to 125 mm KCl. 20 days: C offspring (^, n = 7), R offspring (•, n = 6). 100 days: C females (^, n = 5), R females (•, n = 6); C males (□, n = 6), R males (▪, n = 6). 200 days: C females (^, n = 5), R females (•, n = 5); C males (□, n = 6), R males (▪, n = 6). Values are given as means +s.e.m. *P < 0.05 for maximal constriction R vs. C.
Figure 3. Vasoconstriction to noradrenaline (NA) in femoral arteries (day 20) and branches of the femoral artery (day 100 and 200) of offspring of control and nutritionally restricted dams.
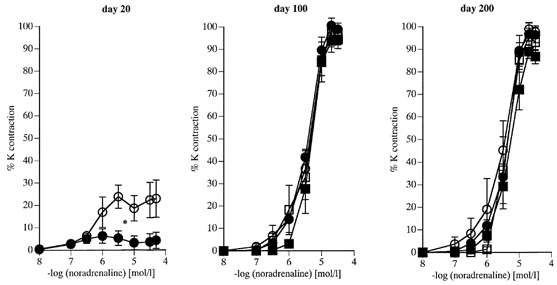
Data are expressed as a percentage of the response to 125 mm KCl. 20 days: C offspring (^, n = 7), R offspring (•, n = 6). 100 days: C females (^, n = 5), R females (•, n = 6); C males (□, n = 6), R males (▪, n = 6). 200 days: C females (^, n = 5), R females (•, n = 5); C males (□, n = 6), R males (▪, n = 6). Values are given as means +s.e.m. *P < 0.05 for maximal constriction R vs. C.
Figure 4. Vasoconstriction to the thromboxane mimetic U46619 in femoral arteries (day 20) and branches of the femoral artery (day 100 and 200) of offspring of control and nutritionally restricted dams.
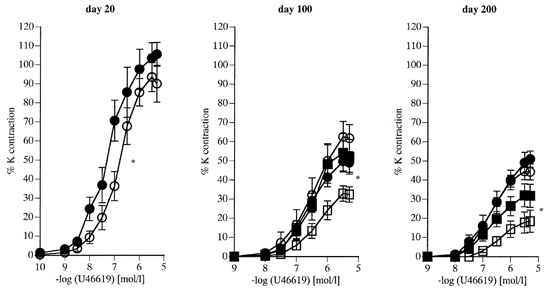
Data are expressed as a percentage of the response to 125 mm KCl. 20 days: C offspring (^, n = 7), R offspring (•, n = 6). 100 days: C females (^, n = 5), R females (•, n = 6); C males (□, n = 6), R males (▪, n = 6). 200 days: C females (^, n = 5), R females (•, n = 5); C males (□, n = 6), R males (▪, n = 6). Values are given as means +s.e.m. *P < 0.05 at 20 days of age (ANOVA); *P < 0.05 for maximal constriction R males vs. C males at 100 and 200 days of age.
At 20 days, concentration responses to U46619 were enhanced in the R group (P < 0.05 by ANOVA) and maximal responses were greater in R males than in C males at 100 and 200 days. These enhanced constrictor responses were confined to the males, as responses to U46619 were similar between R and C females at these ages (Fig. 4). Gender differences to U46619 were also noted; the 100- and 200-day-old C females showing enhanced maximal responses when compared with C males of the same age (Fig. 4).
Maximal contraction to 125 mmol l−1 potassium was similar between C and R offspring of each age group (Table 4). Similarly to the responses to U46619, male R offspring showed increased sensitivity to potassium at day 200 compared with C males (pEC50, P < 0.01), but again responses in females were no different between R and C animals. Gender differences within groups were again apparent, C and R female arteries showed greater sensitivity to K than C males at 200 days (Fig. 5).
Figure 5.

Vasoconstriction to increasing concentrations of KCl in PSS in branches of the femoral artery of 200-day-old offspring of control (C) and nutritionally restricted (R) dams. C females (^, n = 5), R females (•, n = 5); C males (□, n = 6), R males (▪,n = 6). Values are given as means +s.e.m. **P < 0.01 for EC50 R male vs. C male.
Endothelium-dependent and -independent vasodilatation
Preconstrictor tension development was not significantly different between R and C groups at any age. Endothelium-dependent relaxation to ACh showed a non-significant rightward shift of the concentration-response curve in the day 20 R offspring compared with day 20 C offspring. Maximal relaxation to ACh decreased with age in male and female C and R offspring, (Fig. 6, Table 4; 20 vs. 200 days, P < 0.001 in all groups) and was greater in female than in male C offspring at day 100. Maximal dilatation to SNP was blunted in day 100 male and female R offspring when compared with C males and C females respectively (Fig. 7).
Figure 6. Vasodilatation to acetylcholine in femoral arteries (day 20) and branches of the femoral artery (day 100 and 200) of offspring of control (C) and nutritionally restricted (R) dams.

Data are expressed as a percentage of preconstricted tone. 20 days: C offspring (^, n = 7), R offspring (•, n = 6). 100 days: C females (^, n = 5), R females (•, n = 6); C males (□, n = 6), R males (▪, n = 6). 200 days: C females (^, n = 5), R females (•, n = 5); C males (□, n = 6), R males (▪, n = 6). Values are given as means +s.e.m.
Figure 7. Vasodilation to sodium nitroprusside in femoral arteries (day 20) and branches of the femoral artery (day 100 and 200) of offspring of control (C) and nutritionally restricted (R) dams.

Data are expressed as a percentage of preconstricted tone. 20 days: C offspring (^, n = 7), R offspring (•, n = 6). 100 days: C females (^, n = 5), R females (•, n = 6); C males (□, n = 6), R males (▪, n = 6). 200 days: C females (^, n = 5), R females (•, n = 5); C males (□, n = 6), R males (▪, n = 6). Values are given as means +s.e.m. *P < 0.05 for R female vs. C female and R male vs. C male at 100 days of age (maximal relaxation).
DISCUSSION
This study has shown that moderate global dietary reduction in pregnant rats leads to abnormal and steadily increasing diastolic, systolic and mean arterial blood pressure with age in male and female adult offspring. The young offspring and male adult offspring of the nutritionally deprived animals also demonstrated abnormalities of vascular function in isolated peripheral arteries. In addition, we have shown that remarkable changes occur in the peripheral artery vascular function as normal animals mature.
The 6% reduction in maternal body weight in the late gestation pregnant rats on the restricted diet was similar to a previous study in which maternal 50% isocaloric protein deprivation was also found to induce hypertension in the offspring (Langley & Jackson, 1994). The offspring in the present study, while small at birth (16% reduction in weight), were of similar weight to controls by 20 days of age. Earlier studies reporting an association between maternal nutritional deprivation and hypertension in the offspring have generally (Langley & Jackson, 1994, 1995; Woodall et al. 1996, 1999, Langley-Evans, 2000) but not always (Langley-Evans et al. 1996b) reported a reduction in birthweight, but this has varied widely from study to study. Maternal protein restriction in rats has been associated with accelerated catch-up growth (Langley-Evans & Jackson, 1995), but also persistent growth retardation (Desai et al. 1997). The weight profile in the present study (mild growth retardation with no accelerated catch-up phase), shared similarities with that reported in one investigation only, a study in which 60% protein restricted offspring were cross-fostered at birth with a dam on a normal diet (Desai et al.1997b).
The day-old pups of the restricted dams had smaller lungs but larger livers than controls. The smallness of the lungs may reflect immaturity and could have consequences for later respiratory function. The increase in liver weight in the day-old offspring is of interest, as others (Langley Evans et al. 1995c; Ozanne et al. 1996, 1998; Desai et al. 1997a,b) have reported hepatic enzymatic changes in the offspring of protein restricted dams, although to our knowledge no increase in liver weight has been recorded. A reduction in kidney size, as observed in the 100-day-old males, has been reported in the offspring of protein-restricted rats (Langley-Evans et al. 1996c) and abnormalities in the renin-angiotensin system have been implicated in the raised blood pressure in these animals (Langley-Evans & Jackson, 1995a; Sherman & Langley-Evans, 1998). Of relevance, reduced nephron number has been associated with human fetal growth retardation (Hinchcliffe et al. 1992) and one study has recently reported an association of adulthood renal disease (Hoy et al. 1999) in low birth weight subjects.
The majority of studies in offspring of rats which have been nutritionally deprived in gestation have measured blood pressure with an external (tail-cuff) device in the conscious restrained animal, and have only reported systolic pressures. These have uniformally been raised (Langley & Jackson, 1994; Langley-Evans & Jackson, 1995; Langley-Evans et al. 1996b,c; Woodall et al. 1996, 1999; Gardner et al. 1997). Direct comparisons with the present study are hindered by differences in baseline pressures. In rats of a similar age to the 60-day-old group in this study, systolic blood pressure of controls measured by the tail-cuff method was 137 mmHg (Langley & Jackson, 1994) compared with 113 mmHg measured by femoral artery catheter reported here. Systolic pressures of the control rats in the present study were however similar to those recorded by a remote telemetric method in unrestrained conscious rats (Tonkiss et al. 1998). Nonetheless, diastolic pressures were higher (103 mmHg at 100 days vs. 89 mmHg in 96-day-old control male rats) suggesting a possible element of baseline stress, and again demonstrating variability amongst the different methods of measurement.
Despite differences in baseline pressures, the absolute elevation in systolic pressure observed in 60-day-old R males in this study was comparable to that in similarly aged offspring of protein-restricted (9% casein) animals (Langley & Jackson, 1994). Both observations contrast with the study of Tonkiss et al. (1998) which, using the telemetric method, reported only a minor elevation of basal diastolic blood pressure in the waking phase in offspring of rats fed a 6% casein diet. However, the offspring in that study demonstrated an enhanced pressor response to olfactory stress, evoked by the introduction of an ammonium hydroxide swab into the cage. In the light of these observations we cannot conclude whether the greater elevation in blood pressure in the nutritionally deprived offspring in this study compared to that of Tonkiss et al. (1998) is simply a reflection of the different dietary protocols used or the result of an altered response to stress.
To our knowledge this is the first study to describe gender differences in blood pressure among the offspring of nutritionally restricted dams. The data suggest that the insult of mild dietary restriction in gestation leads to higher blood pressure in young males than young females. Other studies using the tail-cuff method have not observed gender differences and may reflect the lower sensitivity of the method used; Langley-Evans et al. (1996c) have shown no difference in blood pressure of male and female 4-week-old offspring of protein-restricted dams and Woodall et al. (1999) considered male and female offspring together as no gender differences were apparent in offspring of control or restricted groups. Studies in 60-day-old oophorectomised offspring of the nutritionally restricted dams are planned to determine if female sex hormones offer protection against the rise in blood pressure observed in the males.
Maternal 50% casein restriction in the rat is associated with insulin resistance in the offspring (Ozanne et al. 1998), an abnormality strongly linked with hypertension. In the present study, there was no evidence of overt insulin resistance as fasting plasma glucose was normal. However, as neither glucose tolerance tests nor euglycaemic hyperinsulinaemic clamps were performed, a role for insulin resistance cannot be excluded.
The femoral vascular system plays an important role in the control of peripheral vascular resistance and some functional characteristics of the offsprings’ femoral arteries were altered by maternal dietary restriction. The arteries of the young (20 day) normal control pups showed weak responses to PE and NA, but this was much reduced in arteries of the young R offspring, despite similar maximal responses to potassium. A rightward shift in the response to ACh in the R offspring failed to reach significance. The blunted response to catecholamines was not maintained into adulthood, but the data do suggest that maternal dietary restriction may, by reduced sympathetic responsiveness, compromise cardiovascular homeostasis of the young animal. We cannot speculate whether any damaging sequelae would persist into adulthood and it is possible that, although pronounced, these abnormalities may be entirely unrelated to the subsequent development of adulthood hypertension.
Two defects were present in the oldest R offspring (200 days) and were evident only in males. Firstly, the maximal response to the thromboxane mimetic, U46619, which decreased with age in the normal animals, was significantly enhanced and secondly, sensitivity to potassium increased. Although each effect was small, together they could contribute to the hypertension in the male R offspring. The only parameter of isolated artery function to be abnormal in the R females was a small reduction in maximal responsiveness to SNP at 100 days, which did not persist in the older animals. Other parameters of cardiovascular function, not evaluated, must therefore lead to hypertension in females. Clearly a broader spectrum of functional studies is warranted, particularly in female rats.
Abnormal thromboxane responses, as observed in the R males in present study, have frequently been implicated in hypertension in the spontaneously hypertensive rat model (Huang & Koller, 1997). Recently, an association between overexpression of the thromboxane A2 membrane receptor (TP) and intrauterine growth restriction has been observed in mice (Rocca et al. 2000), warranting future investigation of the expression of TP in our model. The increase in sensitivity to a depolarising potassium stimulus in the 200-day-old R males suggests abnormal voltage-gated calcium channels, or sensitivity of the contractile apparatus to calcium.
This study has shown clearly that both hypertension and vascular dysfunction in the offspring of the globally undernourished rats were predominant among the males. Gender differences have not commonly been reported among offspring abnormalities induced by maternal dietary deprivation. However, lowered plasma cholesterol and triacylglycerol (Lucas et al. 1996), and raised concentrations of insulin (Desai et al. 1997), have been found to predominate in the male offspring of protein-deprived rats.
We have not attempted to explore which element or elements of maternal dietary deprivation are responsible for the rise in blood pressure and vascular dysfunction in the offspring. Recent investigations have implicated potential roles for an imbalance of micronutrients (Langley-Evans, 2000), and we and others have postulated a role for altered fat composition (Langley-Evans et al. 1996a; Koukkou et al. 1998; Ghosh et al. 1999; Langley-Evans, 2000). Future studies are planned to evaluate the role of individual dietary components in the defects we have observed.
Although this study was designed primarily to investigate responses to maternal undernutrition, a remarkable pattern of change in constrictor and dilator responses became apparent as the C and R animals matured. Most previous studies of ageing have compared young and very old adults (Lang et al. 1995) and few have followed development of the peripheral vasculature in younger animals. Constrictor responses to the catecholamines PE and NA increased with age with respect to the maximal response to depolarising potassium. The very weak responses in the young rat pups would suggest that adrenergic vascular control may be relatively unimportant in early life. We have recently further investigated this phenomenon and have found that substantial noradrenaline-stimulated nitric oxide synthesis accounts for the weak constrictor response to noradrenaline (Nishina et al. 1999). In the present study ACh-induced dilatation was fully developed in the skeletal circulation of the young rats, but deteriorated with age. Blunted ACh-induced relaxation has been reported previously in older rats (Kung & Luscher, 1995) and has been implicated in increasing cardiovascular risk with age.
Responses to the thromboxane mimetic U46619, in contrast to NA and PE, declined with age. Gender differences were also apparent in both C and R groups, the arteries from the female animals being more responsive. Greater pressor responses to U46619 have previously been observed in the isolated pulmonary circulation of female rats (Farhat & Ramwell, 1992), an observation attributed to the stimulatory effects of oestradiol. A sex difference in the relative contributions of NO and EDHF (endothelium-derived hyperpolarising factor) to agonist-mediated endothelium-dependent dilatation (McCulloch & Randall, 1998) has also recently been reported and may be of relevance to the greater response to ACh observed in the 100-day-old female offspring.
In summary, this study has shown that moderate global dietary deprivation in rats which leads to only transient growth retardation in the pups, induces hypertension in male and female offspring in adulthood. The data suggest that the maternal diet ‘programmes’ the fetus to develop hypertension and that peripheral artery dysfunction could contribute to hypertension in adult male animals. Mechanisms underlying the origin of the hypertension, particularly in the female offspring, require further detailed investigation.
Acknowledgments
This work was supported by the British Heart Foundation project grant 97174 and 98101. L.P. is supported by Tommy’s Campaign.
References
- Barker DJP, Bull AR, Osmond C, Simmonds SJ. Fetal and placental size and risk of hypertension in later life. British Medical Journal. 1990;301:259–263. doi: 10.1136/bmj.301.6746.259. [DOI] [PMC free article] [PubMed] [Google Scholar]
- Barker DJP, Gluckman KN, Godfrey JE, Harding JE, Owens JA, Robinson JS. Fetal nutrition and cardiovascular disease in adult life. Lancet. 1993;341:938–941. doi: 10.1016/0140-6736(93)91224-a. [DOI] [PubMed] [Google Scholar]
- Desai M, Byrne CD, Meeran K, Martenz MD, Bloom SR, Hales CN. Regulation of hepatic enzymes and insulin levels in offspring of rat dams fed a reduced protein diet. American Journal of Physiology. 1997a;273:G899–904. doi: 10.1152/ajpgi.1997.273.4.G899. [DOI] [PubMed] [Google Scholar]
- Desai M, Byrne CD, Zhang J, Petry CJ, Lucas A, Hales CN. Programming of hepatic insulin-sensitive enzymes in offspring of rat dams fed a protein restricted diet. American Journal of Physiology. 1997b;272:G1082–1090. doi: 10.1152/ajpgi.1997.272.5.G1083. [DOI] [PubMed] [Google Scholar]
- Farhat MY, Ramwell PW. Estradiol potentiates the vasopressor response of the isolated perfused rat lung to the thromboxane mimic U-46619. Journal of Pharmacology and Experimental Therapeutics. 1992;261:686–691. [PubMed] [Google Scholar]
- Gardner DS, Jackson AA, Langley-Evans SC. Maintenance of maternal diet-induced hypertension in the rat is dependent on glucocorticoids. Hypertension. 1997;30:1525–1530. doi: 10.1161/01.hyp.30.6.1525. [DOI] [PubMed] [Google Scholar]
- Ghosh P, Poston L. Adult offspring of rats fed a diet high in saturated fat during pregnancy demonstrate vascular and metabolic abnormalities. Journal of the Society of Gynecologic Investigation. 1999;6(S1):172A. [Google Scholar]
- Hanson MA, Hawkins P, Ozaki T, Steyn C, Matthews SG, Noakes D, Poston L. Effects of experimental dietary manipulation during early pregnancy in cardiovascular and endocrine function in fetal sheep and young lambs. In: Barker DJP, Wheeler T, editors. Fetal Programming, Consequences for Health in Later Life. ROCG Press; 1999. pp. 365–373. [Google Scholar]
- Hawkins P, Crowe C, McGarrigle HHG, Calder NA, Saito T, Stratford LL, Noakes DE, Hanson MA. Effect of maternal nutrient restriction in early gestation on development of the hypothalamic pituitary axis in fetal sheep at 0. 8–0.9 of gestation. Journal of Endocrinology. 1999;163:553–561. doi: 10.1677/joe.0.1630553. [DOI] [PubMed] [Google Scholar]
- Hinchcliffe SA, Lynch MR, Sargent PH, Howard CV, Van Velzen D. The effect of intrauterine growth retardation on the development of renal nephrons. British Journal of Obstetrics and Gynecology. 1992;99:296–301. doi: 10.1111/j.1471-0528.1992.tb13726.x. [DOI] [PubMed] [Google Scholar]
- Hoy WE, Rees M, Kile E, Mathews JD, Wang Z. A new dimension to the Barker hypothesis; Low birthweight and susceptibility to renal disease. Kidney International. 1999;56:1072–1077. doi: 10.1046/j.1523-1755.1999.00633.x. [DOI] [PubMed] [Google Scholar]
- Huang A, Koller A. Endothelin and prostaglandin H2 enhance arteriolar myogenic tone. Hypertension. 1997;30:1210–1205. doi: 10.1161/01.hyp.30.5.1210. [DOI] [PubMed] [Google Scholar]
- Koukkou E, Ghosh P, Lowy C, Poston L. Offspring of normal and diabetic rats fed saturated fat in pregnancy demonstrate vascular dysfunction. Circulation. 1998;98:2899–2904. doi: 10.1161/01.cir.98.25.2899. [DOI] [PubMed] [Google Scholar]
- Kung CF, Luscher TF. Different mechanisms of endothelial dysfunction with ageing and hypertension in rat aorta. Hypertension. 1995;25:194–200. doi: 10.1161/01.hyp.25.2.194. [DOI] [PubMed] [Google Scholar]
- Lang MG, Noll G, Luscher TF. Effect of ageing and hypertension on contractility of resistance arteries: modulation by endothelial factors. American Journal of Physiology. 1995;269:H837–844. doi: 10.1152/ajpheart.1995.269.3.H837. [DOI] [PubMed] [Google Scholar]
- Langley SC, Jackson AA. Increased systolic blood pressure in adult rats induced by fetal exposure to maternal low protein diets. Clinical Science. 1994;86:217–222. doi: 10.1042/cs0860217. [DOI] [PubMed] [Google Scholar]
- Langley-Evans SC. Critical differences between two low protein diet protocols in the programming of hypertension in the rat. International Journal of Food Sciences and Nutrition. 2000;51:11–17. doi: 10.1080/096374800100859. [DOI] [PubMed] [Google Scholar]
- Langley-Evans SC, Clamp AG, Grimble RF, Jackson AA. Influence of dietary fats upon systolic blood pressure in the rat. International Journal of Food Sciences and Nutrition. 1996a;13:319–324. doi: 10.3109/09637489609006955. [DOI] [PubMed] [Google Scholar]
- Langley-Evans SC, Gardner DS, Jackson AA. Association of disproportionate growth of fetal rats in late gestation with raised systolic blood pressure in later life. Journal of Reproduction and Fertility. 1996b;106:307–312. doi: 10.1530/jrf.0.1060307. [DOI] [PubMed] [Google Scholar]
- Langley-Evans SC, Jackson AA. Captropril normalises blood pressure in rats with hypertension induced by fetal exposure to maternal low protein diets. Comparative Biochemistry and Physiology. 1995;110:223–228. doi: 10.1016/0300-9629(94)00177-u. [DOI] [PubMed] [Google Scholar]
- Langley-Evans SC, Welham SJ, Sherman RC, Jackson AA. Weanling rats exposed to maternal low-protein diets during discrete periods of gestation exhibit differing severity of hypertension. Clinical Science. 1996c;91:607–615. doi: 10.1042/cs0910607. [DOI] [PubMed] [Google Scholar]
- Langley-Evans SC, Wood S, Jackson AA. Enzymes of the gamma-glutamyl cycle are programmed in utero by maternal nutrition. Annals of Nutrition and Metabolism. 1995;39:28–35. doi: 10.1159/000177839. [DOI] [PubMed] [Google Scholar]
- Lucas A, Baker BA, Desai M, Hales CN. Nutrition in pregnant or lactating rats programs lipid metabolism in the offspring. British Journal of Nutrition. 1996;76:605–612. doi: 10.1079/bjn19960066. [DOI] [PubMed] [Google Scholar]
- McCulloch AI, Randall MD. Sex differences in the relative contributions of nitric oxide and EDHF to agonist-stimulated endothelium-dependent relaxations in the rat isolated mesenteric vascular bed. British Journal of Pharmacology. 1998;123:1700–1706. doi: 10.1038/sj.bjp.0701781. [DOI] [PMC free article] [PubMed] [Google Scholar]
- Mulvany MJ, Halpern W. Contractile properties of small arterial resistance vessels in spontaneously hypertensive and normotensive rats. Circulation Research. 1977;14:19–26. doi: 10.1161/01.res.41.1.19. [DOI] [PubMed] [Google Scholar]
- Nishina H, Ozaki T, Hanson MA, Poston L. Mechanisms of noradrenaline-induced vasorelaxation in isolated femoral arteries of the rat. British Journal of Pharmacology. 1999;127:809–812. doi: 10.1038/sj.bjp.0702641. [DOI] [PMC free article] [PubMed] [Google Scholar]
- Ozanne SE, Martensz ND, Petry CJ, Loizou CL, Hales CN. Maternal low protein diet in rats programmes fatty acid desaturase activities in the offspring. Diabetologia. 1998;41:1337–1342. doi: 10.1007/s001250051074. [DOI] [PubMed] [Google Scholar]
- Ozanne SE, Smith GD, Tikerpae J, Hales CN. Altered regulation of hepatic glucose output in the male offspring of protein-malnourished dams. American Journal of Physiology. 1996;270:E559–564. doi: 10.1152/ajpendo.1996.270.4.E559. [DOI] [PubMed] [Google Scholar]
- Phillips DIW, Barker DJP, Hales CN, Hirst S, Osmond C. Thinness at birth and insulin resistance in adult life. Diabetologia. 1994;37:150–154. doi: 10.1007/s001250050086. [DOI] [PubMed] [Google Scholar]
- Rocca B, Loieb AL, Strauss JF, Vezza R, Habib A, Li H, Fitzgerald GA. Directed vascular expression of the thromboxane A2 receptor results in intrauterine growth restriction. Nature Medicine. 2000;6:219–21. doi: 10.1038/72334. [DOI] [PubMed] [Google Scholar]
- Sherman RC, Langley-Evans SC. Early administration of angiotensin-converting enzyme inhibitor captropril prevents the development of hypertension programmed by intrauterine exposure to a maternal low-protein diet in the rat. Clinical Science. 1998;94:373–381. doi: 10.1042/cs0940373. [DOI] [PubMed] [Google Scholar]
- Tonkiss J, Trzinska M, Galler JR, Ruiz-Opazo N, Herrera VL. Prenatal malnutrition-induced changes in blood pressure, dissociation of stress and non-stress responses using telemetry. Hypertension. 1998;32:108–114. doi: 10.1161/01.hyp.32.1.108. [DOI] [PubMed] [Google Scholar]
- Woodall SM, Breier BH, Johnston BM, Bassett NS, Barnard R. Administration of growth hormone or IGF-1 to pregnant rats on a reduced diet throughout pregnancy does not prevent fetal intrauterine growth retardation and elevated blood pressure in adult offspring. Journal of Endocrinology. 1999;163:69–77. doi: 10.1677/joe.0.1630069. [DOI] [PubMed] [Google Scholar]
- Woodall SM, Johnston BM, Breier BH, Gluckman PD. Chronic maternal undernutrition in the rat leads to delayed postnatal growth and elevated blood pressure of the offspring. Pediatric Research. 1996;40:438–443. doi: 10.1203/00006450-199609000-00012. [DOI] [PubMed] [Google Scholar]