Abstract
Cell wall deposition is a key process in the formation, growth, and differentiation of plant cells. The most important structural components of the wall are long cellulose microfibrils, which are synthesized by synthases embedded in the plasma membrane. A fundamental question is how the microfibrils become oriented during deposition at the plasma membrane. The current textbook explanation for the orientation mechanism is a guidance system mediated by cortical microtubules. However, too many contraindications are known in secondary cell walls for this to be a universal mechanism, particularly in the case of helicoidal arrangements, which occur in many situations. An additional construction mechanism involves liquid crystalline self-assembly [A. C. Neville (1993) Biology of Fibrous Composites: Development Beyond the Cell Membrane (Cambridge Univ. Press, Cambridge, U.K.)], but the required amount of bulk material that is able to equilibrate thermally is not normally present at any stage of the wall deposition process. Therefore, we have asked whether the complex ordered texture of helicoidal cell walls can be formed in the absence of direct cellular guidance mechanisms. We propose that they can be formed by a mechanism that is based on geometrical considerations. It explains the genesis of the complicated helicoidal texture and shows that the cell has intrinsic, versatile tools for creating a variety of textures. A compelling feature of the model is that local rules generate global order, a typical phenomenon of life.
The microfibrils in higher plants are made of cellulose, the most abundant macromolecule on earth. They are long (≫ μm) (1) and thin (3–4 nm) (2). In the cell wall, they are linked (3) to wall matrix molecules (4). The matrix material is excreted into the wall by exocytosis. Also, exocytotic vesicle membranes carry particle rosettes (5), the putative cellulose synthases in their membrane (6). After having been inserted in the plasma membrane (7), the synthases spin out the microfibrils while moving in the membrane (8), propelled by forces exerted by the polymerization of the enzymes’ own product (9). Thus, the synthases move in the plane of the plasma membrane, spinning their product out into a matrix of hemicelluloses, pectins, glycoproteins, phenols, and water. This construction is reminiscent of high tensile steel rods in reinforcing a concrete matrix. The spatial disposition of the cellulose microfibrils in the wall determines many of the mechanical properties of the wall, which in turn govern the geometry of cell growth.
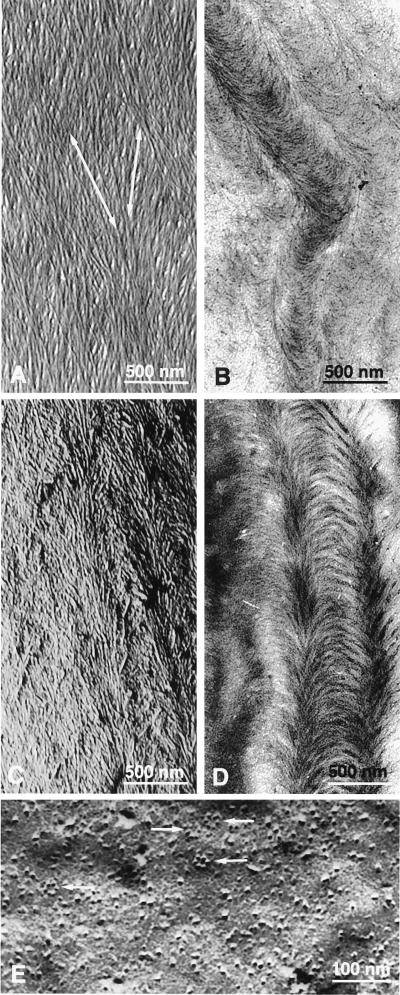
Microfibrils produced by the current population of synthases in the plasma membrane lie in a co-planar lamella at the innermost face of the wall. On a larger scale, the wall consists of stacks of these lamellae, all parallel to the plasma membrane, with the most recent closest to the membrane. In helicoidal walls, it is especially clear that the lamellae are one microfibril thick, that the fibrils within a lamella lie more or less parallel to each other, and that the microfibril orientation in each subsequent lamella rotates with respect to that of neighboring lamellae by a constant angle (Fig. 1a). This organization produces the optical illusion of arcs in oblique thin sections (Figs. 1 b and d) as confirmed by freeze fracture preparations (Fig. 1c). Figs. 1 a–d are from the secondary, i.e., nonexpanding, wall of the root hair of Equisetum hyemale, the best understood example of this class of wall texture. Fig. 1e shows particle rosettes (synthases) in the plasma membrane adjacent to this wall. Key elements of E. hyemale root hair cell wall are known. This wall has a helicoidal texture (10) with unmatching cortical microtubules (11). Particle rosettes are present in the plasma membrane (12). Particle rosettes are inserted into the plasma membrane via Golgi vesicles (13), and Golgi bodies occur along that membrane (A.M.C.E., unpublished work). This secondary cell wall is deposited inside a cylinder (14), apposed to the existing primary wall (14). The diameter of this cylinder varies from 20 (tip) to 40 (base) μm (A.M.C.E., unpublished work). The microfibrils are deposited in the constrained space between plasma membrane and cell wall (12). The lamellae of the wall are one microfibril thick (14). The cellulose microfibrils themselves are 3.6 ± 1.9 nm wide (2) and 100 ± 40 nm apart, without any gaps (15). They are not interwoven (15) and not strictly parallel (15). The rotation angle of the helicoid is 35 ± 5° (15) and is independent of fibril deposition orientation (15). Looking from the cytoplasm, from older to younger lamellae, the rotation angle is counter-clockwise (16). Microfibril deposition is simultaneously in all helicoidal orientations (14), in stretches with successive helicoidal orientations (14). The length of these stretches is independent of the fibril angle (15) and measures 250–350 μm (15). Within these stretches, the number of microfibrils increases from hair tip to hair base (15). Also, the number of lamellae increases from hair tip to hair base (15).
Figure 1.
(a) Shadow-cast preparation after matrix extraction with hydrogen peroxide/glacial acetic acid and dry cleaving of inner surface of E. hyemale root hair cell wall, showing superimposed lamellae consisting of dispersed parallel cellulose microfibrils; fibrils in successive lamellae make an angle with each other; arrows show fibril orientation in the two last deposited lamellae. Because this technique produces pictures of the last and last but one lamella, it allows the study of wall development at the microfibril scale. (b) Oblique thin section through cell wall of helicoidal wall of root hair of E. hyemale from which wall matrix had been extracted with hydrogen peroxide/glacial acetic acid, showing the typical arc pattern of the helicoidal cell wall. (c) Freeze fracture preparation of E. hyemale root hair cell wall, showing the same pattern as in b and proving that this extraction method is allowed to determine fibril orientation. (d) Stained oblique section through propane-plunged freeze substitution preparation of E. hyemale root hair cell wall, showing the arcs in this less destructive method. (e) Freeze fracture preparation of the plasmatic fracture face of the plasma membrane of root hair of E. hyemale showing particle rosettes (arrows).
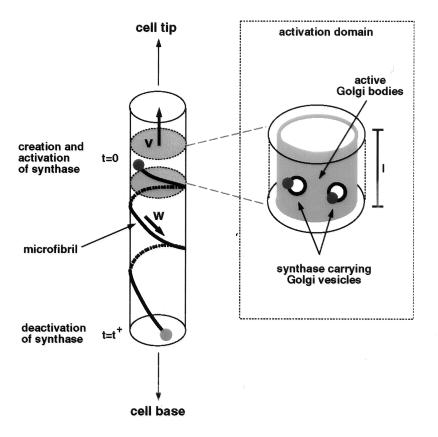
On the basis of these observations, we come to the following model. First, we assume the presence of “activation domains.” These activation domains are membrane areas in which vesicles, containing the synthases in their membranes, are inserted into the plasma membrane, in other words domains where exocytosis occurs. As will become apparent in the model, the activation domains cannot be positionally static. They must move, for example by movement of the zone of exocytosis or by an activation wave, e.g., a calcium wave, that triggers the insertion of Golgi vesicles in the plasma membrane (see Fig. 2). This is a testable assumption.
Figure 2.
Schematic showing the cycle of synthase activation in the moving activation domain (zone bounded by shaded circles) followed by microfibril production coupled to synthase motion and, finally, synthase deactivation. (Inset) How the Golgi bodies in the activation domain (surface shaded) produce vesicles that deposit the synthases they carry into the plasma membrane through vesicle fusion.
Second, once inserted, synthases move through the plasma membrane, leaving microfibrils with associated matrix molecules in their wake. We take a single microfibril with adherent matrix material, extending halfway to the neighboring microfibrils on either side as our unit of construction, denoting it by a “string.” Given the space-limiting conditions and the absence of gaps in the microfibril pattern, the deposition process can be viewed as analogous to winding strings around a cylinder in such a way that its surface is fully covered. Therefore, a simple geometrical rule must link the number of strings being wound simultaneously per cell circumference to the angle α they make with a plane perpendicular to the cell axis, as first described by Emons (17, 18).
 |
1 |
 |
The local direction of motion of the synthases at a given moment, and hence the orientation of the fibrils they are creating, is determined by the total number of active synthases in the circumference of the cylinder through which they are passing.
To proceed, we make a few simplifications. First, we neglect the lamella thickness, allowed because it is in the order of nanometers (19) whereas the circumference of the cell is in the order of micrometers. Second, we treat N/Nmax as a continuous variable, allowed because the maximum number of strings that can be deposited simultaneously, Nmax = πD/d, is large. Because of the cylindrical symmetry of our model cell and the uniform deposition, we take the local density of synthases, N(z, t), at a given location, identified by a coordinate z measured along the axis of the cell, at time t as our fundamental dynamical variable. Finally, the linear velocity w of the synthases during microfibril deposition is taken to be constant. The following evolution equation for the local density of synthases ensues:
 |
2 |
 |
3 |
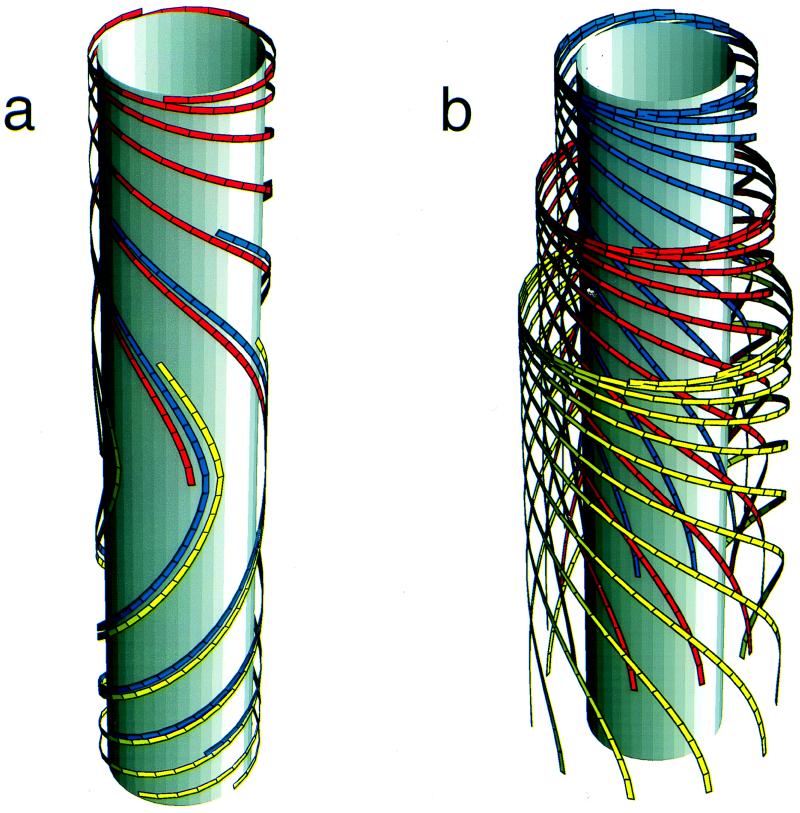
The left-hand side of this partial differential equation describes the purely kinematic part of the model. The right-hand side contains a (positive) source term describing the insertion of new active synthases into the plasma membrane at the local rate φ and a (negative) sink term describing the depletion of synthases at the local rate φ†, due to their deactivation after a finite lifetime t†. Each activation domain occupies a length l and moves at a constant velocity v. Within it, new synthases are activated at a constant rate φ0 (= number of synthases inserted per unit time) for as long as the local density remains below the maximum allowed value Nmax. We assume a feedback mechanism that keeps the synthase density from increasing beyond Nmax by shutting off further activation. By using the actual solution of the model, we generated Fig. 3. Fig. 3a shows the paths synthases follow from the sites of their activation at different positions in the same activation domain to the sites of their deactivation after a time t†. The synthases deposit microfibrils as they move, and the disposition of the microfibrils records the paths followed during the lifetime of each synthase. By contrast, Fig. 3b shows how synthases activated, at equally spaced time intervals at the same position within the activation domain, deposit microfibrils that have different orientations at the same location along the cell. The lamellae with differently oriented microfibrils create a helicoidal texture consisting of a stack of one-microfibril thick lamellae with microfibril angle in each lamella rotated at a constant angle from the previous lamella.
Figure 3.
(a) Illustration generated by using the actual solution of the model, showing three microfibrils that originated at equally spaced time intervals at different positions within the same activation domain as it moved along the cylinder and that trace out (partly coinciding) paths with continuously changing orientations. The three microfibrils shown here cover all angles between 0° and 180°. Many other microfibrils would be present in a real situation. (b) Illustration generated by using the actual solution of the model, showing three sets of microfibrils that originated at equally spaced time intervals at the same position within an activation domain. Although they started in the same position, the time difference causes them to have different angles when they reach a given location along the cell. Continuation of the process creates a stack of lamellae that is an historical record of the biosynthesis of the wall.
Images of surface preparations of helicoidal cell walls, such as Fig. 1a, do not include the full length of microfibrils. The portions of microfibrils that are present in the micrographs were under the same local conditions during their deposition; hence, they have the same average orientation. A thin section of the wall (Fig. 1b) at any location z reveals concentric shells, parts of lamellae, in which microfibrils were deposited at time t with given angle α(z, t), the innermost shells deposited more recently than the outermost. Fig. 3a shows how one single string participates in half of the lamellae that make up one helicoidal arc (as seen in Fig. 1d). To generate a full helicoidal arc in which the microfibril orientation in successive shells undergoes a full 180° turn (Fig. 1d), locally the synthase density must build up to its maximum value yielding axial fibrils (α = 90°, e.g., the middle of Fig. 3a), whereas afterward, the density must decrease to its minimum value yielding transverse fibrils. The deposition angle of the sub-maximal density is chosen to be >90°. This choice, mathematically allowed by the double valuedness of the inverse of the sine on the interval [0°, 180°], is justified on the basis of continuity of the curvature of the microfibrils being deposited. To show the generation of a 180° twist by a single activation domain, we constructed the explicit solution of Eq. 2 by using the method of characteristics (20). The depletion rate φ†(z, t) depends on the full solution in the time interval [t − t†, t] because this determines the number of synthases created a lifetime earlier that end their activity at the location z. The determination of this number is reducible to retracing the path of a single synthase in time. Such a path just traces out part of a characteristic of the evolution equation. The evolution of the density along the characteristics then is determined by a single delay-time, retarded, ordinary differential equation, which can be solved by using standard techniques (21). The criteria for the local behavior following the helicoidal scenario outlined above are given by
 |
4 |
showing how all the parameters of the model have to be interrelated. Given that these criteria are met, the explicit solution for the local angle of deposition (expressed in radians) at an arbitrary position along the cell in a single cycle due to the passage of a single activation domain is given by
 |
5 |
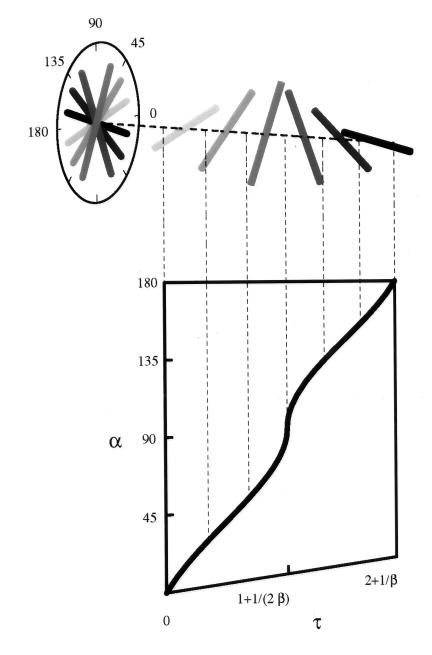
We plot this solution in Fig. 4, showing how it translates into a single twist of the helicoid. When α = 180°, one arc is completed (Fig. 3b shows half of this process), and the cycle can be repeated by a subsequent activation domain. Thus, in a wall with more helicoidal arcs, we envisage a train of activation domains. The spacing L of the domains is set by the requirement that the twists follow each other seamlessly. Explicitly, we find L = t†(2v/w + 1).
Figure 4.
Solution of the local angle α of deposition as a function of the dimensionless time τ = t/t†. Here β = v/w. The shaded rods show the predicted fibril orientation in successively equally spaced lamellae, from most recent to oldest at a given point on the surface of the cylinder.
Thus, our model, which is based on quite simple geometrical constraints and processes that are reasonable in terms of cell biology, can generate wall textures that equate very precisely with actual observations of helicoidal walls. Certain parameter values were required to achieve this outcome, and it is of great interest that the same principles can, with different values for these parameters, generate textures that mimic other important categories of plant cell wall, including random, transverse, axial, helical, crossed, and combinations of these (unpublished work). A prerequisite of the model is the space-limiting condition. When, experimentally, the space between membrane and wall is enlarged by plasmolysis, wall texture deposition indeed becomes irregular (22). The geometrical model yields a tractable theory with few free parameters: In the absence of obstructions, the microfibrils will be deposited along paths determined by the geometry of the cell alone.
So: Is there a role left for microtubules in cell wall deposition, as many workers in the field believe? (23). It is a well established fact that expanding cells, or cell parts like root hair tips (15), have parallel cortical microtubules and nascent microfibrils. Both the microtubules and the microfibrils lie transverse to the elongation direction of the cell. The microtubules are thought to attach to the plasma membrane by microtubule-associated proteins and to force the synthases to run between them (24), leading to a transverse texture in unidirectionally expanding cells. The geometrical path may be the default path, overruled in elongating cells by the force exerted by the cortical microtubules. However, microtubule-associated proteins with this function have not been found yet. Of interest, also the geometrical model may predict a transverse texture in longitudinally expanding cells. If the rate of increase of plasma membrane in these cells exceeds the rate of production of rosettes, the synthases, the deposition angle will remain transverse without the intervention of microtubules (unpublished work). The challenges thus are to determine whether microtubule-associated proteins constrain the plasma membrane and whether synthase activation occurs as supposed by our geometrical model.
Acknowledgments
We thank Drs. Daan Frenkel, Ton Bisseling, and Brian Gunning for stimulating discussions. The work of B.M.M. is part of the research program of the Stichting voor Fundamenteel Onderzoek der Materie, which is supported financially by the Nederlandse Organisatie voor Wetenschappelijk Onderzoek. A.M.C.E. thanks Dr. M. M. A. Sassen for introducing her to cell wall research.
References
- 1.Haigler C H. In: Cellulose Chemistry and its Applications. Nevell R P, Zeronian S H, Chicester U, editors. London: Harwood; 1985. pp. 30–83. [Google Scholar]
- 2.Emons A M C. Acta Bot Neerl. 1988;37:31–38. [Google Scholar]
- 3.McCann M C, Roberts K. J Plant Sci. 1990;96:323–334. [Google Scholar]
- 4.Carpita N C, Gibeaut D M. Plant J. 1993;3:1–30. doi: 10.1111/j.1365-313x.1993.tb00007.x. [DOI] [PubMed] [Google Scholar]
- 5.Haigler C H, Brown R M. Planta. 1986;134:111–120. [Google Scholar]
- 6.Brown R M, Saxena I M, Kudlicka K. Trends Plant Sci. 1996;1:149–156. [Google Scholar]
- 7.Blanton R L, Haigler C H. In: Membranes: Specialized Functions in Plants. Bowles D L, Smallwood M, Knox J P, editors. Oxford: Bios Scientific Publishers; 1996. pp. 57–75. [Google Scholar]
- 8.Cutler S, Sommerville C. Curr Biol. 1997;7:R108–R111. doi: 10.1016/s0960-9822(06)00050-9. [DOI] [PubMed] [Google Scholar]
- 9.Delmer D P, Amor Y. Plant Cell. 1995;7:987–1000. doi: 10.1105/tpc.7.7.987. [DOI] [PMC free article] [PubMed] [Google Scholar]
- 10.Emons A M C. Protoplasma. 1982;113:85–87. [Google Scholar]
- 11.Emons A M C, Derksen J H M, Sassen M M A. Physiologia Plantarum. 1992;84:486–493. [Google Scholar]
- 12.Emons A M C. Planta. 1985;163:350–359. doi: 10.1007/BF00395143. [DOI] [PubMed] [Google Scholar]
- 13.Emons A M C. In: Biosynthesis and Biodegradation of Cellulose. Haigler C H, Weimer P J, editors. New York: Marcel Dekker; 1991. pp. 71–98. [Google Scholar]
- 14.Emons A M C, Wolters-Arts A M C. Protoplasma. 1983;117:68–81. [Google Scholar]
- 15.Emons A M C. Can J Bot. 1989;67:2401–2408. [Google Scholar]
- 16.Emons A M C, Derksen J. Acta Bot Neerl. 1986;35:311–320. [Google Scholar]
- 17.Emons A M C. Plant Cell Environ. 1994;17:3–14. [Google Scholar]
- 18.Emons A M C, Kieft H. Protoplasma. 1994;180:59–69. [Google Scholar]
- 19.Roberts K. Curr Opin Cell Biol. 1989;1:1020–1027. doi: 10.1016/0955-0674(89)90074-4. [DOI] [PubMed] [Google Scholar]
- 20.John F. Partial Differential Equations. New York: Springer-Verlag; 1975. [Google Scholar]
- 21.Hale J K, Verduyn Lunel S M. Introduction to Functional Differential Equations. New York: Springer-Verlag; 1993. [Google Scholar]
- 22.Reis D, Roland J C, Vian B. Protoplasma. 1985;126:36–46. [Google Scholar]
- 23.Wymer C, Lloyd C. Trends Plant Sci. 1996;1:222–228. [Google Scholar]
- 24.Staehelin L A, Giddings T H. In: Developmental Order: Its Origin and Regulation. Subtelny S, Green P B, editors. New York: Liss; 1982. pp. 133–147. [Google Scholar]


