Abstract
The origin and propagation of waves of spontaneous excitation in bundles of smooth muscle of the guinea-pig bladder were examined using intracellular recording techniques and visualization of the changes in the intracellular calcium concentration ([Ca2+]i).
Bladder smooth muscle cells exhibited spontaneous transient increases in [Ca2+]i which originated along a boundary of each smooth muscle bundle and then spread to the other boundary with a conduction velocity of 2.0 mm s−1.
Spontaneous increases in [Ca2+]i were always preceded by action potentials. Nifedipine (10 μM) abolished increases in both [Ca2+]i and action potentials. Caffeine (10 mM), ryanodine (50 μM) and cyclopiazonic acid (10 μM) reduced the amplitude of the associated increases in [Ca2+]i without preventing the generation of action potentials.
Spontaneous action potentials had conduction velocities of 40 mm s−1 in the axial direction and 1.3 mm s−1 in the transverse direction. The electrical length constants of the bundles of muscle were 425 μm in the axial direction and 12.5 μm in the transverse direction.
Neurobiotin, injected into an impaled smooth muscle cell, spread more readily to neighbouring cells located in the axial direction than those located in the transverse direction. The spread of neurobiotin was inhibited by 18β-glycyrrhetinic acid (18β-GA, 40 μM), a gap junction blocker.
Immunohistochemistry for Connexin 43 showed abundant punctate staining on the smooth muscle cell membranes.
These results suggested that spontaneous action potentials and associated calcium waves occur almost simultaneously along the boundary of bladder smooth muscle bundles and then propagate to the other boundary probably through gap junctions.
As with many other visceral smooth muscles, bladder smooth muscle strips show spontaneous phasic contractions. In spite of these contractions, bladder is compliant and able to contain several hundred millilitresof urine without showing an increased intravesical pressure. Electrophysiological studies have shown that both intact and isolated smooth muscle cells of bladder generate spontaneous action potentials which are thought to underlie the spontaneous contractions detected in intact bladders (Mostwin, 1986; Montgomery & Fry, 1992; Hashitani et al. 2000). However, if spontaneous action potentials are able to spread readily throughout the tissue, they should cause synchronized contractions with associated increases in intravesical pressure. It has been demonstrated that when current is injected into one cell it causes a resultant membrane potential change in only a small proportion of neighbouring cells (Bramich & Brading, 1996). It has also been reported that both spontaneous action potentials and increases in [Ca2+]i occurred locally and were not always associated with detectable contractions (Hashitani et al. 2000). This relatively poor electrical coupling between bladder smooth muscle cells may account for the high compliance of the normal bladder.
In contrast to the normal bladder, unstable bladders develop spontaneous increases in intravesical pressure and this has been related to urgency or urge incontinence (Turner & Brading, 1997). Smooth muscle preparations obtained from unstable bladders often develop fused tetanic contractions and an increased electrical coupling between smooth muscle cells has been proposed as the pathophysiological basis of the unstable bladder (Brading, 1997). Therefore, understanding the origin and propagation of spontaneous excitation in the normal bladder smooth muscle should be important for further investigations of the aetiology of the unstable bladder.
The origin and propagation of excitation in smooth muscle has been extensively investigated in preparations of gastrointestinal muscle. These contract synchronously and thus generate co-ordinated phasic contractions. Multiple electrode studies and visualization of calcium signals in gastric smooth muscle indicate that spontaneous excitation originates from the border between longitudinal muscle and circular muscle (Bauer et al. 1985; Stevens et al. 1999), where a set of specialized pace-making cells, interstitial cells of Cajal (ICC), are located (Sanders, 1996; Dickens et al. 1999). Once excitation has been initiated the slow waves and calcium signals propagate more rapidly in the axial direction than in the transverse direction (Bauer et al. 1985; Stevens et al. 1999). In contrast to gastrointestinal smooth muscle, bladder smooth muscle does not spontaneously generate co-ordinated contractions and special pace-making cells have not yet been identified in the bladder. Therefore it would be of interest to know whether spontaneous excitation in the bladder originates from restricted specialized sites or occurs randomly, and secondly to determine how the foci of excitation propagate within a muscle bundle.
In the present study, the origin and propagation of spontaneous excitation in bladder smooth muscle was examined. Changes in [Ca2+]i were measured in fura-PE3-loaded smooth muscle bundles of the guinea-pig. The propagation of spontaneous action potentials and the passive electrical coupling between bladder smooth muscle cells was investigated using paired intracellular recordings. To determine the role of gap junctions in the spread of excitation, the effects of 18β-GA, a gap-junction blocker, on electrical coupling and dye communication between cells was examined. The distribution of gap junctions on the bladder smooth muscle cells was investigated using immunohistochemistry for Connexin 43 (Cx43) and confocal laser scanning microscopy.
METHODS
The procedures described have been approved by the animal experimentation ethics committee at the Nagoya City University. Male guinea-pigs, weighing 200-300 g, were killed by a blow to the head followed by cervical exsanguination. The urinary bladder was removed and the ventral wall of the bladder was opened longitudinally from the top of the dome to the bladder neck. The mucosal layer, connective tissue and two or three smooth muscle bundle layers were then removed from a 5 mm square area leaving an underlying single layer of smooth muscle bundles which were attached to the outer serosal layer. A serosal sheet which contained one or two single bundles of smooth muscle 2-3 mm long and 0.3-0.8 mm wide was then prepared. This procedure markedly reduced the movement of smooth muscle bundles without disrupting the generation of either spontaneous action potentials or increases in [Ca2+]i, and thus allowed stable recordings of both membrane potential and [Ca2+]i.
Preparations were pinned out on a Sylgard plate (silicone elastomer, Dow Corning Corporation, Midland, MI, USA) at the bottom of a recording chamber (volume, approximately 1 ml) which was mounted on the stage of an inverted microscope. The preparations were superfused with warmed (35°C) physiological saline at a constant flow rate (2 ml min−1). Individual bladder smooth muscle cells were impaled with glass capillary microelectrodes, filled with 0.5 M KCl (tip resistance, 150-250 MΩ). Membrane potential changes were recorded using a high input impedance amplifier (Axoclamp-2B, Axon Instruments, Inc., Foster City, CA, USA), and displayed on a cathode-ray oscilloscope (SS-9622, Iwatsu, Tokyo, Japan). After low-pass filtering (cut-off frequency, 1 kHz), membrane potential changes were digitized and stored on a personal computer for later analysis. In experiments in which propagation of spontaneous action potentials was examined, the preparation was impaled with two independent microelectrodes and the distance and location of the two electrodes were determined with an inverted microscope. To study electrical coupling between cells, one electrode was used to inject current and the other was used to record resultant electrotonic potentials. Passive electrical properties of cells were also determined using a switching single electrode current clamp; following neutralization of the tip resistance, both hyperpolarizing and depolarizing current was passed through the recording electrode and resultant voltage changes were recorded.
For measurements of the concentration of intracellular calcium ([Ca2+]i), bladder preparations were pinned out on the bottom of a recording chamber which was similar to that used for microelectrode recordings. After 30 min incubation with warmed (35°C) physiological saline, spontaneous action potentials and visual movements of the tissues were observed. Subsequently the preparations were loaded with the fluorescent dye fura-PE3 acetoxymethyl ester (fura-PE3 AM), by incubation in low Ca2+ physiological saline (Ca2+, 1 mM) containing 10 μM fura-PE3 for 1 h at room temperature. After loading, preparations were superfused with dye-free, warmed (35°C) physiological saline at a constant flow (about 2 ml min−1) for 30 min. Preparations, loaded with fura-PE3, were illuminated with ultraviolet light, with wavelengths of 340 and 380 nm, alternating at a frequency higher than 40 Hz. The ratio of the emission fluorescence (RF340/F380) in a desired size of rectangular window was measured through a barrier filter of 510 nm (sampling time 12-25 ms), using a micro-photoluminescence measurement system (ARGUS/HiSCA, Hamamatsu Photonics, Hamamatsu, Japan). When prolonged recordings (> 10 min) for experiments with cyclopiazonic acid (CPA), caffeine or ryanodine were carried out, longer sampling times (100-160 ms) were used.
To visualize dye communications between bladder smooth muscle cells, cells were impaled with microelectrodes containing neurobiotin, impalements being confirmed by recording spontaneous action potentials. Preparations filled with neurobiotin were fixed at 4°C with fresh 4 % w/v paraformaldehyde in 0.1 M phosphate buffer. Preparations were washed six times for 10 min with 0.1 % phosphate buffered saline (PBS), incubated for 10 min, three times in 0.3 % Triton-X 100 in PBS and then incubated in streptavidin-CY3 (CY3; 1:500) for 46 h at 4°C. All preparations were washed several times with PBS, mounted in DAKO-fluorescent mounting medium (DAKO Corporation, CA, USA), covered with a coverslip and viewed with a confocal microscope (MRC-1000; BioRad, CA, USA). The confocal microscope with a krypton-argon laser, allowed the visualization of CY3 (568 nm excitation filter and 605-632 nm emission filter).
To investigate Cx43 immunoreactivity, small pieces of bladder smooth muscle as described above were pinned onto Sylgard and fixed at room temperature in 4 % paraformaldehyde in 0.1 M phosphate buffer for 3-16 h. Samples were then rinsed three times in PBS containing 0.3 % Triton-X 100 for 10 min each time, once for 20 min in DMSO and finally for 10 min in PBS. Samples were removed from the Sylgard and incubated in primary antibody (rabbit anti-Connexin 43, 1:250; Zymed Laboratories Inc., South San Francisco, CA, USA) for 24-48 h. Excess antibody was rinsed from the tissue in three changes of PBS and the tissue further incubated in secondary antibody (goat anti-rabbit IgG conjugated to Alexa fluor 568, 1:500; Molecular Probes, Eugene, OR, USA) for 1-2 h. Excess antibody was rinsed from the tissue in three changes of PBS, prior to mounting in Dako fluorescent mounting medium. Negative controls were processed identically, with the primary antibody being replaced by PBS. Preparations were imaged using a BioRad MRC-1000 confocal microscope, through a × 63, 1.4 NA oil immersion objective. Scans either at a single confocal plane (XY scans), or a series of scans through the depths of the tissue (XYZ scans) were acquired and stored on disc, for later analysis using a personal computer.
Composition of physiological saline was (mM): NaCl, 122; KCl, 4.7; MgCl2, 1.2; CaCl2, 2.5; NaHCO3, 15.5; KH2PO4, 1.2; and glucose, 11.5. The solution was aerated with 95 % O2 and 5 % CO2.
Drugs used were atropine sulphate, caffeine, cyclopiazonic acid (CPA), 18β-glycyrrhetinic acid (18β-GA), nifedipine, tetrodotoxin, ryanodine (all from Sigma, St Louis, MI, USA) and fura-PE3 AM (from Calbiochem, San Diego, CA, USA). Tetrodotoxin and ryanodine were dissolved in distilled water. Nifedipine was dissolved in 100 % ethanol. CPA, fura-PE3 AM and 18β-GA were dissolved in dimethyl sulphoxide (DMSO). The final concentration of these solvents in the physiological saline did not exceed 1:1000. Caffeine was directly dissolved into physiological saline.
Measured values were expressed as means ± standard deviation (s.d.). Statistical significance was tested using Student's t test, and probabilities of less than 5 % were considered significant.
RESULTS
Propagation of spontaneous calcium waves
When changes in the concentration of intracellular calcium ions ([Ca2+]i) were visualized in bladder smooth muscle bundles, increases in [Ca2+]i generally arose from the boundary of muscle bundles and spread to the other boundary (calcium waves). To investigate the propagation of spontaneous increases in [Ca2+]i, changes in [Ca2+]i were recorded from several small areas which were located either along the axis of muscle bundles (axial) or at right angles to the axis of the bundles (transverse). When increases in [Ca2+]i were recorded from three separate areas located axially with a separation between each area of 100-200 μm, calcium signals concurrently occurred in all areas (Fig. 1B and C). Even with a faster time scale, peaks of increases in [Ca2+]i recorded from different areas apparently overlapped and measurable latencies between the peaks could not be detected (Fig. 1D).
Figure 1. Propagation of spontaneous increases in [Ca2+]i in the axial direction of the bladder smooth muscle bundles.
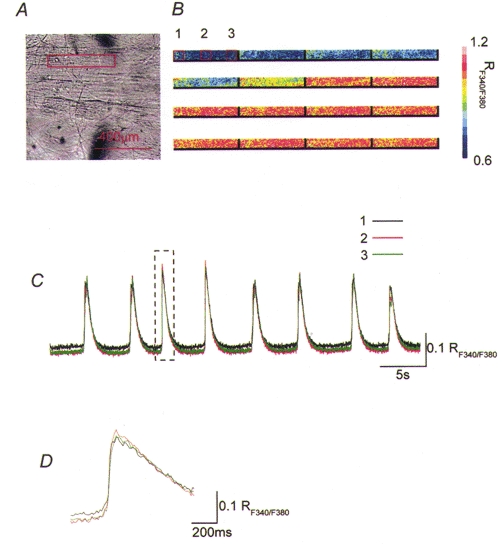
Changes in [Ca2+]i were recorded from an area along the bundle of bladder muscle. A rectangle in the micrograph of the bladder smooth muscle bundle indicates the area where [Ca2+]i recordings were made (A). A series of frames demonstrates that increases in [Ca2+]i concurrently originate along the boundary of the muscle bundle (B). When changes in [Ca2+]i were recorded from three subareas which were located axially by a distance of 100 μm to each other, transient increases in [Ca2+]i occurred in all three areas (C). The onsets and peaks of transient increases in [Ca2+]i occurred almost simultaneously in all three areas (D). A rectangle in C indicates parts of recording traces which are shown in D with a fast time scale.
The propagation of calcium signals in the transverse direction were also investigated. When increases in [Ca2+]i were recorded from three or four separate areas located transversely with a separation between areas of 50-150 μm, calcium signals originated at one boundary and spread to the other boundary (calcium waves, Fig. 2Ba andC). In most preparations studied, the calcium waves were predominantly initiated at one particular boundary. The other boundary was also able to generate calcium waves which propagated in an opposite direction (Fig. 2Bb). Occasionally, both boundaries initiated calcium waves almost simultaneously, thus apparent synchronized increases in [Ca2+]i were observed throughout the muscle bundles. Calcium waves sometimes ceased propagation in the middle of a bundle, thus failing to reach the other boundary. In 20 preparations in which the pattern of the propagation of 200 calcium waves was analysed, about 80 % of calcium waves originated from a dominant boundary (Fig. 2Ba and Fig.2Da), 15 % of waves arose from the non-dominant boundary (Fig. 2Bb and Fig. 2Db) and the remaining 5 % of waves occurred at both boundaries almost simultaneously. When calcium waves originated from either boundary, about 90 % of calcium waves reached the other end and 10 % of waves ceased in the middle of bundles. The conduction velocity of calcium waves was estimated as the distance between the most separated areas divided by the delay between the peaks of calcium transients in both areas. The peaks of each calcium transient were chosen as measuring points because they were most easily identified. The conduction velocity of calcium waves in the transverse direction ranged between 0.5 and 6.8 mm s−1 (mean 2.0 ± 1.6 mm s−1, n = 15, 107 calcium waves).
Figure 2. Propagation of spontaneous increases in [Ca2+]i in the transverse direction of the bladder smooth muscle bundles.
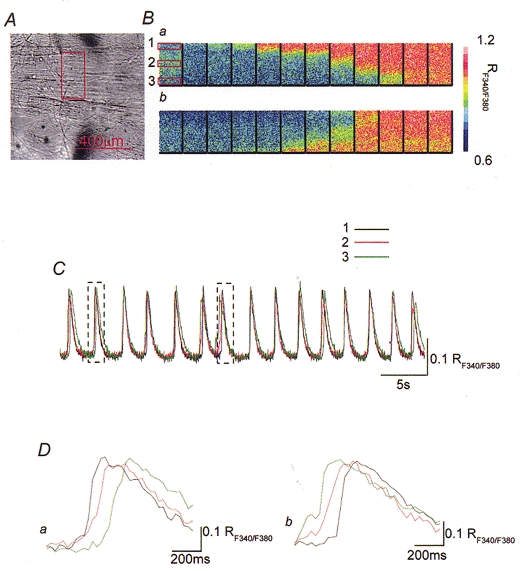
Changes in [Ca2+]i were simultaneously recorded from areas located at a right angle to the edge of a muscle bundle. A rectangle in the micrograph of the bladder smooth muscle bundle indicates the area where [Ca2+]i recordings were made (A). A series of frames demonstrates that increases in [Ca2+]i originate from the upper boundary of the muscle bundles and spread to the lower boundary (Ba). The lower series of frames demonstrates that increases in [Ca2+]i arose from the lower boundary of the muscle bundles and spread to the upper boundary (Bb). When changes in [Ca2+]i were simultaneously recorded from three different subareas which were located transversely by a distance of 100 μm from each other, transient increases in [Ca2+]i occurred nearly synchronously in all three areas (C). Transient increases in [Ca2+]i recorded from three rectangle areas had almost identical rising phases but a delay of some 200 ms was observed between the onsets of increases in [Ca2+]i in both boundaries (Da andb). Two rectangles in C indicate parts of recording traces which are shown in D.
Spontaneous action potentials and transient increases in [Ca2+]i
To investigate the cause of the transient increases in [Ca2+]i, smooth muscle cells located in the boundary which most frequently initiated the calcium waves were impaled with intracellular recording electrodes and membrane potential recordings were made simultaneously with the measurements of [Ca2+]i. In all 38 preparations examined, spontaneous action potentials and transient increases in [Ca2+]i occurred synchronously (Fig. 3A and B). Spontaneous action potentials invariably preceded the increases in [Ca2+]i, suggesting that action potentials triggered these increases (Fig. 3C). The delay between the peak of action potentials and the peak of increases in [Ca2+]i ranged between 15 and 158 ms (Fig. 3C, mean 76.7 ± 35.2 ms, n = 38, 114 pairs of events). Neither spontaneous action potentials nor increases in [Ca2+]i were inhibited by either atropine (1 μM, n = 3) or tetrodotoxin (1 μM, n = 3), suggesting neural activity did not contribute to the generation of either event.
Figure 3. Spontaneous action potentials and transient increases in [Ca2+]i in the guinea-pig urinary bladder.
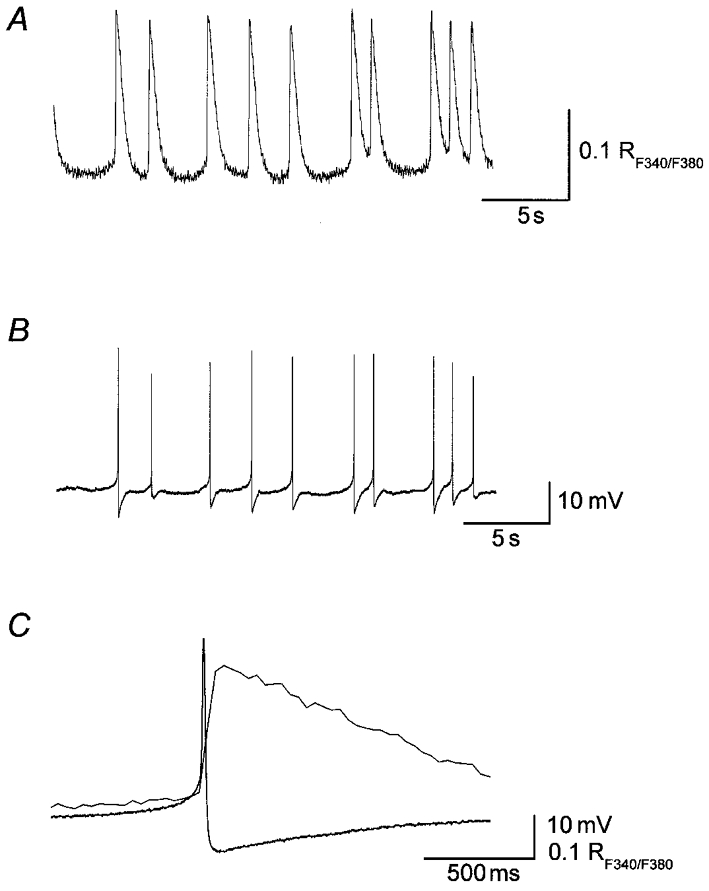
Membrane potential recordings (A) were made simultaneously with measurements of [Ca2+]i (B) from a smooth muscle bundle of the guinea-pig urinary bladder. Spontaneous action potentials and increases in [Ca2+]i occurred synchronously. Spontaneous action potentials preceded the transient increases in [Ca2+]i (C). Each action potential consisted of an initial slow depolarizing phase which was followed by a rapid repolarizing phase with an after-hyperpolarization (lower trace). Spontaneous increases in [Ca2+]i had fast rising phases and relatively slow falling phases (upper trace). Scale bars on the right refer to each trace. Resting membrane potential was -37 mV.
Spontaneous action potentials were discharged with frequencies ranging between 11 and 34 min−1 (mean 21.1 ± 6.4 min−1, n = 26). They had peak amplitudes between 40.7 and 59.6 mV (mean 52.1 ± 4.8 mV), rise times between 35.7 and 92.4 ms (mean 55.7 ± 15.4 ms) and half-widths between 8.3 and 10.5 ms (mean 9.1 ± 0.7 ms). Action potentials were followed by after-hyperpolarizations whose amplitudes ranged between 5.6 and 16.7 mV (mean 9.5 ± 3.8 mV). Resting membrane potentials, determined as the stable most negative potential between action potentials lay in the range of -31 to -53 mV (mean -43.2 ± 5.2 mV). These values were very similar to those observed in unloaded preparations (Hashitani et al. 2000). Spontaneous increases in [Ca2+]i occurred with the same frequency as spontaneous action potentials and had peak amplitudes between 0.15 and 0.32 RF340/F380 (mean 0.23 ± 0.06 RF340/F380, n = 11, 150 calcium signals), rise times between 79 and 173 ms (mean 123 ± 34 ms) and half-widths between 348 and 852 ms (mean 494 ± 136 ms).
Propagation of spontaneous action potentials
Since spontaneous action potentials were found to trigger spontaneous transient increases in [Ca2+]i, the propagation of spontaneous action potentials in 30 preparations was investigated by impaling bundles of bladder smooth muscle with two independent microelectrodes. When the electrodes were placed between 150 and 900 μm apart axially, action potentials were usually detected with small differences in their time of detection (Fig. 4A). Occasionally, action potentials recorded from both electrodes occurred concurrently, and thus measurable delay between the peaks of action potentials could not be detected. When slight asynchrony was detected, neither electrode consistently detected the first action potential. These observations suggested that there were multiple pace-making sites along the boundaries of muscle bundles. Hyperpolarizing currents injected into one electrode invariably caused a hyperpolarization which was detected at the second electrode (Fig. 4C). The conduction velocities of spontaneous action potentials were estimated by dividing the distance between the two electrodes by the delay between the peaks of paired action potentials (Fig. 4B). In the axial direction, conduction velocities ranged between 27 and 67 mm s−1 (mean 40.7 ± 13.9 mm s−1, n = 15, 1331 pairs of action potentials).
Figure 4. Propagation of spontaneous action potentials in the bladder smooth muscle bundles.
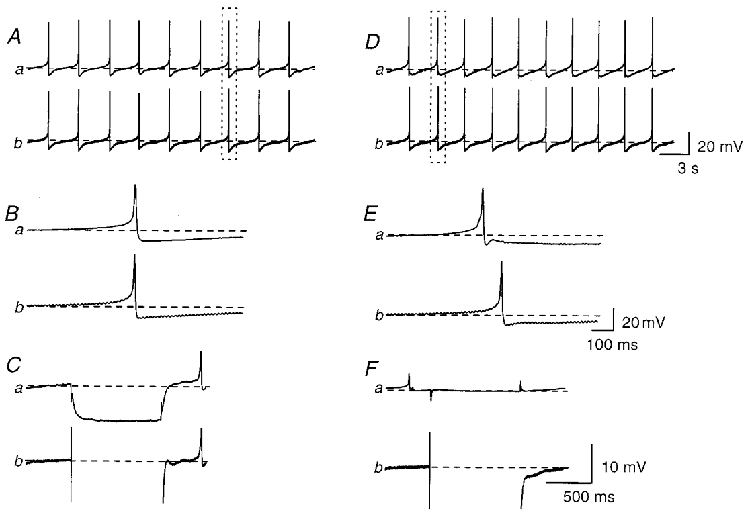
In a bundle of bladder smooth muscle, membrane potential changes were simultaneously recorded with two independent microelectrodes which were placed 400 μm apart axially. Synchronized spontaneous action potentials were recorded from both electrodes (Aa andb). Each pair of action potentials occurred almost simultaneously (Ba and b). Hyperpolarizing currents with an amplitude of 0.5 nA, injected into the first electrode (Cb), caused hyperpolarizations which were detected at the second electrode (Ca). In a separate smooth muscle bundle, membrane potential changes were simultaneously recorded with two independent microelectrodes which were placed 100 μm apart transversely. Synchronized spontaneous action potentials were recorded from both electrodes (Da andb). In each pair of action potentials, some 100 ms delay could be observed between the peaks of the preceded- and follower-action potentials (Ea andb). Hyperpolarizing currents with amplitudes of 0.5 nA, injected into the first electrode (Fb), did not trigger a detectable membrane potential change at the second electrode (Fa). The rectangles in A and D indicate pairs of action potentials which are shown in B and E, respectively. Resting membrane potentials were -42 mV in A-C and -40 mV in D-F. Scale bar on the right of each set of traces refers to all traces in each set.
When electrodes were placed between 100 and 500 μm apart transversely, action potentials were recorded from both electrodes (Fig. 4D). However, an obvious delay between the peaks of the paired action potentials could invariably be detected (Fig. 4E). As was the case for propagating calcium waves, action potentials recorded from one electrode usually, but not always, preceded those recorded from the other electrode. On a small proportion of occasions action potentials recorded from the two electrodes occurred almost simultaneously, suggesting that both boundaries are capable of generating action potentials which propagate to the other boundaries. Hyperpolarizing currents injected into the first electrode failed to produce a detectable hyperpolarization at the second electrode (Fig. 4F). In the transverse direction, the estimated conduction velocities of spontaneous action potentials ranged between 0.7 and 3.1 mm s−1 (mean 1.34 ± 1.03 mm s−1, n = 15, 1285 pairs of action potentials); these values were consistent with those of calcium waves, suggesting that calcium waves resulted from propagating action potentials.
Passive properties of bladder smooth muscle cells
In 10 preparations, both hyperpolarizing and depolarizing currents were injected through an electrode and the resultant voltage changes were recorded from the same electrode. Hyperpolarizing currents with amplitudes of -0.1 to -0.5 nA injected into cells caused hyperpolarizations of the membrane with an amplitude of between 5 and 50 mV and prevented the generation of spontaneous action potentials. Depolarizing currents with amplitudes of 0.1 or 0.2 nA caused depolarizations and triggered the discharge of several action potentials. Action potentials were abolished by nifedipine (10 μM), after which depolarizing currents of 0.1 or 0.2 nA were seen to cause membrane depolarizations with amplitudes between 5 and 20 mV. Over the range of membrane potentials examined, the relationships between the amplitude of injected currents and the amplitude of the resultant membrane potential changes (I-V relationship) were found to be linear. The input resistance of bladder smooth muscle preparations, calculated from the slope of the I-V relationship, ranged between 60 and 110 MΩ (mean 78.5 ± 31.8 MΩ, n = 19). The time constants of decay of electrotonic potentials ranged between 20 and 120 ms (mean 56.1 ± 25.8 ms, n = 19).
To investigate the electrical coupling between smooth muscle cells, preparations where the spontaneous discharge of action potentials had been abolished by nifedipine (10 μM), were impaled with two independent electrodes. One electrode was used to pass current and the resultant electrotonic potentials were recorded from the second electrode. When the two electrodes were placed axially, hyperpolarizing currents with amplitudes of 0.5-2 nA injected into cells invariably resulted in electrotonic potentials being recorded from the second cell. The amplitude of electrotonic potentials tended to become smaller as a function of the distance from the first electrode (Fig. 5A). The amplitude of electrotonic potentials had a large variation, even when the recording electrode was impaled into nearby cells located at the same distance from the current-injecting electrode. Therefore, three to five cells were impaled at each distance and the largest amplitude of electrotonic potentials was chosen for the analysis of the length constant. The relationship between the amplitude of the electrotonic potential and the distance between the two electrodes is summarized in Fig. 5B.. The relationship between amplitude and distance could be approximately described by a single exponential. The amplitude of electrotonic potentials fell to 1/e, i.e. 37%, in the axial direction at distances between 325 and 575 μm (mean 425.5 ± 75.5 μm, n = 10).
Figure 5. Electrical coupling between smooth muscle cells in the bladder.
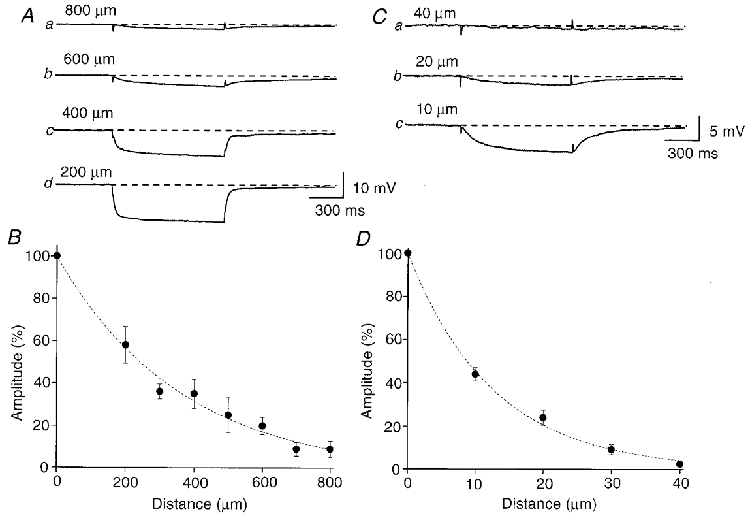
Two independent microelectrodes were placed axially at measured separations. Hyperpolarizing currents, with amplitudes of 0.5 nA, were injected into the first electrode and the resultant hyperpolarizations recorded at the second electrode (A). The amplitudes of the electrotonic potentials became smaller as a function of the distance (A). The relationship between the amplitude of electrotonic potentials and the distance between two electrodes is summarized in B. In a separate smooth muscle bundle, two independent microelectrodes were placed transversely at known separations. Hyperpolarizing currents with amplitudes of 0.5 nA, resulted in hyperpolarizations which were detected at the second electrode (C). The amplitudes of the electrotonic potentials again became smaller as a function of the distance (C). The relationship between the amplitude of electrotonic potentials and the distance between two electrodes are summarized in D. Each trace represents the mean of 5-12 recordings. The dashed lines indicate single exponential fitting curves. All recordings were made in the presence of nifedipine (10 μM). Scale bar on the right of Ad refers to all traces inA. Scale bar on the right of Cc refers to all traces inC.
When two electrodes were located with transverse separations greater than 50 μm, electrotonic potentials could not be detected. When the distance between the two electrodes was less than 50 μm, current injected at one electrode allowed an electrotonic potential to be detected at the second electrode. Again the amplitude of the electrotonic potential fell as a function of the distance from the current electrode (Fig. 5C). The relationship between the amplitude of electrotonic potential and the distance is summarized in Fig. 5D.. The amplitude of electrotonic potentials fell to 1/e in the axial direction at distances between 5 and 25 μm (mean 12.5 ± 5.2 μm, n = 10).
In the same series of experiments, the effect of 18β-glycyrrhetinic acid (18β-GA), a gap-junction uncoupler (Yamamoto et al. 1998), on the amplitude of electrotonic potentials was also examined. In all six preparations examined, two electrodes were placed between 150-250 μm apart axially. In three preparations, 18β-GA (40 μM) abolished the electrotonic potentials detected at the second electrode (Fig. 6A). In the remaining three preparations, 18β-GA reduced the amplitudes of electrotonic potentials to some 25 % of the control values. 18β-GA (40 μM) also depolarized the membrane (10.3 ± 3.2 mV, n = 6). On two occasions from two preparations where the two electrodes might have impaled the same cell, 18β-GA increased the amplitude of membrane potential changes recorded from both electrodes (Fig. 6B).
Figure 6. Effects of 18β-GA on electrical coupling between bladder smooth muscle cells.
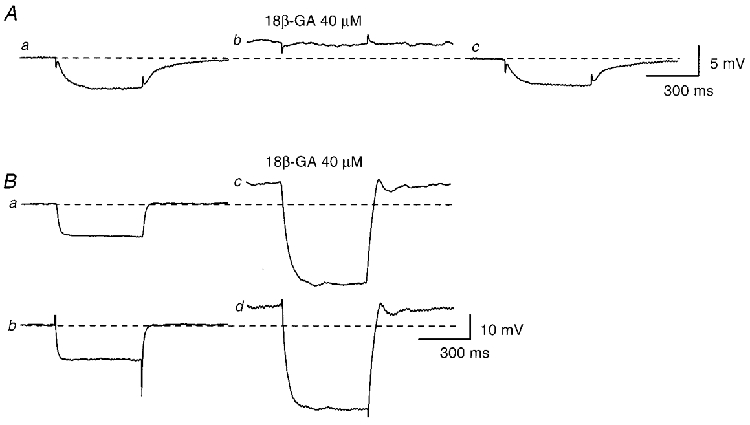
In the presence of nifedipine (10 μM), two independent electrodes were placed axially with a measured separation. Hyperpolarizing currents, with amplitudes of 0.5 nA, caused a hyperpolarization detected at the second electrode (Aa). 18β-GA (40 μM) depolarized the membrane and abolished the electrotonic potential (Ab). After washing out 18β-GA, the membrane potential recovered to the original level and the electrotonic potential was restored (Ac). In a separate preparation, almost identical membrane potential changes were recorded from both electrodes (Ba andb). 18β-GA (40 μM) depolarized the membrane and increased the amplitude of membrane potential changes in both cells (Bc andd). Each trace represents the mean of 8-10 recordings. Scale bar on the right of Ac refers to all traces in A. Scale bar on the right of Bd refers to all traces in B.
Since 18β-GA caused considerable depolarizations, the effect of the depolarization on electrotonic potentials was examined. High potassium-containing solution ([K+]o= 30 mM) depolarized the membrane by about 15 mV (mean 15.5 ± 2.1 mV, n = 4) and reduced the amplitude of electrotonic potential to 72.9 ± 5.1 % of the control values.
Role of intracellular calcium stores in propagation of spontaneous excitation
It has been reported that spontaneous action potentials in the bladder are abolished by nifedipine but not by co-application of caffeine and ryanodine (Hashitani et al. 2000). Therefore spontaneous action potentials in the bladder result from the activation of L-type Ca2+ channels and also intracellular Ca2+ stores may not contribute to the generation of spontaneous action potentials. To examine the contribution of Ca2+ release to the initiation and propagation of spontaneous calcium waves in bladder, the effect of caffeine (10 mM), ryanodine (50 μM) and CPA (10 μM) was examined. Caffeine increased the frequency of spontaneous calcium waves and reduced their amplitudes (Fig. 7A). Caffeine also transiently increased the resting level of [Ca2+]i which returned to the original level over some 5 min. After 10 min application of caffeine, the amplitude of spontaneous increases in [Ca2+]i was reduced to 58.1 ± 6.9 % of the control value (n = 3, 80 calcium transients). Ryanodine (50 μM) gradually increased the resting level of [Ca2+]i and increased the frequency of spontaneous calcium waves (Fig. 7B a). After prolonged application (30 min) of ryanodine, the amplitude of the spontaneous calcium waves was reduced to 58.3 ± 12.7 % of the control value (Fig. 7B b; n = 3, 90 calcium transients). As has been reported previously (Hashitani et al. 2000), both caffeine and ryanodine abolished after-hyperpolarizations but did not prevent the generation of spontaneous action potentials. CPA increased the resting level of [Ca2+]i and increased the frequency of spontaneous increases in [Ca2+]i to 180.5 ± 24 % of the control value (Fig. 7C a). After 20 min application of CPA, both the resting level of [Ca2+]i and the frequency of spontaneous increases in [Ca2+]i returned to the original level and the amplitude of spontaneous increases in [Ca2+]i was reduced to 62.2 ± 19.6 % of the control value (Fig. 7C b, n = 3, 90 calcium transients). CPA depolarized the membrane (4.9 ± 1.9 mV) and increased the frequency of spontaneous action potentials. After prolonged application of CPA (some 15-20 min), CPA reduced the amplitude of spontaneous action potentials (73.7 ± 4.5 % of control) and abolished after-hyperpolarizations.
Figure 7. Effect of caffeine, ryanodine and CPA on spontaneous increase in [Ca2+]i in the guinea-pig urinary bladder.
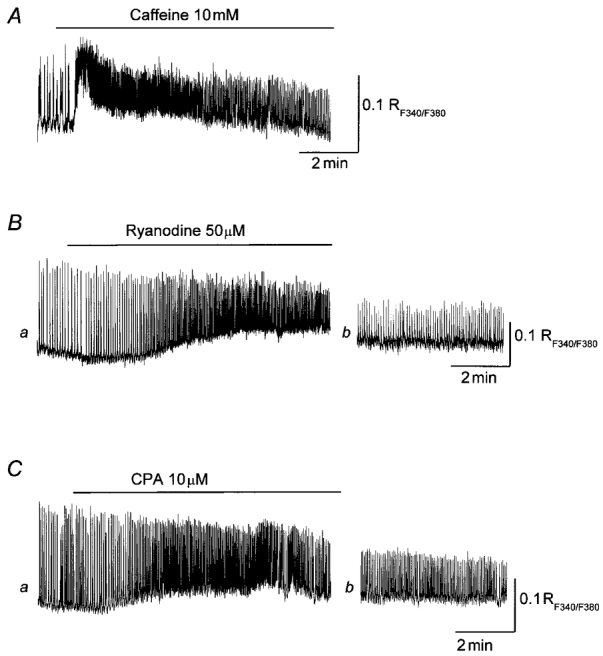
In control solution, bladder smooth muscle cells generated spontaneous increases in [Ca2+]i. Application of caffeine (10 mM) increased the resting level of [Ca2+]i and increased the frequency of spontaneous Ca2+ transients (A). After 10 min application of caffeine, the amplitude of the spontaneous increases in [Ca2+]i was reduced to about 60 % of control values (A). Ryanodine (50 μM) increased the resting level of [Ca2+]i and increased the frequency of spontaneous Ca2+ transients (Ba). After 30 min application of ryanodine, the amplitude of spontaneous increase in [Ca2+]i was reduced to about 50 % of control values (Bb). CPA (10 μM) increased the resting level of [Ca2+]i and increased the frequency of spontaneous Ca2+ transients (Ca). After 20 min application of CPA, the amplitude of the spontaneous increase in [Ca2+]i was reduced to about 50 % of control values (Cb). The scale bar to the right of each trace refers to that trace.
Morphological communication between bladder smooth muscle cells
To investigate further how bladder smooth muscle cells communicate with each other, cells were impaled with microelectrodes containing neurobiotin. In all 38 cells examined in 17 different preparations, impaled cells exhibited spontaneous action potentials (Fig. 8Aa), and thus were identified as smooth muscle cells. Subsequently cells were filled with neurobiotin by passing depolarizing currents (0.1 nA, duration 1 s, delivered five times) over a period of 3 min. Tissues were fixed, labelled with streptavidin-CY3 and viewed with a confocal microscope. In all 17 preparations examined, impaled cells and three to five neighbouring cells located axially could be visualized (Fig. 8Ab). Neighbouring cells located in the transverse direction were visualized on only 5 out of 17 occasions. The groups of cells had total lengths which ranged between 500 and 1400 μm (mean 872 ± 516 μm, n = 17) and their widths ranged between 5 and 25 μm (mean 12.7 ± 4.1 μm, n = 17). To study the contribution of gap junctions to the passage of dye between cells, the effect of 18β-GA (40 μM) on the spread of neurobiotin was examined. In preparations which had been exposed to 18β-GA (40 μM) for 10 min, smooth muscle cells which exhibited spontaneous action potentials (Fig. 8B a) were filled with neurobiotin by the same procedure used in control preparations In 13 cells from five preparations, impaled cells were invariably visualized but neighbouring cells were difficult to visualize (Fig. 8B b). Visualized groups of cells ranged in length between 200 and 800 μm (mean 317 ± 143 μm, n = 13) and in width between 4 and 12 μm (mean 7.4 ± 1.5 μm, n = 17). The values were significantly smaller than those of control preparations (P < 0.05). Thus cells which are presumably single smooth muscle cells had lengths of some 300 μm and maximum widths of 10 μm, indicating that in control preparations neurobiotin was in fact spreading to neighbouring cells, presumably through gap junctions.
Figure 8. Morphological properties of the communication between smooth muscle cells of the bladder.
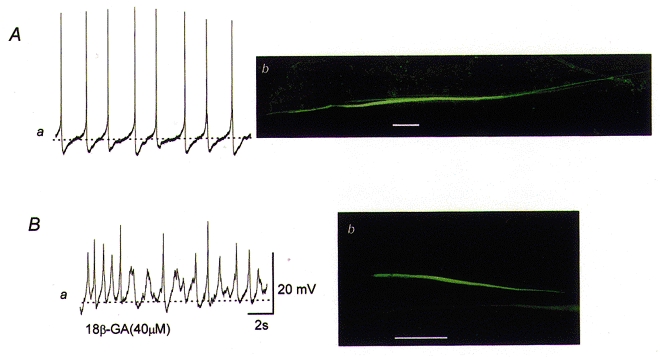
The upper membrane potential recording of spontaneous action potentials was obtained using a microelectrode filled with neurobiotin (Aa). The preparation was viewed using a confocal microscope and it was found that neurobiotin readily spread to neighbouring cells located in the axial direction but not to those located in a transverse direction (Ab). The lower membrane potential recording of spontaneous action potentials was obtained from cells which had been exposed to 18β-GA (40 μM) using a microelectrode filled with neurobiotin (Ba). The preparation was again viewed using a confocal microscope and it was found that spread of neurobiotin to neighbouring cells was inhibited by 18β-GA (Bb). The scale bar located to the right of Ba refers to both membrane potential recordings. The calibration bars on Ab andBb represent 100 μm.
To confirm that gap junctions were indeed present, immunohistochemistry for Cx43 was performed on 25 samples from five animals. Single XY optical sections, or projections through XYZ stacks of optical sections, showed that the membranes of smooth muscle cells were surrounded by even, punctate Cx43 staining (Fig. 9). Although confocal microscopy of immunofluorescence preparations indicated abundant gap junctions, they were rarely observed in single sections viewed using a transmission electron microscope.
Figure 9. Distribution of Connexin 43 immunoreactive gap junctions in the bladder smooth muscle of the guinea-pig.
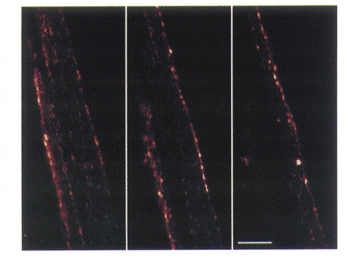
Three consecutive optical sections, each 1.05 μm in thickness, of a small smooth muscle bundle of the guinea-pig bladder. Immunoreactivity of Connexin 43 is revealed as punctate fluorescence on the muscle cell membranes. The calibration bar indicates 10 μm.
DISCUSSION
In the present study, intracellular recordings and measurements of [Ca2+]i were carried out to investigate the origin and propagation of the spontaneous excitation in bladder smooth muscle. Spontaneous action potentials triggered transient increases in [Ca2+]i which were abolished by nifedipine and were inhibited by caffeine, ryanodine or CPA. Spontaneous increases in [Ca2+]i originated almost simultaneously along the boundary of a smooth muscle bundle and then propagated to the other boundary. Electrical and morphological studies indicated that cells communicated more readily with neighbouring cells located axially than with those located transversely.
In bladder smooth muscle bundles, spontaneous calcium waves generally originated from the boundary of the muscle bundles rather than from random locations in the centre of the bundles. In the bladder of both guinea-pig and human, cyclic GMP immunoreactive cells, which resemble ICC in the gastrointestinal tract, have been identified (Smet et al. 1996), therefore the ICC-like cells could be expected to be pace-making cells. However, unlike ICC in the guinea-pig stomach (Dickens, 1999), the cells located in the boundary had similar morphology and action potentials to those observed in cells located in the middle of a bundle. In the axial direction, increases in [Ca2+]i occurred almost simultaneously throughout the muscle bundles probably due to the rapid propagation of spontaneous action potentials. By contrast, spontaneous calcium waves gradually spread to the other boundary across the muscle bundles. Since the conduction velocity of calcium waves in the transverse direction was very similar to that of spontaneous action potentials, calcium waves presumably result from the propagation of action potentials. This idea was also supported by the similarity between the pharmacological properties of calcium waves and those of spontaneous action potentials. As fura-PE3-loaded and -unloaded preparations had similar membrane potentials and displayed similar patterns of spontaneous activity properties, visualization of changes in [Ca2+]i might be useful for investigating the etiology of unstable bladders.
When the electrical properties of bundles of bladder smooth muscle were investigated, a current injected at one electrode consistently produced an electrotonic potential at even a distantly positioned axial electrode. In contrast, electrotonic potentials were only detected in transversely positioned electrodes if the separation between the electrodes was less than 50 μm. Very similar quantitative observations were made on the longitudinal layer of guinea-pig ileum, where currents spread more easily in a longitudinal direction than in a transverse direction (Cousins et al. 1993). The observation is also in agreement with a previous report that showed that electrotonic potentials were recorded from only a small proportion of cells located axially in the guinea-pig bladder (Bramich & Brading, 1996). The decay of potential, produced by point-current injection into a bundle, was more rapid than had been indicated when electrical length constants were determined in larger preparations of bladder smooth muscle using uniform polarization methods (Seki et al. 1992). This discrepancy may well simply result from a difference in experimental protocols: current flow from a point-current source is described by a 2-dimensional cable theory (Cousins et al. 1993) whereas that determined by uniform polarization is described by a 1-dimensional cable theory (Abe & Tomita, 1968). Alternatively, it is possible that the electrical properties of the small preparations used here have been changed because the preparations were stretched. In the present study the preparations were stretched in both axial and transverse direction to minimize movement and allow stable intracellular recordings. In gastric smooth muscle, it has been reported that the conduction velocity of slow waves is a function of the degree of stretch: moderate stretch of preparations increases communications between cells; however, excessive stretch inhibits or sometimes eliminates the communication (Publicover & Sanders, 1985). In comparison to other smooth muscles, communications between bladder cells appear to be poor. Thus when the spread of neurobiotin was examined in bladder smooth muscle preparations, neurobiotin was only visualized in four or five cells located axially. In contrast, in the gastrointestinal smooth muscle, neurobiotin injected into a cell spread extensively to many neighbouring cells such that cells could not be visualized without applying gap-junction blockers (Farraway et al. 1995; Dickens et al. 1999).
In gastric smooth muscle, conduction velocities of both slow waves and spontaneous calcium waves have been determined using multi-intracellular electrode techniques and visualization of fluorescence signals, respectively. The conduction velocity of slow waves was found to be some 20-45 mm s−1 in the axial direction and 6-10 mm s−1 in the transverse direction (Bauer et al. 1985). Similar ranges of values were obtained for the conduction velocity of calcium waves (Stevens et al. 1999). Although bladder smooth muscle preparations had similar conduction velocities in the axial direction (40 mm s−1) to that of gastric smooth muscle, the transverse conduction velocity of bladder smooth muscle (1-2 mm s−1) was less than that of gastric smooth muscle. These results, together with the way in which muscle bundles frequently branch and reunite with each other to form an interlacing network rather than a simple muscle sheet, suggest that the propagation of excitation over large areas would be expected to be more limited than in gastrointestinal smooth muscles. In the myenteric region of the gastrointestinal tract, networks of ICC have been identified. These cells not only pace the bulk of smooth muscle cells but also contribute to the propagation of excitation throughout the tissues so that gastrointestinal tissues generate co-ordinated phasic contractions (Sanders, 1996; Dickens et al. 1999); thus the lack of such a functional network may also be responsible for the relatively poor co-ordination of contractions in the bladder.
Regardless of the relative electrical coupling, particularly in the transverse direction, spontaneous action potentials occurred throughout each bundle. This is probably due to the regenerative nature of action potentials. If one considers the length of single smooth muscle cells and the electrical behaviour of the preparations (see Fig. 5), the amplitude of a voltage change in one cell might be reduced to about 60 % in an adjacent cell. Since bladder smooth muscle cells have a depolarized membrane potential, which is very close to the threshold for the activation of L-type calcium channels, even a small depolarization would be sufficient to trigger regenerative action potentials in the nearby cell. Thus even though there appears to be little passive spread of current to neighbouring cells, action potentials will readily propagate with no net reduction of the amplitude.
In many other smooth muscles, the release of calcium from intracellular calcium stores contributes to spontaneous activity ( Van Helden, 1993; Hashitani et al. 1996; Bramich, 2000). In the bladder smooth muscle, both spontaneous action potentials and contractions were reported to be abolished by nifedipine (Mostwin, 1986). It has also been reported that neither co-application of caffeine and ryanodine nor BAPTA prevented the generation of spontaneous action potentials (Hashitani et al. 2000). However, in isolated bladder smooth muscle cells, depolarization-induced increases in [Ca2+]i have been reported to result from calcium release from intracellular calcium stores, i.e. calcium sparks (Imaizumi et al. 1998). Moreover, it was demonstrated that both calcium influx and calcium release from intracellular stores contributed to neurally activated increases in [Ca2+]i and associated contractions in the bladder (Hashitani et al. 2000). In the present studies, caffeine, ryanodine and CPA reduced the amplitude of spontaneous increases in [Ca2+]i without preventing the generation of action potentials. Therefore, in the bladder the increase in [Ca2+]i associated with a spontaneous action potential is amplified by the release of Ca2+ from intracellular stores but the release from internal stores does not contribute to the generation of activity itself.
18β-GA either abolished or reduced the amplitude of electrotonic potentials to some 20 % of the control values. Since 18β-GA caused substantial depolarizations, one might expect that the depolarization itself could influence electrotonic potentials. In a high potassium-containing solution, the amplitude of electrotonic potentials was reduced to some 70 % of the control value, thus the depolarization indeed did reduce the amplitude of electrotonic potentials. In a high potassium-containing solution, the time constants of the membrane were also reduced, suggesting that the increased membrane conductance, probably due to the opening of some voltage-dependent ion channels, accounts for the reduction in the amplitude of electrotonic potentials. Although the depolarization itself reduced the amplitude of electrotonic potentials, its effect was much smaller than that of 18β-GA. Thus, in the guinea-pig bladder, the effect of 18β-GA mainly resulted from its effect as a gap-junction uncoupler.
Connexin 43 immunoreactivity showed membrane localization of Connexin 43 which appeared as a series of spots around smooth muscle cells of the guinea-pig bladder. Furthermore, both electrical and morphological communications between cells were inhibited by 18β-GA. These results suggest that waves of spontaneous excitation in bladder smooth muscle propagate through gap junctions consisting of Connexin 43 proteins. It has been reported that not only electrical signals but also Ca2+ and perhaps InsP3 can spread to neighbouring cells through gap junctions (Christ et al. 1992). Therefore, the propagation of spontaneous calcium waves in bladder could be carried either by action potentials or by Ca2+ itself, i.e. calcium-induced calcium release (CICR). However, caffeine, ryanodine and CPA failed to prevent the propagation of calcium waves in the bladder, thus it is unlikely that calcium waves are carried by CICR. Since the conductance of gap-junction channels has been reported to be modulated by second messengers such as Ca2+ and protein kinases (Dhein, 1998), an increased coupling between cells could occur as a consequence of the altered function of either intracellular calcium stores or excitatory nerves as has been shown in obstructed bladders (Turner & Brading, 1997).
In conclusion, spontaneous activity in bundles of bladder smooth muscle originates from the boundary of those muscle bundles. Calcium influx during spontaneous action potentials rather than Ca2+ release from intracellular stores mainly contributes to both initiation and propagation of spontaneous increases in [Ca2+]i. Spontaneous excitation rapidly spreads to neighbouring cells located in the axial direction and less effectively to cells located in the transverse direction. The relatively poor coupling between cells, particularly in the transverse direction, may account for the high compliance of the bladder.
Acknowledgments
The authors wish to thank Professor G. D. S. Hirst for his critical reading of the manuscript. The authors are also grateful to Dr F. R. Edwards for his helpful comments on the manuscript.
References
- Abe Y, Tomita T. Cable properties of smooth muscle. The Journal of Physiology. 1968;196:87–100. doi: 10.1113/jphysiol.1968.sp008496. [DOI] [PMC free article] [PubMed] [Google Scholar]
- Bauer AJ, Publicover NG, Sanders KM. Origin and spread of slow waves in canine gastric antral circular muscle. American Journal of Physiology. 1985;249:G800–806. doi: 10.1152/ajpgi.1985.249.6.G800. [DOI] [PubMed] [Google Scholar]
- Brading AF. A myogenic basis for the overactive bladder. Urology. 1997;50:57–67. doi: 10.1016/s0090-4295(97)00591-8. [DOI] [PubMed] [Google Scholar]
- Bramich NJ. Electrical behavior of guinea pig tracheal smooth muscle. American Journal of Physiology. 2000;278:L320–328. doi: 10.1152/ajplung.2000.278.2.L320. [DOI] [PubMed] [Google Scholar]
- Bramich NJ, Brading AF. Electrical properties of smooth muscle in the guinea-pig urinary bladder. The Journal of Physiology. 1996;492:185–198. doi: 10.1113/jphysiol.1996.sp021300. [DOI] [PMC free article] [PubMed] [Google Scholar]
- Christ GJ, Moreno AP, Melman A, Spray DC. Gap junction-mediated intercellular diffusion of Ca2+ in cultured human corporal smooth muscle cells. American Journal of Physiology. 1992;263:C373–383. doi: 10.1152/ajpcell.1992.263.2.C373. [DOI] [PubMed] [Google Scholar]
- Cousins HM, Edwards FR, Hirst GDS, Wendt IR. Cholinergic neuromuscular transmission in the longitudinal muscle of the guinea-pig ileum. The Journal of Physiology. 1993;471:61–86. doi: 10.1113/jphysiol.1993.sp019891. [DOI] [PMC free article] [PubMed] [Google Scholar]
- Dhein S. Gap junction channels in the cardiovascular system: pharmacological and physiological modulation. Trends in Pharmacological Sciences. 1998;19:229–241. doi: 10.1016/s0165-6147(98)01192-4. [DOI] [PubMed] [Google Scholar]
- Dickens EJ, Hirst GDS, Tomita T. Identification of rhythmically active cells in guinea-pig stomach. The Journal of Physiology. 1999;514:515–531. doi: 10.1111/j.1469-7793.1999.515ae.x. [DOI] [PMC free article] [PubMed] [Google Scholar]
- Farraway L, Ball AK, Huizinga JD. Intercellular metabolic coupling in canine colon musculature. American Journal of Physiology. 1995;268:C1492–1502. doi: 10.1152/ajpcell.1995.268.6.C1492. [DOI] [PubMed] [Google Scholar]
- Hashitani H, Bramich NJ, Hirst GDS. Mechanisms of excitatory neuromuscular transmission in the guinea-pig urinary bladder. The Journal of Physiology. 2000;524:565–579. doi: 10.1111/j.1469-7793.2000.t01-2-00565.x. [DOI] [PMC free article] [PubMed] [Google Scholar]
- Hashitani H, Van Helden DF, Suzuki H. Properties of spontaneous depolarizations in circular smooth muscle cells of rabbit urethra. British Journal of Pharmacology. 1996;118:1627–1632. doi: 10.1111/j.1476-5381.1996.tb15584.x. [DOI] [PMC free article] [PubMed] [Google Scholar]
- Imaizumi Y, Torii Y, Ohi Y, Nagano N, Atsuki K, Yamamura H, Muraki K, Watanabe M, Bolton TB. Ca2+ images and K+ current during depolarization in smooth muscle cells of the guinea-pig vas deferens and urinary bladder. The Journal of Physiology. 1998;510:705–719. doi: 10.1111/j.1469-7793.1998.705bj.x. [DOI] [PMC free article] [PubMed] [Google Scholar]
- Montgomery BS, Fry CH. The action potential and net membrane currents in isolated human detrusor smooth muscle cells. Journal of Urology. 1992;147:176–184. doi: 10.1016/s0022-5347(17)37192-6. [DOI] [PubMed] [Google Scholar]
- Mostwin JL. The action potential of guinea pig bladder smooth muscle. Journal of Urology. 1986;135:1299–1303. doi: 10.1016/s0022-5347(17)46079-4. [DOI] [PubMed] [Google Scholar]
- Publicover NG, Sanders KM. Myogenic regulation of propagation in gastric smooth muscle. American Journal of Physiology. 1985;248:G512–520. doi: 10.1152/ajpgi.1985.248.5.G512. [DOI] [PubMed] [Google Scholar]
- Sanders KM. A case for interstitial cells of Cajal as pacemakers and mediators of neurotransmission in the gastrointestinal tract. Gastroenterology. 1996;111:492–515. doi: 10.1053/gast.1996.v111.pm8690216. [DOI] [PubMed] [Google Scholar]
- Seki N, Karim OM, Mostwin JL. Changes in electrical properties of guinea pig smooth muscle membrane by experimental bladder outflow obstruction. American Journal of Physiology. 1992;262:F885–891. doi: 10.1152/ajprenal.1992.262.5.F885. [DOI] [PubMed] [Google Scholar]
- Smet PJ, Jonavicius J, Marshall VR, De Vente J. Distribution of nitric oxide synthase-immunoreactive nerves and identification of the cellular targets of nitric oxide in guinea-pig and human urinary bladder by cGMP immunohistochemistry. Neuroscience. 1996;71:337–348. doi: 10.1016/0306-4522(95)00453-x. [DOI] [PubMed] [Google Scholar]
- Stevens RJ, Weinert JS, Publicover NG. Visualization of origins and propagation of excitation in canine gastric smooth muscle. American Journal of Physiology. 1999;277:C448–460. doi: 10.1152/ajpcell.1999.277.3.C448. [DOI] [PubMed] [Google Scholar]
- Turner WH, Brading AF. Smooth muscle of the bladder in the normal and the diseased state: pathophysiology, diagnosis and treatment. Pharmacology and Therapeutics. 1997;75:77–110. doi: 10.1016/s0163-7258(97)00038-7. [DOI] [PubMed] [Google Scholar]
- Van Helden DF. Pacemaker potentials in lymphatic smooth muscle of the guinea-pig mesentery. The Journal of Physiology. 1993;471:465–479. doi: 10.1113/jphysiol.1993.sp019910. [DOI] [PMC free article] [PubMed] [Google Scholar]
- Yamamoto Y, Fukuta H, Nakahira Y, Suzuki H. Blockade by 18β-glycyrrhetinic acid of intercellular electrical coupling in guinea-pig arterioles. The Journal of Physiology. 1998;511:501–508. doi: 10.1111/j.1469-7793.1998.501bh.x. [DOI] [PMC free article] [PubMed] [Google Scholar]


