

Abstract
We have used the whole-cell patch-clamp technique to analyse the permeation properties and ionic block of the epithelial Ca2+ channel ECaC heterologously expressed in human embryonic kidney (HEK) 293 cells.
Cells dialysed with 10 mM BAPTA and exposed to Ca2+-containing, monovalent cation-free solutions displayed large inwardly rectifying currents. Their reversal potential depended on the extracellular Ca2+ concentration, [Ca2+]o. The slope of the relationship between reversal potential and [Ca2+]o on a logarithmic scale was 21 ± 4 mV, compared with 29 mV as predicted by the Nernst equation (n = 3-5 cells).
Currents in mixtures of Ca2+ and Na+ or Ca2+ and Ba2+ showed anomalous mole fraction behaviour. We have described the current-concentration plot for Ca2+ and Na+ by a kinetic permeation model, i.e. the ‘step’ model.
Extracellular Mg2+ blocked both divalent and monovalent currents with an IC50 of 62 ± 9 μM (n = 4) in Ca2+-free conditions and 328 ± 50 μM (n = 4-9) in 100 μM Ca2+ solutions.
Mono- and divalent currents through ECaCs were blocked by gadolinium, lanthanum and cadmium, with a blocking order of Cd2+ > Gd3+ > La3+.
We conclude that the permeation of monovalent and divalent cations through ECaCs shows similarities with L-type voltage-gated Ca2+ channels, the main differences being a higher Ca2+ affinity and a significantly higher current density in micromolar Ca2+ concentrations in the case of ECaCs.
The epithelial Ca2+ channel (ECaC) was originally cloned from rabbit kidney and is primarily expressed in the apical membrane of Ca2+-transporting epithelia including kidney and intestine (Hoenderop et al. 1999). Together with initial electrophysiological data it has been unequivocally demonstrated that the ECaC exhibits the defining properties of a Ca2+-selective channel which may constitute the rate-limiting step in transepithelial Ca2+ transport (Hoenderop et al. 1999; Vennekens et al. 2000). In this sense ECaC could be the prime target for hormonal control of active Ca2+ flux from the intestinal lumen or urine space to the blood compartment (Hoenderop et al. 2000).
The ECaC represents a new member of a large family of Ca2+ permeable cation channels sharing homology with the transient receptor potential channel (TRPC) (Hoenderop et al. 1999). On the basis of sequence homology this group has been subdivided in three groups, i.e. STRPCs, LTRPCs and OTRPCs. The ECaC represents a new member of the latter group (Harteneck et al. 2000). This group also includes vanilloid receptor 1 (VR1) and vanilloid receptor-like 1 (VRL1), but their homology with the ECaC is low (30 %), indicating that the ECaC may form another subgroup within this family of proteins. All these channels consist of six transmembrane segments including a short hydrophobic stretch between transmembrane segments 5 and 6, predicted to be the pore-forming region. This channel structure shares similarities with the core structure of the pore-forming subunits of voltage-gated Ca2+, Na+ and K+ channels and with those of cyclic nucleotide-gated (CNG) channels, hyperpolarization-activated cyclic-nucleotide-gated (HCN) channels and the polycystins (PKDs) (Harteneck et al. 2000).
Electrophysiological analysis of ECaC-expressing human embryonic kidney (HEK) 293 cells demonstrated large inwardly rectifying currents which were strongly dependent on extracellular Ca2+ and reversed at highly positive membrane potentials (Vennekens et al. 2000). The current rapidly decays during long-term Ca2+ permeation, an effect that was significantly delayed if Ca2+ was replaced by Ba2+ as charge carrier and completely abolished by lowering extracellular Ca2+ to 50 nM, indicating that a Ca2+-dependent process inhibits ECaC activity. We have further shown that ECaCs become highly permeable to monovalent cations in the absence of extracellular Ca2+ (Vennekens et al. 2000). These findings point to some similarities between ECaCs and voltage-gated Ca2+ channels (VGCCs), which might be reflected in analogous permeation mechanisms. The aim of the present study was, therefore, to further investigate the cationic permeation mechanism of ECaC and its block by divalent or trivalent cations, and to describe the obtained data with a permeation model previously developed for voltage-gated Ca2+ channels.
METHODS
Vector construction for ECaC-GFP co-expression
The open reading frame of rbECaC was cloned as a PvuII-BamHI fragment in the pCINeo/IRES-GFP vector (Trouet et al. 1997; Vennekens et al. 2000). This bicistronic expression vector pCINeo/IRES-GFP/rbECaC was used to co-express rbECaC and enhanced green fluorescent protein (GFP).
Cell culture and transfection
All experiments were performed using ECaC-expressing HEK 293 cells. The cells were grown in DMEM containing 10 % (v/v) human serum, 2 mM L-glutamine, 2 U ml−1 penicillin and 2 mg ml−1 streptomycin at 37°C in a humidity controlled incubator with 10 % CO2. HEK 293 cells were transiently transfected with the pCINeo/IRES-GFP/rbECaC vector using methods described previously (Kamouchi et al. 1999; Vennekens et al. 2000). Approximately 24 h after transfection, cells were used for experiments. Transfected cells were visually identified in the patch-clamp set-up. GFP was excited at a wavelength between 450 and 490 nm and the emitted light was passed through a 520 nm long-pass filter. The ECaC-expressing cells were identified by their green fluorescence and GFP-negative cells from the same batch were used as controls.
Similar results were obtained with cells expressing only GFP and GFP-negative cells.
Electrophysiology
Electrophysiological methods have previously been described in detail (Vennekens et al. 2000). Whole-cell currents were measured with an EPC-9 (HEKA Elektronik, Lambrecht, Germany, sampling rate 1 ms, eight-pole Bessel filter 2.9 kHz) or an L/M-EPC-7 (List Elektronics, Darmstadt, Germany) using ruptured patches. Electrode resistances were between 2 and 5 MΩ, and capacitance and access resistance were monitored continuously. The ramp protocol consisted of linear voltage ramps changing from -100 or -150 to +100 mV within 400 ms applied every 5 s. The step protocol consisted of a series of 60 ms voltage steps between +60 and -140 mV with a decrement of 40 mV. Holding potential was always +20 mV. Reported current densities were calculated from the current at -80 mV during the ramp protocol.
Mono-exponential fits of currents were performed using the fitting routine of the WinASCD program (G. Droogmans, KULeuven). Dose-inhibition data were fitted to a logistic dose-response function using Origin 6.0 software (Microcal Software, Northampton, MA, USA).
Solutions
The standard extracellular (Krebs) solution contained (mM): 150 NaCl, 6 CsCl, 1 MgCl2, 1.5 CaCl2, 10 Hepes and 10 glucose, adjusted to pH 7.4 with CsOH. Na+-free conditions were obtained using NMDG-Cl instead of NaCl. The concentration of Ca2+, Ba2+, Sr2+ or Mn2+ was varied between 1 and 100 mM as indicated in the text. In ‘nominal divalent cation-free solutions’, Ca2+ and Mg2+ were omitted from Krebs solution. In these conditions the concentration of free Ca2+ and Mg2+ was estimated to be in the order of 50 nM each by means of Fura-2 measurements. In order to remove divalent cations completely, 5 mM EDTA or EGTA were added. Various Ca2+- and Mg2+-containing solutions were prepared from this buffer as indicated in the text. The amounts of Ca2+ and Mg2+ to be added were calculated with the CaBuf program (G. Droogmans, KULeuven). The intracellular (pipette) solution in all experiments contained (mM): 20 CsCl, 100 caesium aspartate, 1 MgCl2, 10 BAPTA, 4 Na2ATP, 10 Hepes, adjusted to pH 7.2 with CsOH.
Statistical analysis
Data are expressed as means ±s.e.m. Overall statistical significance was determined by analysis of variance. In case of significance (P < 0.01), individual groups were compared using Student's t test.
RESULTS
Ca2+ currents through ECaC in the absence of Na+
We have previously reported that the ECaC, heterologously expressed in HEK 293 cells, is an inwardly rectifying Ca2+ permeable channel that shows a prominent monovalent permeability in divalent cation-free solutions (Vennekens et al. 2000). In order to demonstrate that Ca2+ is indeed the main current carrier in high Ca2+ solutions, we have measured currents through ECaCs in the absence of extracellular Na+. Figure 1A illustrates the effect of adding 10 mM Ca2+ to a divalent cation-free solution containing 150 mM NMDG+ instead of Na+, during a 10 s step from +20 to -30 mV. The current amplitude shows a sharp increase followed by a rapid and reversible reduction, as was shown before in the presence of Na+ (Vennekens et al. 2000). This decay process is Ca2+ dependent, but its mechanism is not yet understood. To minimize this decay process in Ca2+-containing solutions, we limited the exposure time to high [Ca2+]o to 5 s and recorded a single current trace (step or ramp) before switching back to Ca2+-free solution.
Figure 1. Ca2+ currents through ECaCs in the absence of extracellular Na+.

A, the effect of applying 10 mM Ca2+ (horizontal bar) during a 10 s step to -30 mV from a holding potential (Vh) of +20 mV, in the absence of extracellular Mg2+ and with Na+ replaced by NMDG+. ECaC-expressing HEK 293 cells were loaded with 10 mM BAPTA via the pipette in all experiments. B, current traces recorded in different Ca2+ concentrations (in mM) as indicated, in the absence of extracellular Mg2+ and with Na+ replaced by NMDG+, in response to 60 ms voltage steps to -140 mV from a Vh of +20 mV. C, currents recorded in different Ca2+ concentrations as indicated in the absence of extracellular Mg2+ and with Na+ replaced by NMDG+ in response to 50 ms voltage ramps from -100 to +100 mV with a Vh of +20 mV. D, pooled reversal potentials from 3-5 cells derived from voltage ramps as above. Currents were corrected for the capacitance current. The continuous line represents the fit of the data points with the Nernst equation (slope, 21 ± 4; n = 3–5).
Figure 1B shows current traces recorded in this way in response to voltage steps to -140 mV in 1, 10, 30 and 100 mM Ca2+ solutions in the absence of Mg2+ and with Na+ replaced by NMDG+. It is clear from this that we have to distinguish between (a) the relatively slow Ca2+-dependent current decay process (in Fig. 1A) and (b) the fast Ca2+-dependent inactivation process (in Fig. 1B) (see also Vennekens et al. 2000). The amplitude of these currents increased upon increasing [Ca2+]o with a concomitant shift of their reversal potential to more positive potentials, as illustrated by current traces in response to linear voltage ramps from -100 to +100 mV (duration, 50 ms) in Fig. 1C..
Figure 1D shows pooled data of the reversal potentials of 3-5 cells as a function of the extracellular Ca2+ concentration. The fit of these points to the Nernst equation (continuous line) had a slope of 21 ± 4 mV (n = 3-5 cells) per 10-fold change in [Ca2+]o, which is in good agreement with the theoretical value of 29 mV.
Anomalous mole fraction behaviour
Figure 2 shows currents in response to a voltage step protocol applied to ECaC-expressing HEK 293 cells exposed to Mg2+-free, 150 mM Na+-containing solutions buffered with EGTA at extracellular Ca2+ concentrations ranging from 10 nM to 30 mM. It is obvious that the current amplitudes are reduced by increasing extracellular Ca2+ from virtually no Ca2+ to up to 100 μM, but that a further increase of extracellular Ca2+ up to 5 mM or higher enhances it again. This finding is reminiscent of the anomalous mole fraction behaviour described for L-type voltage-gated Ca2+ channels in cardiac (Hess et al. 1986) and frog (Almers & McCleskey, 1984) muscle and for the Ca2+ release-activated Ca2+ (CRAC) channel (Hoth, 1995; Lepple-Wienhues & Cahalan, 1996). This anomalous mole fraction behaviour is even more evident if we plot the current amplitude as a function of the extracellular Ca2+ concentration (Fig. 3A, data from 10-13 cells, currents at -80 mV normalized to the corresponding current from the same cell in an EGTA-buffered Ca2+ solution, i.e. 1082 ± 164 pA pF−1; n = 13). It shows that 50% current inhibition occurs at a Ca2+ concentration of about 0.2 μM, a value that is comparable to that of L-type Ca2+ channels (0.7 μM Almers & McCleskey, 1984). In contrast, the current amplitudes at Ca2+ concentrations above 1 μM are much larger than for voltage-gated Ca2+ channels, which is consistent with a substantial contribution of Ca2+ to the ECaC current in this concentration range. The continuous line in Fig. 3A represents the current as predicted by the ‘step’ model, which was previously developed for L-type Ca2+ channels (Dang & McCleskey, 1998), using the energy profiles for Ca2+ and Na+ depicted in Fig. 3B.. This step model assumes a single high affinity binding site flanked by a low affinity binding site on either side. High permeation rate is accounted for by the stepwise changes in binding affinity provided by the low affinity binding sites. The energy profile was assumed to be symmetrical with equidistant barriers and wells. The depth of the central energy well for Ca2+ is -18RT, corresponding to a dissociation constant of 150 nM. The heights of the outer energy barriers, i.e. 9 and 10RT for Ca2+ and Na+, respectively, are in the range expected for diffusional access to and departure of ions from the pore. Other parameter values are summarized in Table 1.
Figure 2. Currents through ECaCs in the presence and absence of extracellular Ca2+.

Currents recorded in response to a voltage step protocol from +60 to -140 mV in 40 mV decrements (Vh, +20 mV; duration, 60 ms), in the presence of 150 mM Na+. Mg2+ was omitted from the extracellular solution. ECaC-expressing HEK 293 cells were loaded with 10 mM BAPTA via the pipette. Extracellular Ca2+ concentrations were prepared with 5 mM EGTA (see Methods) and applied as indicated.
Figure 3. Modulation of ECaC permeation by extracellular Ca2+: the step model.

A, mean normalized current values measured at -80 mV during linear voltage ramps in various [Ca2+]o. Currents were normalized to the current value for the same cell in buffered divalent-free solution (1082 ± 164 pA pF−1 ranging between 295 and 3000 pA pF−1, n = between 10 and 13). The continuous line represents the current densities as predicted by a model with one high affinity binding site flanked by a low affinity binding site at each side, using the energy profiles for Ca2+ and Na+ depicted in B. The dashed and dotted lines represent the fractions of the current carried by Ca2+ and Na+, respectively. B, energy profiles of the ECaC pore along the path of the pore for Ca2+ and Na+ (as multiples of RT; for details see Results). C, the predicted occupation of the ECaC pore by Ca2+ as a function of the Ca2+ concentration, i.e. the chance to find 1, 2, 3 or no Ca2+ ions bound within the pore (for details see Results section).
Table 1.
Comparison of the step model for ion permeation for ECaCs and L-type Ca2+ channels
| Outer barriers | Outer well | Inner barriers | Central well | |||||
|---|---|---|---|---|---|---|---|---|
| Na+ | Ca2+ | Na2+ | Ca2+ | Na2+ | Ca2+ | Na2+ | Ca2+ | |
| Current values | 10 | 9 | 8 | −3 | 20 | 6 | −2 | −18 |
| Dang & McCleskey | 10 | 10 | −2 | −4 | 9.2 | −2 | −2 | −15.5 |
Comparison of the parameters of the step model (as multiples of RT, where R is the gas constant and T the absolute temperature) applied to ECaCs and those for voltage-gated Ca2+ channels described in Dang & McCleskey (1998).
The dashed and dotted lines in Fig. 3A represent the fractions of the current carried by Ca2+ and Na+, respectively. Obviously, the current is mainly carried by Ca2+ at concentrations exceeding 1 μM. The predicted occupation of the channel by Ca2+ as a function of the Ca2+ concentration is shown in Fig. 3C..
The anomalous mole fraction behaviour was less pronounced for mixtures of Ca2+ and Ba2+ in nominal Mg2+-free conditions (Fig. 4). The pattern is essentially the same as reported for L-type Ca2+ channels, but a striking difference is the fact that the current carried by Ba2+ through ECaCs is much smaller than that carried by Ca2+ (Almers & McCleskey, 1984; Hess et al. 1986). Because of the limited number of data points, however, it was not possible to fit these data reliably to a kinetic model.
Figure 4. Anomalous mole fraction behaviour for Ca2+ and Ba2+.

A, representative whole-cell current traces recorded in response to linear voltage ramps (-100 to +100 mV; Vh, +20 mV; t, 400 ms). Various mixtures of Ba2+ and Ca2+ were applied regarding a total sum of 30 mM divalents extracellularly in nominal Mg2+-free conditions, in the presence of 150 mM Na+ in the bath solution. B, mean normalized current values measured at -80 mV (n = 5-10) for the different solutions applied. Current values were normalized to the value for the same cell in 30 mM Ca2+ solution (222 ± 55 pA pF−1; n = 10).
Block of mono- and divalent cation currents by divalent and trivalent cations
We have investigated the concentration dependence of the block by extracellular Mg2+ on currents carried by either monovalent cations in Ca2+-free solutions or Ca2+ in 100 μM Ca2+-containing solutions (Fig. 5). Figure 5A shows the time course of a typical experiment at -80 mV during sequential application of various extracellular Mg2+ concentrations in the absence of extracellular Ca2+. Corresponding I-V curves obtained from voltage ramp protocols at various Mg2+ concentrations are shown in Fig. 5B in the absence of Ca2+ and in Fig. 5C in the presence of 100 μM Ca2+. The current amplitudes were measured at -80 mV to avoid the time-dependent component which is apparent in the presence of extracellular Ca2+ at negative potentials (Nilius et al. 2000). Current amplitudes at each Mg2+ concentration were normalized to the corresponding current amplitude in a Mg2+-free solution from the same cell (mean current density amounted to 1085 ± 73 pA pF−1 with n = 4 for divalent-free solutions buffered with 5 mM EDTA and 328 ± 68 pA pF−1 (n = 11) in the presence of 100 μM Ca2+). The pooled data, as summarized in Fig. 5D, were fitted to a logistic dose-response function. The IC50 values for the Mg2+ block (at -80 mV) were 62 ± 9 μM (n = 4) for the monovalent cation current and 328 ± 50 μM (n = 4-12) for the current mainly carried by Ca2+ ions. Cadmium is another divalent inorganic compound that is frequently used as a blocker of Ca2+ channels. It also blocked divalent currents through ECaCs (in the presence of 100 μM Ca2+) with an IC50 of 2.5 ± 0.6 μM (n = 6). Monovalent currents on the other hand were more sensitive to Cd2+ and were blocked with an IC50 of about 2 nM (data not shown).
Figure 5. Block of monovalent and Ca2+ currents through ECaCs by extracellular Mg2+.
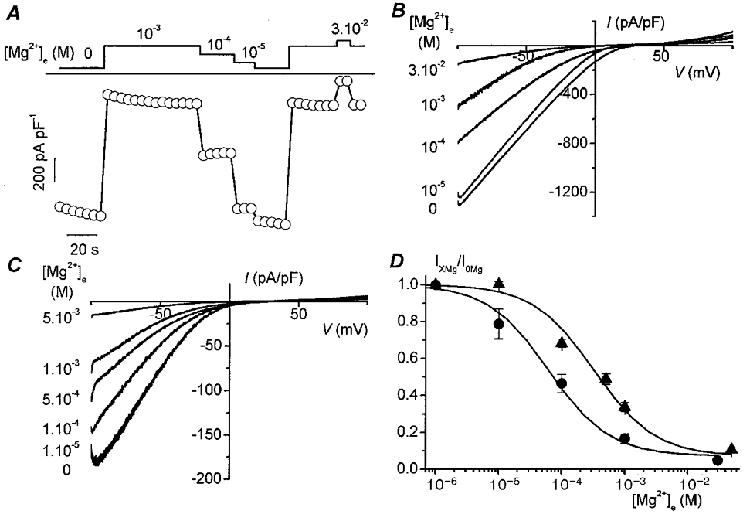
A, time course of the current at -80 mV in divalent cation-free bath solution containing 5 mM EDTA. Different Mg2+ concentrations were applied as indicated by horizontal bars (expressed in M). Linear voltage ramps as in B were applied every 5 s. B, representative current traces at different extracellular Mg2+ concentrations, as indicated, in the absence of extracellular Ca2+. Cells were loaded with 10 mM BAPTA through the patch pipette. Linear voltage ramps from -100 to +100 mV were applied every 5 s (Vh, +20 mV; t, 400 ms). C, representative current traces for the Ca2+ current at different extracellular Mg2+ concentrations, as indicated, in the presence of 100 μM extracellular Ca2+. Cells were loaded with 10 mM BAPTA through the patch pipette. Ramp protocol as in B. D, dose-response curve of Mg2+ blocking monovalent and 100 μM Ca2+ currents. Mean current densities at -80 mV were 1085 ± 73 pA pF−1 (n = 4) in buffered divalent cation-free solution (•) and 328 ± 68 pA pF−1 (n = 11) in 100 μM Ca2+, 0 Mg2+ solution (▴). IC50 for inhibition of the monovalent current is 62 ± 9 μM (n = 4), in comparison with 328 ± 50 μM (n between 9 and 4) for the Ca2+ current. Currents were normalized to the corresponding value for the same cell in Mg2+-free solution.
The trivalent cations Gd3+ and La3+ also inhibited ECaC currents. With 30 mM Ba2+ as the charge carrier IC50 values were (at -80 mV) 1.1 ± 0.2 μM (n = 13) and 4.6 ± 0.4 μM (n = 11), respectively (Fig. 6). Dose-response curves as shown in Fig. 6C were obtained analogously as described above for Mg2+. At a concentration of 1 μM both trivalent cations completely inhibited the current carried by monovalent cations in the absence of extracellular Ca2+ (not shown).
Figure 6. Block of Ba2+ currents through ECaCs by extracellular La3+ and Gd3+.

A, representative current traces at different extracellular La3+ concentrations, as indicated, in the presence of 30 mM extracellular Ba2+. Cells were loaded with 10 mM BAPTA through the patch pipette. Linear voltage ramps from -100 to +100 mV were applied every 5 s (Vh, +20 mV; t, 400 ms). B, representative current traces at different extracellular Gd3+ concentrations in the presence of 30 mM extracellular Ba2+. Cells were loaded with 10 mM BAPTA through the patch pipette. Linear voltage ramps from -100 to +100 mV were applied every 5 s (Vh, +20 mV; t, 400 ms). C, dose-response curves of La3+ (▪) and Gd3+(•) block of currents induced by 30 mM Ba2+ through ECaC. Current densities were measured at -80 mV and normalized to the value in 30 mM Ba2+ solution from the same cell. Mean value 30 mM Ba2+ was 127.9 ± 19.5 pA pF−1 (n = 24). IC50 for block of barium currents was 1.1 ± 0.2 μM (n = 13) and 4.6 ± 0.4 μM (n = 11), for Gd3+ and La3+, respectively.
DISCUSSION
The epithelial Ca2+ channel (ECaC), is a Ca2+-selective channel, with a conductance sequence of Ca2+ > Sr2+≈ Ba2+ > Mn2+. The channel is constitutively opened and is subject to various Ca2+-dependent regulation mechanisms still to be elucidated (Vennekens et al. 2000). The Ca2+ permeability of the ECaC is confirmed in this work by the observation that the dependence of the reversal potential of the currents carried by Ca2+ in the absence of monovalent cations has a slope of 21 mV per 10-fold change in Ca2+ concentration, which is in fairly good agreement with the theoretical value predicted by the Nernst equation (i.e. 29 mV per 10-fold change in Ca2+ concentration). Despite the presence of 10 mM BAPTA in the pipette solution a Ca2+-activated Cl− current was activated upon addition of extracellular Ca2+ in about 10 % of the ECaC-expressing HEK cells. Evidently these cells were omitted from the analysis.
Permeation model for the ECaC
Permeation through ECaCs shows similarities to permeation through other Ca2+-selective channels, such as voltage-gated Ca2+ channels (Almers & McCleskey, 1984; Hess et al. 1986) and CRACs (Lepple-Wienhues & Cahalan, 1996). As shown previously, ECaCs become permeable to monovalent cations upon removal of extracellular Ca2+ and Mg2+ (Nilius et al. 2000). In the present paper we show that ECaC displays anomalous mole fraction (AMF) behaviour when mixtures of Na+ and Ca2+ or Ba2+ and Ca2+ are applied. The fact that the AMF effect is not so pronounced in the case of Ca2+ and Ba2+ is, according to us, due to the fact that the difference in permeability through the channel for Ca2+ and Ba2+ is not so great as that for monovalents and Ca2+.
Anomalous mole fraction behaviour is generally accepted as evidence for a channel pore containing multiple binding sites occupied by permeant ions moving in single file through the channel (Hille, 1992). Two distinct kinetic models have been developed to account for this anomalous mole fraction behaviour and high ion transfer rate of the Ca2+ channel pore in the case of L-type voltage-gated Ca2+ channels, i.e. the ‘repulsion model’ proposed by Almers & McCleskey (1984) and Hess et al. (1986) and the ‘step model’ by Dang & McCleskey (1998). The value of these models is that one can deduce general principles of ion permeation in the absence of an exact knowledge of the underlying molecular structure. In this work we have applied both models to our data but only for the step model were we able to deduce a set of parameters which provided a fairly good description of the data. The step model envisions a channel pore in which two low affinity binding sites flank a central high affinity binding site. In the absence of extracellular Ca2+ the channel pore is available for monovalent permeation through the channel. However, in the presence of [Ca2+]o the binding sites within the pore will preferentially bind Ca2+, as a result of the higher binding affinity of the binding sites for Ca2+ compared with Na+. From the Ca2+ occupancy plot it is clear that block of monovalent currents in nanomolar [Ca2+]o occurs through binding of a single Ca2+ ion in the pore when [Ca2+]o rises to the micromolar range. The Ca2+ flux at higher [Ca2+]o is generated in parallel with multiple occupancy of the channel pore, although the chance of finding the ECaC pore in the triple Ca2+ occupied state is very low. Put in a more direct way, Ca2+ flux parallels the occupancy of the internal low affinity binding site. The drive for ion permeation results from the steps in binding affinity provided by the low affinity sites, as if the flanking sites provide stair steps for the ion to mount out of the channel pore (Dang & McCleskey, 1998). The most striking differences between the parameters for L-type Ca2+ channels and ECaCs are the height of the inner barriers for Na+ and the slightly higher Ca2+ affinity of the central well in the case of ECaCs (Table 1). These features can account for the significantly higher current densities we measured in micromolar Ca2+ concentrations in the case of ECaCs, compared with L-type Ca2+ channels. The reasonably adequate description of our data by this model does not, however, guarantee the uniqueness of the derived parameters. Nevertheless our analysis clearly underscores the similarities in permeation properties of ECaCs and L-type voltage-gated Ca2+ channels, properties which can be described by mechanisms which reconcile channel specificity and high Ca2+ fluxes in a multiple occupied, single-file pore through steps in binding energy. As for the structural meaning of the high and low affinity binding sites further molecular characterization of the pore region of ECaC is required.
Block of ECaCs by extracellular di- and trivalent cations
Previously we have shown that Mg2+ blocks monovalent currents through ECaCs in a voltage-dependent manner. It was deduced through a Woodhull analysis that the Mg2+ binding site is located within the channel pore, i.e. 31 % within the membrane electrical field (Nilius et al. 2000). In the current work we found a 5-fold difference between the IC50 of Mg2+ block of monovalent (62 μM) and Ca2+ currents (328 μM). Furthermore in the presence of 2 mM [Ca2+]o the IC50 will shift even further to values up to 9 mM (data not shown). Such a difference in blocking capacity depending on the permeating cation seems to be a general property of the inorganic Ca2+ channel blockers we have used in the current work (see also Ellinor et al. 1995; Carbone et al. 1997). In the case of Ca2+ and Mg2+ this difference cannot be explained by simple competition between both cations for binding to a common site inside the ECaC pore. The apparent binding constant of Mg2+ in the presence of Ca2+, given by: 
where Kd,Mg and Kd,Ca are the dissociation constants for Mg2+ and Ca2+, respectively, would indeed decrease 103-fold for a Kd,Ca of 0.2 μM by increasing [Ca2+] from 0 to 100 μM, rather than 5-fold as observed in our experiments. An alternative though speculative mechanism could be that binding of Ca2+ inside the pore influences the affinity of Mg2+ binding to its binding site. It is clear, however, that molecular identification of the Mg2+ binding site is necessary to further pursue this issue. On the other hand in the case of Cd2+ we indeed found a 103-fold difference between the IC50 value in the presence of 100 μM Ca2+ and in the absence of extracellular divalents. This finding therefore suggests that Ca2+ and Cd2+ compete for the same binding site within the ECaC pore. As a comparison, Cd2+ block of Ba2+ currents through voltage-gated Ca2+ channels (IC50, 300 nM in 40 mM Ba2+) is 300 times less potent than the block of Li+ currents (IC50, 1 nM) (Ellinor et al. 1995), which further underlines the differences in pore properties between ECaCs and VGCCs.
Currents through ECaCs are also blocked by La3+ and Gd3+, well-known potent blockers of Ca2+ channels (Hille, 1992). The blocking sensitivity for ECaCs is comparable to that described for CRACs (Hoth et al. 1993), whereas L- and T-type Ca2+ channels are more sensitive (Ca2+ currents through T-type calcium channels: IC50 values of 267 nM and 1.02 μM for Gd3+ and La3+, respectively, Mlinar & Enyeart, 1993). In contrast, analogues of the transient receptor potential channel, such as hTrp3 (Kamouchi et al. 1999) and dTrpL (Kunze et al. 1997), are less sensitive to La3+ and Gd3+.
Acknowledgments
We thank Dr J. Eggermont for providing the IRES-GFP vector, D. Hermans, M. Crabbé, H. Van Weijenbergh and M. Schuermans for their skilful technical assistance and help with the cell cultures. This work was supported by the Belgian Federal Government, the Flemish Government and the Onderzoeksraad KULeuven (GOA 99/07, FWO. G.0237.95, FWO G.0214.99, FWO G.0136.00; Interuniversity Poles of Attraction Program, Prime Ministers Office IUAP Nr.3P4/23, and COF/96/22-A069), by ‘Levenslijn’ (7.0021.99), a grant from the Alphonse and Jean Forton - Koning Boudewijn Stichting R7115 B0 and the Dutch Organisation of Scientific Research (NWO-ALW 805-09.042).
References
- Almers W, McCleskey EW. Non-selective conductance in calcium channels of frog muscle: calcium selectivity in a single-file pore. The Journal of Physiology. 1984;353:585–608. doi: 10.1113/jphysiol.1984.sp015352. [DOI] [PMC free article] [PubMed] [Google Scholar]
- Carbone E, Lux HD, Carabelli V, Aicardi G, Zucker H. Ca2+ and Na+ permeability of high-threshold Ca2+ channels and their voltage-dependent block by Mg2+ ions in chick sensory neurones. The Journal of Physiology. 1997;504:1–15. doi: 10.1111/j.1469-7793.1997.001bf.x. [DOI] [PMC free article] [PubMed] [Google Scholar]
- Dang TX, McCleskey EW. Ion channel selectivity through stepwise changes in binding affinity. Journal of General Physiology. 1998;111:185–193. doi: 10.1085/jgp.111.2.185. [DOI] [PMC free article] [PubMed] [Google Scholar]
- Ellinor PT, Yang J, Sather WA, Zhang JF, Tsien RW. Ca2+ channel selectivity at a single locus for high-affinity Ca2+ interactions. Neuron. 1995;15:1121–1132. doi: 10.1016/0896-6273(95)90100-0. [DOI] [PubMed] [Google Scholar]
- Harteneck C, Plant TD, Schultz G. From worm to man: three subfamilies of TRP channels. Trends in Neurosciences. 2000;23:159–166. doi: 10.1016/s0166-2236(99)01532-5. [DOI] [PubMed] [Google Scholar]
- Hess P, Lansman JB, Tsien RW. Calcium channel selectivity for divalent and monovalent cations. Voltage and concentration dependence of single channel current in ventricular heart cells. Journal of General Physiology. 1986;88:293–319. doi: 10.1085/jgp.88.3.293. [DOI] [PMC free article] [PubMed] [Google Scholar]
- Hille B. Ionic Channels of Excitable Membranes. Sunderland, MA, USA: Sinauer; 1992. [Google Scholar]
- Hoenderop JG, van der Kemp AW, Hartog A, van de Graaf SF, van Os CH, Willems PH, Bindels RJ. Molecular identification of the apical Ca2+ channel in 1,25- dihydroxyvitamin D3-responsive epithelia. Journal of Biological Chemistry. 1999;274:8375–8378. doi: 10.1074/jbc.274.13.8375. [DOI] [PubMed] [Google Scholar]
- Hoth M. Calcium and barium permeation through calcium release-activated calcium (CRAC) channels. Pflügers Archiv. 1995;430:315–322. doi: 10.1007/BF00373905. [DOI] [PubMed] [Google Scholar]
- Hoth M, Fasolato C, Penner R. Ion channels and calcium signaling in mast cells. Annals of the New York Academy of Sciences. 1993;707:198–209. doi: 10.1111/j.1749-6632.1993.tb38053.x. [DOI] [PubMed] [Google Scholar]
- Kamouchi M, Philipp S, Flockerzi V, Wissenbach U, Mamin A, Raeymaekers L, Eggermont J, Droogmans G, Nilius B. Properties of heterologously expressed hTRP3 channels in bovine pulmonary artery endothelial cells. The Journal of Physiology. 1999;518:345–358. doi: 10.1111/j.1469-7793.1999.0345p.x. [DOI] [PMC free article] [PubMed] [Google Scholar]
- Kunze DL, Sinkins WG, Vaca L, Schilling WP. Properties of single Drosophila Trpl channels expressed in Sf9 insect cells. American Journal of Physiology. 1997;272:C27–34. doi: 10.1152/ajpcell.1997.272.1.C27. [DOI] [PubMed] [Google Scholar]
- Lepple-Wienhues A, Cahalan MD. Conductance and permeation of monovalent cations through depletion-activated Ca2+ channels (ICRAC) in Jurkat T cells. Biophysical Journal. 1996;71:787–794. doi: 10.1016/S0006-3495(96)79278-0. [DOI] [PMC free article] [PubMed] [Google Scholar]
- Mlinar B, Enyeart JJ. Block of current through T-type calcium channels by trivalent metal cations and nickel in neural rat and human cells. The Journal of Physiology. 1993;469:639–652. doi: 10.1113/jphysiol.1993.sp019835. [DOI] [PMC free article] [PubMed] [Google Scholar]
- Nilius B, Vennekens R, Prenen J, Hoenderop JGJ, Bindels JM, Droogmans G. Whole cell and single channel monovalent cation currents through the novel epithelial Ca2+ channel, ECaC. The Journal of Physiology. 2000;527:239–248. doi: 10.1111/j.1469-7793.2000.00239.x. [DOI] [PMC free article] [PubMed] [Google Scholar]
- Trouet D, Nilius B, Voets T, Droogmans G, Eggermont J. Use of a biscistronic GFP-expression vector to characterise ion channels after transfection in mammalian cells. Pflügers Archiv. 1997;434:632–638. doi: 10.1007/s004240050445. [DOI] [PubMed] [Google Scholar]
- Vennekens R, Hoenderop JG-J, Prenen J, Stuiver M, Willems PHGM, Droogmans G, Nilius B, Bindels RJM. Permeation and gating properties of the novel epithelial channel, ECaC. Journal of Biological Chemistry. 2000;275:3963–3969. doi: 10.1074/jbc.275.6.3963. [DOI] [PubMed] [Google Scholar]