

Abstract
We have studied the effect of bradykinin (Bk) on fibroblast-like satellite (FLS) cells isolated from cultures of neonatal rat dorsal root ganglia (DRG).
In voltage-clamped FLS cells Bk evoked an inward current response that was concentration dependent with a half-maximal concentration of 2 nM.
In indo-1 AM-loaded FLS cells Bk evoked a rise in intracellular Ca2+ that was concentration dependent with a half-maximal concentration of 1 nM.
The FLS cells still produced an inward current in response to Bk in the absence of extracellular Ca2+ but the response was inhibited if the intracellular concentration of EGTA was increased from 0.5 to 5 mM, which suggests that the inward current was dependent on the release and subsequent rise of intracellular Ca2+.
The reversal potential of the Bk-induced inward current was consistent with the current being due to an increase in Cl− conductance and shifted in a Nernstian manner when the intracellular Cl− concentration was reduced.
The inward current response to Bk was blocked by the B2 receptor antagonist HOE-140, which indicates that the response was due to activation of B2 receptors.
The data suggest that Bk evokes a rise in intracellular Ca2+ and activation of a Ca2+-activated Cl− conductance in the FLS cells and raise the possibility that FLS cells contribute to the pro-inflammatory effects of Bk in DRG.
Bradykinin (Bk) is released when the kallikrein-kinin system is activated during tissue stress or damage (Raidoo & Bhoola, 1998). It is an important mediator of pain and inflammation (Dray & Perkins, 1993; Dray, 1997; Millan, 1999). Bk-evoked pain is due, at least partly, to direct activation of B2 receptors that are expressed constitutively by nociceptive sensory neurones (Dray & Perkins, 1993). The B2 receptors are coupled to phosphoinositidase C and Bk-induced pain and/or hyperalgesia probably involves phosphorylation of plasma membrane ion channels by protein kinase C-ε (Burgess et al. 1989; Cesare et al. 1999). Receptors for Bk are not only found on neurones but are expressed by a wide range of cell types (Farmer & Burch, 1992). For example, Bk receptors are expressed by non-neuronal cells such as glial cells (Stephens et al. 1993) and fibroblasts (Estacion, 1991) but the role, if any, played by non-neuronal cells in the pro-inflammatory effects of Bk is not clear. Schwann cells in dorsal root ganglia (DRG) release glutamate in response to Bk (Parpura et al. 1995) and fibroblasts release prostaglandin E2 (Lerner et al. 1992) so it is reasonable to suppose that indirect effects of Bk on non-neuronal cells might contribute to the response of the sensory neurones. There is also good evidence that B1 receptors, which are induced during inflammation, mediate Bk-induced hyperalgesia and/or allodynia but it is unclear whether these receptors are located primarily on neurones (Eckert et al. 1999) or on non-neuronal tissues (Davis et al. 1996).
In the present study we describe responses to Bk of small fibroblast-like satellite (FLS) cells isolated from neonatal rat DRG. These cells are usually associated with the somata of DRG neurones and they proliferate in culture after acute dissociation of ganglia. It has previously been shown that peri-somatic non-neuronal satellite cells proliferate in DRG during local inflammation or following peripheral axotomy (Lu & Richardson, 1991) but little is known of their contribution to neuronal signalling either in normal tissue or under pathological conditions. Preliminary data have already been published (England et al. 1995).
METHODS
Cell culture
Cell cultures were obtained following enzymatic dispersal of neonatal rat dorsal root ganglia (DRG), as described previously (Wood et al. 1988). Briefly, 1- to 3-day-old Sprague-Dawley rat pups were killed by cervical dislocation followed by decapitation, and the DRG were removed. These were collected into Hames F14 medium containing penicillin (100 i.u. ml), streptomycin (100 μg ml−1) and l-glutamine (2 mm), and supplemented with 10 % fetal calf serum. Ganglia were then transferred to F14 medium containing 0.125 % collagenase, and were incubated at 37oC and 3 % CO2 in air, for a period of 40 min. The partially digested ganglia were washed in enzyme-free F14 medium, and triturated in fresh medium to which had been added 50 ng ml−1 nerve growth factor (Promega or Alamone). Cells were cultured on 35 mm Petri dishes (Nunc).
After approximately 3 days in vitro the glial cells began to undergo more rapid cell division, and approached confluence at around 5-7 days after dissociation. It was therefore necessary to replate the cells in order to obtain single cells for recording. This was achieved by resuspension of the cells and gentle trituration with a fire-polished wide-bore Pasteur pipette, approximately 4 h prior to electrophysiological measurements. This procedure virtually eliminated neurones from the cultures since the dishes were not treated with polyornithine or laminin, which aids adherence of cell soma to the culture dish. The attachment and growth of the glial cells was unaffected by this procedure. Recordings were made 5-7 days after the initial dissociation of the ganglia.
Electrophysiology
Membrane currents were recorded using the whole-cell configuration of the patch-clamp technique (Hamill et al. 1981). Recordings were made using an Axopatch 200A amplifier (Axon Instruments). Current signals were low-pass filtered at 5 kHz (4-pole Bessel filter) and digitized using a Digidata 1200 interface (Axon Instruments). Control of command potential, data acquisition and analysis were performed using pCLAMP software (Axon Instruments) running on an IBM-compatible personal computer (Dell 486). Recordings were stored on the hard drive of the computer and plotted on a chart recorder for off-line analysis. Fire-polished pipettes of 3-5 MΩ resistance were used, and cell capacitance currents were minimized wherever possible via the amplifier circuitry.
The extracellular recording solution contained (mm): 154 NaCl, 1.8 NaHCO3, 5.6 KCl, 2.0 CaCl2, 5.6 glucose and 10.0 Hepes, adjusted to pH 7.4. In the majority of experiments a caesium-based pipette solution (which blocked voltage-gated potassium currents) was used, the composition of which was (mm): 130.0 CsCl, 10.0 NaCl, 10.0 Hepes and 0.5 EGTA, adjusted to pH 7.4. In some initial experiments KCl was used to replace the CsCl, and in other experiments the EGTA concentration in the pipette was raised to 5 mm, as indicated in the text. In those experiments where intracellular Cl− was reduced, CsCl in the pipette was replaced with equimolar caesium methanesulphonate. In these experiments errors due to changes in junction potential were minimized by nullifying any offset potentials just prior to sealing the pipette onto a given cell.
Voltage-clamp recordings were made at 34 ± 1°C. Bath temperature was maintained by passing the perfusing solution through a heating coil and by surrounding the recording chamber with a heated water jacket. Agonist applications were made via pressure ejection (2 s ejection at 60 kPa) through a glass pipette with wide-bore tip placed close (≈500 μm) to the cell of interest, or by U-tube. Antagonists were added to the extracellular solution, and cells were exposed to antagonist for at least 5 min prior to agonist application.
Calcium measurements
Cells were plated on to polyornithine-coated glass coverslips and incubated in 5 μm indo-1 AM in the dark at 37°C for between 45 and 60 min. The coverslips were removed from the Petri dishes and placed in a custom-built chamber which was superfused by a gravity fed system at 5-10 ml min−1 at room temperature (21-23°C) on the stage of an inverted microscope (Nikon Diaphot 200) that was equipped for epifluorescence measurements. The composition of the superfusate was the same as that used for electrophysiological experiments. For measurements in zero Ca2+, Ca2+ salts were omitted from the superfusate and EGTA (1 mm) was added. The indo-1 AM was excited at 360 nm via a × 40 fluoro-objective and two emission wavelengths (405 and 488 nm) were simultaneously monitored using a pair of photomultiplier tubes (Thorn EMI). The output voltages from the photomultipliers were relayed to a bespoke ratio amplifier (Mr E. Dyett, University College London) and the signals at 405 and 488 nm and the 405 nm/488 nm ratio were monitored and recorded on a personal computer running pCLAMP 6.0 (Axon Instruments).
Initially an area of the coverslip with no cells present was used to offset the background light level and this was checked routinely and adjusted between measurements from different cells. A further check on the accuracy of the background subtraction was performed by manganese (200 μm) quenching of the dye. A cell was placed in the centre of an aperture (25 μm in diameter) and the excitation intensity adjusted to ensure minimal bleaching of the dye over 8 min by adjusting the neutral density filters. To minimize dye bleaching the excitation light pathway was interrupted when measurements were not being taken.
The intracellular Ca2+ levels were recorded as 405 nm/488 nm fluorescence ratios. To ensure that these data were on the linear part of the Ca2+ concentration-405 nm/488 nm ratio curve we measured Rmin and Rmax, which were estimates of the minimum and maximum ratios that we could record using our equipment. Rmin was assessed by loading the cells with dye in the normal way and then superfusing them with a zero Ca2+ solution to which was added BAPTA-AM (250 μm) for 1 h. The mean (±s.e.m.) fluorescence ratio of the cells measured under these conditions was 0.36 ± 0.01 (n = 20). The lowest ratio obtained was 0.27. Rmax was measured by placing the cells in a high Ca2+-containing superfusate (20 mm) and adding ionomycin (10 μm). Under these conditions Rmax was 3.93 ± 0.06 and the highest ratio obtained was 4.42.
Drugs
All tissue culture media were obtained from Gibco. Chemicals were supplied by Sigma, except for the caesium salts which were from Aldrich. Bk and HOE-140 were obtained from stocks synthesized at the Novartis Institute for Medical Sciences.
Analysis and statistics
General analysis was performed using Microsoft Excel (version 97 and earlier versions) software. Non-linear curve fitting was performed using MicroCal Origin 4.1 software. Sigmoid concentration—response data were fitted to a logistic equation of the form:
where R is response amplitude, Rmax is maximum response amplitude, A is the concentration of Bk, EC50 is the half-maximal concentration and H is the Hill slope. Data are expressed as means ± standard error of the mean (s.e.m.) for n cells. Statistical comparisons were made using Student's t test for unpaired samples, and P < 0.05 was considered significant.
RESULTS
Properties of fibroblast-like satellite cells
Fibroblast-like satellite (FLS) cells were identified by their characteristic morphology. Within 1 h or so of replating or in non-confluent cultures the cells had a flat appearance with broad processes emanating from a poorly defined cell body (Fig. 1A). With the amplifier in voltage recording configuration and using a K+-based ‘physiological’ pipette solution the resting membrane potential of the FLS cells was found to be -59.1 ± 3.4 mV (n = 10). When these cells were voltage clamped to a holding potential (Vh) of -60 mV, a depolarizing voltage step protocol revealed a small voltage-gated outward current (Fig. 1B). This outward current was absent in cells in which the pipette solution contained Cs+ rather than K+ (Fig. 1C). The FLS cells displayed no other voltage-activated currents. The Cs+-based pipette solution was used for all further experiments so that the influence on the data of the voltage-activated outward current, which is presumably a K+ current, was minimized. The properties of the voltage-activated outward current were not studied further.
Figure 1. Characteristics of fibroblast-like satellite (FLS) cells.
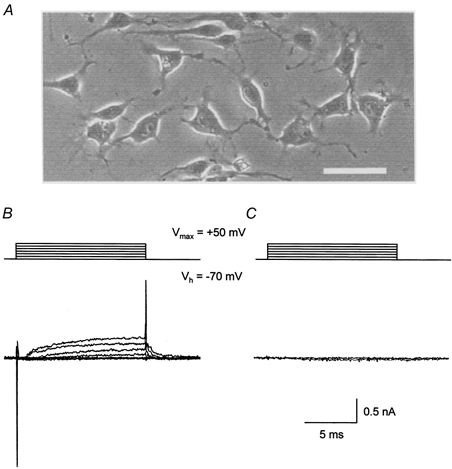
A, phase-contrast photomicrograph of a group of FLS cells. The scale bar (bottom right) is 0.1 mm long. B, a family of voltage-dependent outward membrane currents (lower records) recorded in response to a series of depolarizing voltage steps (upper records) from a FLS cell dialysed with a K+-based ‘physiological’ pipette solution. C, data from an equivalent experiment to that illustrated in B except that the FLS cell was dialysed with a Cs+-based pipette solution (see Methods).
The electrophysiological response to Bk
Application of Bk (2 s, 10 nm, n = 17) to voltage-clamped (Vh= -60 mV) FLS cells evoked a rapidly activating inward current that decayed slowly back to the resting level (Fig. 2A). The current peaked 6.9 ± 0.3 s after the onset of Bk application and the half-time for current decay was 40.9 ± 4.1 s. The inward current response to Bk desensitized profoundly; a second application of Bk within 5 min to the same cell yielded no further response. Because of the desensitization the concentration dependence of the response to Bk was determined by pooling data obtained from several cells for single responses to a given concentration of Bk. The threshold for responsiveness was found to be between 0.1 and 1 nm and a maximum response occurred with concentrations of Bk greater than 10 nm. The EC50 for the response, calculated from the concentration-response curve, was 2.0 nm (Fig. 2B).
Figure 2. The Bk response of FLS cells.
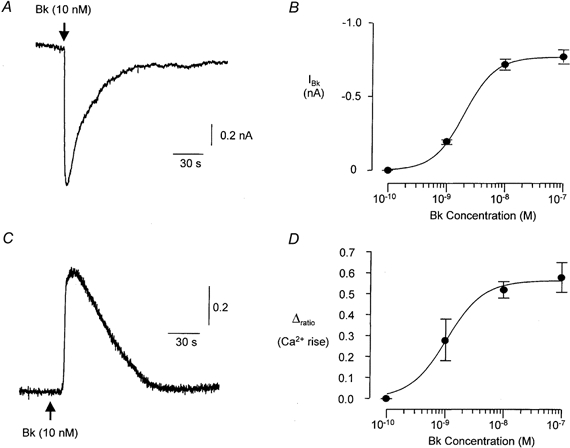
A, typical inward current response of a voltage-clamped (Vh= -60 mV) FLS cell to application of Bk (10 nm). The relationship between the size of the Bk-evoked inward current and the applied concentration of Bk is plotted in B (n≥ 7 for each point). The continuous line through the data points in B is drawn according to a Hill equation (see Methods) with a slope factor of 1.6, maximum at 0.77 nA and half-maximal concentration of 2.0 nm. C, typical intracellular calcium response of an indo-1 AM-loaded FLS cell to application of Bk (10 nm). Concentration-response data for the intracellular calcium response are plotted in D (n≥ 5 for each point) and fitted using a Hill equation with a slope factor of 1.4, maximum Δratio (change in 405 nm/488 nm fluorescence ratio) of 0.56 and a half-maximal concentration of 1.0 nm.
Over the course of this study electrophysiological recordings were made from over 200 individual cells but under control conditions only three cells (< 2 %) failed to respond to Bk at a concentration of 10 nm or above.
Calcium response to Bk
The resting 405 nm/488 nm fluorescence ratio in indo-1 AM-loaded FLS cells was 0.76 ± 0.05 (n = 22). Application of Bk (10 nm, 10 s) caused an increase in the ratio of 0.52 ± 0.04 (n = 5, Fig. 2C) which is consistent with an increase in intracellular Ca2+. The time to peak of the Bk response was 10.5 ± 1.8 s and the half-time for decay of the response was 54.2 ± 3.8 s. The relatively slow rise time of the Ca2+ response compared with the electrophysiological response (see above) may be a reflection of the lower temperature at which these experiments were carried out. The Ca2+ response desensitized; a second application of Bk to the same cell within 5 min of the first response still evoked an increase in Ca2+ but the response was 65.7 ± 2.6 % smaller than the first response. As for the electrophysiological response, the concentration dependence of the Ca2+ response was determined by pooling data obtained from single responses to a given concentration of Bk from several cells. The threshold for responsiveness was between 0.1 and 1 nm and a maximum response occurred with concentrations of Bk greater than 10 nm. The EC50 for the response, calculated from the concentration- response curve, was 1.0 nm (Fig. 2D). Depolarization of FLS cells by application of superfusate containing 60 mm K+ had no measurable effect on the fluorescence ratio (n = 7).
Ionic basis of the Bk-induced inward current
The reversal potential for the inward current evoked by Bk in voltage-clamped cells was determined in order to identify the ionic species responsible. From Vh= -60 mV the command potential (Vc) was changed using either a linear ramp protocol (-80 to +50 mV over 3 s) or stepped (step duration = 500 ms) to a range of potentials between -100 and +80 mV. Current was recorded before and during application of 100 nm Bk. Figure 3A shows current recorded from a cell that was depolarized during the Bk response using the ramp protocol. In this example the reversal potential for Bk-evoked current was -4 mV which is close to the calculated reversal potential of -4.3 mV for a current carried by Cl− ions. Equimolar replacement of part of the CsCl in the pipette solution with caesium methanesulphonate shifted the reversal potential for the inward current. The data in Fig. 3B compare the measured reversal potential for the Bk-induced inward current at three different intracellular Cl− concentrations with predicted values calculated using the Nernst equation.
Figure 3. The Bk-induced inward current in FLS cells is a Cl− conductance.
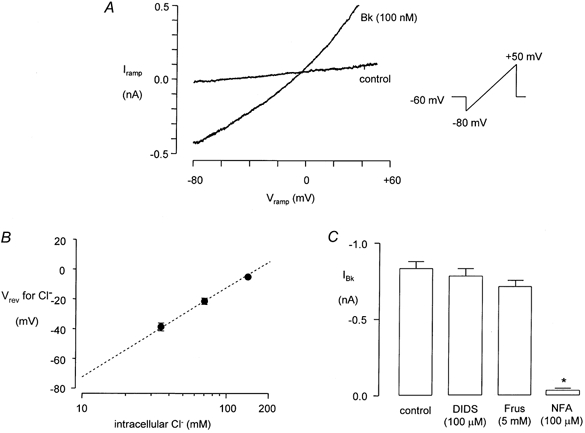
A, membrane current recorded from a voltage-clamped FLS cell during applied voltage ramps from -70 to +50 mV both before and during application of Bk (100 nm). The reversal potential for IBk, i.e. the potential at which the ramp currents intersect, was -4 mV in the example shown. Measured reversal potentials for IBk at different intracellular Cl− concentrations (log10 scale) are plotted in B, superimposed on a dashed line that indicates the expected reversal potential for a Cl− conductance calculated using the Nernst equation. The data in C compare the size of the inward current response to Bk (100 nm) in control conditions (n = 15) to the response measured in the presence of 4,4′-di-isothiocyanatostilbene-2,2′-disulphonic acid (DIDS, 100 μm, n = 5), frusemide (Frus, 5 mm, n = 5) or niflumic acid (NFA, 100 μm, n = 8). The asterisk in C indicates a statistically significant difference in the response (P < 0.005).
The Bk-induced inward current was not significantly reduced when the chloride channel blocker DIDS (4,4′-diisothiocyanatostilbene-2,2′-disulphonic acid; 100 μm, n = 5) or the anion exchange inhibitor frusemide (furosemide) (5 mm, n = 4) was present but was almost abolished by niflumic acid (100 μm, n = 9, Fig. 3C).
Ca2+ dependency of the Bk-induced inward current
The possibility that the Bk-induced inward current was secondary to the Bk-induced rise in intracellular Ca2+ was tested by increasing the EGTA concentration in the pipette solution from 0.5 to 5 mm. Under these conditions 100 nm Bk evoked small inward currents in only 4 of 13 cells whilst in control conditions, i.e. 0.5 mm intracellular EGTA, in other cells from the same cultures 9 of 9 cells responded to Bk. Attenuation of the Bk response with 5 mm intracellular EGTA was statistically significant (P < 0.005, Fig. 4A).
Figure 4. The Bk-induced inward current in FLS cells is Ca2+ dependent.
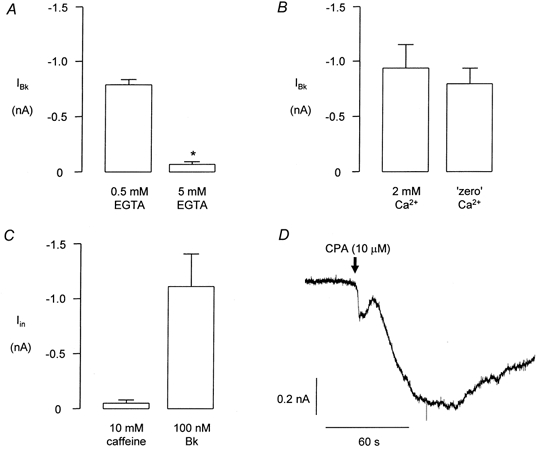
In each of A-C the data are taken from cells of equivalent cultures from the same preparation and the same approximate time in culture. A compares the mean amplitude of the Bk-induced inward current in cells containing 0.5 mm EGTA (n = 9) with that recorded in cells containing 5 mm EGTA (including non-responders, n = 13). The asterisk in A indicates a statistically significant difference (P < 0.005). B shows the effect of applying Bk (100 nm) to FLS cells in control conditions, i.e. in 2 mm extracellular Ca2+(n = 8) and in the absence of extracellular Ca2+(n = 6). C shows the lack of effect of caffeine (5 mm) in cells that subsequently responded to Bk (100 nm, n = 5). D shows a typical inward current response of an FLS cell to cyclopiazonic acid (CPA, 10 μm).
Figure 4B shows data comparing the amplitudes of responses obtained to application of Bk (100 nm) in the presence of 2 mm extracellular Ca2+ compared with responses in cells from the same cultures in a nominally Ca2+-free environment, i.e. no Ca2+ was added to the superfusate. There was no significant reduction in the size of responses to Bk obtained under these conditions, which suggests that the Ca2+ needed for activation of the Bk-induced inward current was largely due to release from intracellular stores.
Application of 10 mm caffeine to FLS cells failed to evoke inward currents in 5 of 5 cells even though subsequent application of 100 nm Bk to the same cells produced large inward currents (Fig. 4C). However, application of 10 μm cyclopiazonic acid (CPA), which releases Ca2+ from intracellular stores, evoked a slowly developing, large inward current (Fig. 4D) in 5 of 5 cells. The mean response to 10 μm CPA was 1.43 ± 0.3 nA (n = 5), which is greater than the maximum response observed to Bk.
Pharmacology of the Bk response
Relatively high concentrations of the B1 receptor agonist des-arg9 Bk (1 μm) evoked currents (0.68 ± 0.22 nA, n = 6, Fig. 5A) that were qualitatively similar to those evoked by Bk under the same conditions. Des-arg9 Bk failed to evoke a response in 5 of 5 cells when the B2 Bk antagonist HOE-140 (icatibant, 10 nm) was included in the superfusate (Fig. 5B).
Figure 5. The Bk response is mediated by a B2 receptor.
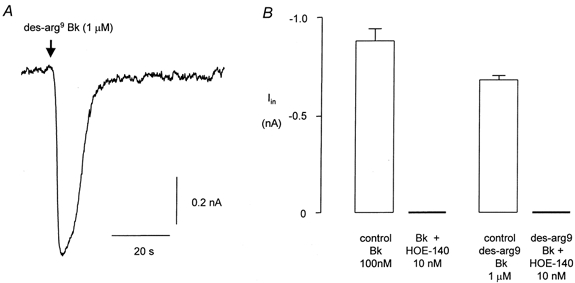
A, typical response of a FLS cell to des-arg9 Bk (1 μm). The data in B compare the control response to Bk (100 nm) and to des-arg9 Bk (1 μm) in the absence (n = 10 and n = 6, respectively) and presence (n = 5 for each) of the B2 antagonist HOE-140 (10 nm). No measurable electrophysiological response to either agonist was recorded in the presence of HOE-140.
In control conditions 10 of 10 cells responded to 100 nm Bk yielding an inward current of about 0.9 nA. In the same cultures none of 5 cells responded when HOE-140 (10 nm) was included in the extracellular medium (Fig. 5B).
DISCUSSION
We have studied FLS cells isolated from DRG, and have shown that the cells are sensitive to the inflammatory mediator Bk. The response of the FLS cells to Bk has been characterized and the data obtained suggest that Bk acts on B2 receptors and causes release of Ca2+ from a caffeine-insensitive intracellular store. The increase in intracellular Ca2+ activates a Ca2+-activated Cl− conductance.
Several lines of evidence suggest that Bk evoked a Ca2+-activated Cl− conductance in the FLS cells. Firstly, the inward current evoked by Bk had a reversal potential that was consistent with the current being carried by Cl− ions and the change in the reversal potential that occurred when the intracellular Cl− concentration was reduced was predicted by the Nernst equation. Secondly, the Bk-induced inward current was blocked by niflumic acid, a non-steroidal anti-inflammatory agent that has been shown to inhibit Ca2+-activated Cl− conductances in other cell types including astrocytes (Sanchez-Olea et al. 1993) and sensory neurones (Currie et al. 1995). Thirdly, CPA, a Ca2+-ATPase inhibitor that has a thapsigargin-like action (Gericke et al. 1993), mimicked the Bk response. CPA has been shown to increase intracellular Ca2+ levels in various other cell types (for example see Simpson et al. 1997) and evokes a Ca2+-activated Cl− conductance in mouse smooth muscle cells (Wayman et al. 1996). Fourthly, increasing the Ca2+-buffering capacity of the intracellular solution to 5 mm reduced the size of the Bk-induced current as would be expected if it were a Ca2+-dependent current (e.g. see Nietsch et al. 2000). Finally, Bk was shown to cause an increase in intracellular Ca2+ measured by indo-1 fluorescence and the concentration dependence and kinetics of the response measured in this way were very similar to the response measured electrophysiologically. All of these data are consistent with the conclusion that Bk evokes a Ca2+-activated Cl− current in these cells. Since Bk produced a response in the absence of extracellular Ca2+ it is reasonable to suppose that the rise in intracellular Ca2+ was due to release from an intracellular store. Interestingly, caffeine did not mimic the Bk response, which is consistent with a mechanism for Bk involving inositol trisphosphate-gated Ca2+ release from endothelial stores. Other mechanisms such as mitochondrial Ca2+ release are less likely but cannot be ruled out at this stage.
The receptors that mediated the Bk response were of the B2 subtype. The sensitivity of the FLS cells to Bk was in the expected range for a B2 receptor-mediated response and the response was blocked by low concentrations of HOE-140, a highly selective antagonist of B2 receptors. The response evoked by des-arg9 Bk was probably due to a non-selective effect of this compound on B2 receptors rather than a B1 receptor-mediated response since HOE-140 blocked this response too.
Previous authors have identified peri-neuronal satellite cells in DRG that are referred to as small flat Schwann cells (Manthorpe et al. 1980) or fibroblast-like cells (Wrathall et al. 1981). The cells can adopt a Schwann cell-like morphology in culture and a small proportion of these fibroblast-like cells are positive for Ran-1, a Schwann cell marker (Fields et al. 1978). The cells proliferate in DRG during local inflammation or following damage to peripheral axons (Lu & Richardson, 1991) so they may have a role in pathological inflammatory and/or neuropathic pain states. These cells, which we have called FLS cells, are morphologically similar to the precursor Schwann cells of embryonic tissue (Jessen et al. 1994; Jessen & Mirsky, 1999). It seems likely that the FLS cells are a class of glia that is either a morphologically distinct class of Schwann cells or a closely related type of glial cell. With very few exceptions all of the FLS cells responded to Bk.
A wide variety of cell types express receptors to Bk (Farmer & Burch, 1992) so it is not especially surprising that the FLS cells in DRG should also express Bk receptors although we cannot rule out the possibility that their sensitivity to Bk is due to a transformation of their phenotype in culture. The Bk sensitivity of the FLS cells is especially important since the cells are usually closely associated with the somata, and perhaps other regions, of sensory neurones. If they exert an influence on neurones through adhesion interactions or by release of chemical mediators (for example see Jessen & Mirsky, 1999; Cotrina & Nedergaard, 2000) such as amino acids (Parpura et al. 1995) then proliferation of the cells in DRG following local inflammation or peripheral axotomy (Lu & Richardson, 1991) could constitute a novel mechanism for hyperalgesia. From this perspective the FLS cells may be regarded as nociceptors in their own right. In preliminary studies (Heblich et al. 1999) we have found that the type of response evoked by Bk in sensory neurones is dependent on whether or not the neurones are associated with FLS cells. Whether this means that both non-neuronal and neuronal cell types collaborate in the generation of Bk responses or whether this simply reflects a conditioning influence of FLS cells on neurones is unclear at present.
Acknowledgments
This work was supported by the Wellcome Trust (grant reference 053230/Z/97/Z/JRS/JP/JAT).
References
- Burgess GM, Mullaney I, McNeill M, Dunn PM, Rang HP. Second messengers involved in the mechanism of action of bradykinin in sensory neurones in culture. Journal of Neuroscience. 1989;9:3314–3325. doi: 10.1523/JNEUROSCI.09-09-03314.1989. [DOI] [PMC free article] [PubMed] [Google Scholar]
- Cesare P, Decker LV, Sardini A, Parker P, McNaughton P. Specific involvement of PKC-ε in sensitization of the neuronal response to painful heat. Neuron. 1999;23:617–624. doi: 10.1016/s0896-6273(00)80813-2. [DOI] [PubMed] [Google Scholar]
- Cotrina ML, Nedergaard M. ATP as a messenger in astrocyte-neuronal communication. Neuroscientist. 2000;6:120–126. [Google Scholar]
- Currie KPM, Wooton JF, Scott RH. Activation of Ca2+-dependent Cl− currents in cultured rat sensory neurones by flash photolysis of DM-nitrophen. Journal of Physiology. 1995;482:291–307. doi: 10.1113/jphysiol.1995.sp020518. [DOI] [PMC free article] [PubMed] [Google Scholar]
- Davis CL, Naeem S, Phagoo SB, Campbell EA, Urban L, Burgess GM. B1 bradykinin receptors and sensory neurones. British Journal of Pharmacology. 1996;118:1469–1476. doi: 10.1111/j.1476-5381.1996.tb15562.x. [DOI] [PMC free article] [PubMed] [Google Scholar]
- Dray A. Kinins and their receptors in hyperalgesia. Canadian Journal of Physiology and Pharmacology. 1997;75:704–712. [PubMed] [Google Scholar]
- Dray A, Perkins M. Bradykinin and inflammatory pain. Trends in Neurosciences. 1993;16:99–104. doi: 10.1016/0166-2236(93)90133-7. [DOI] [PubMed] [Google Scholar]
- Eckert A, von Banchet GS, Sopper S, Petersen M. Spatio-temporal pattern of induction of bradykinin receptors and inflammation in rat dorsal root ganglia after unilateral nerve ligation. Pain. 1999;83:487–497. doi: 10.1016/S0304-3959(99)00152-9. [DOI] [PubMed] [Google Scholar]
- England S, James IF, Docherty RJ. Bradykinin evokes a calcium-activated chloride current in fibroblasts isolated from rat dorsal root ganglia. Journal of Physiology. 1995;485.P:48P. doi: 10.1111/j.1469-7793.2001.0395k.x. [DOI] [PMC free article] [PubMed] [Google Scholar]
- Estacion M. Acute electrophysiological responses of bradykinin-stimulated human fibroblasts. Journal of Physiology. 1991;436:603–620. doi: 10.1113/jphysiol.1991.sp018569. [DOI] [PMC free article] [PubMed] [Google Scholar]
- Farmer SG, Burch RM. Biochemical and molecular pharmacology of kinin receptors. Annual Reviews of Pharmacology and Toxicology. 1992;32:511–536. doi: 10.1146/annurev.pa.32.040192.002455. [DOI] [PubMed] [Google Scholar]
- Fields KL, Brockes JP, Mirsky R, Wendon LMB. Cell surface markers for distinguishing different types of rat dorsal root ganglion cells in culture. Cell. 1978;14:43–51. doi: 10.1016/0092-8674(78)90299-4. [DOI] [PubMed] [Google Scholar]
- Gericke M, Droogmans G, Nilius B. Thapsigargin discharges intracellular calcium stores and induces transmembrane currents in human endothelial cells. Pflügers Archiv. 1993;422:552–557. doi: 10.1007/BF00374001. [DOI] [PubMed] [Google Scholar]
- Hamill OP, Marty A, Neher E, Sakmann B, Sigworth FJ. Improved patch-clamp techniques for high resolution current recording from cells and cell-free membrane patches. Pflügers Archiv. 1981;391:85–100. doi: 10.1007/BF00656997. [DOI] [PubMed] [Google Scholar]
- Heblich F, England S, Guiato S, Docherty RJ. On the responsiveness of cultured neonatal rat dorsal root ganglion neurones to bradykinin. Society for Neuroscience Abstracts. 1999;25 897.11. [Google Scholar]
- Jessen KR, Brennan A, Morgan L, Mirsky R, Kent A, Hashimoto Y, Gavrilovic J. The Schwann cell precursor and its fate: a study of cell death and differentiation during gliogenesis in rat embryonic nerves. Neuron. 1994;12:509–527. doi: 10.1016/0896-6273(94)90209-7. [DOI] [PubMed] [Google Scholar]
- Jessen KR, Mirsky R. Schwann cells and their precursors emerge as major regulators of nerve development. Trends in Neurosciences. 1999;22:402–410. doi: 10.1016/s0166-2236(98)01391-5. [DOI] [PubMed] [Google Scholar]
- Lerner UH, Brunius G, Anduren I, Berggren P-O, Junti-Berggren L, Modeer T. Bradykinin induces a B2 receptor-mediated calcium signal linked to prostanoid formation in human gingival fibroblasts in vitro. Agents and Actions. 1992;37:44–52. doi: 10.1007/BF01987889. [DOI] [PubMed] [Google Scholar]
- Lu X, Richardson PM. Inflammation near the nerve cell body enhances axonal regeneration. Journal of Neuroscience. 1991;11:972–978. doi: 10.1523/JNEUROSCI.11-04-00972.1991. [DOI] [PMC free article] [PubMed] [Google Scholar]
- Manthorpe M, Skaper S, Varon S. Purification of mouse Schwann cells using neurite-induced proliferation in serum-free monolayer culture. Brain Research. 1980;196:467–482. doi: 10.1016/0006-8993(80)90410-2. [DOI] [PubMed] [Google Scholar]
- Millan MJ. The induction of pain: An integrative review. Progress in Neurobiology. 1999;57:1–164. doi: 10.1016/s0301-0082(98)00048-3. [DOI] [PubMed] [Google Scholar]
- Nietsch HH, Roe MW, Fiekers JF, Moore AL, Lidofsky SD. Activation of potassium and chloride channels by tumour necrosis factor alpha. Role in liver cell death. Journal of Biological Chemistry. 2000;275:20556–20561. doi: 10.1074/jbc.M002535200. [DOI] [PubMed] [Google Scholar]
- Parpura V, Liu F, Jeftinija KV, Haydon PG, Jeftinija SD. Neuroligand-evoked calcium-dependent release of excitatory amino acids from Schwann cells. Journal of Neuroscience. 1995;15:5831–5839. doi: 10.1523/JNEUROSCI.15-08-05831.1995. [DOI] [PMC free article] [PubMed] [Google Scholar]
- Raidoo DM, Bhoola KD. Pathophysiology of the kallikrein-kinin system in mammalian nervous tissue. Pharmacology and Therapeutics. 1998;79:105–127. doi: 10.1016/s0163-7258(98)00011-4. [DOI] [PubMed] [Google Scholar]
- Sanchez-Olea R, Pena C, Moram J, Pasantes-Morales H. Inhibition of volume regulation and efflux of osmoregulatory amino acids by blockers of Cl− transport in cultured astrocytes. Neuroscience Letters. 1993;156:141–144. doi: 10.1016/0304-3940(93)90458-w. [DOI] [PubMed] [Google Scholar]
- Simpson PB, Russell JT. Role of sarcoplasmic/endoplasmic-reticulum Ca2+-ATPases in mediating Ca2+ waves and local Ca2+-release microdomains in cultured glia. Biochemical Journal. 1997;325:239–247. doi: 10.1042/bj3250239. [DOI] [PMC free article] [PubMed] [Google Scholar]
- Stephens GJ, Cholewinski AJ, Wilkin GP, Djamgoz MBA. Calcium mobilizing and electrophysiological effects of bradykinin on cortical astrocyte subtypes in culture. Glia. 1993;9:269–279. doi: 10.1002/glia.440090405. [DOI] [PubMed] [Google Scholar]
- Wayman CP, McFadzean I, Gibson A, Tucker JF. Two distinct membrane currents activated by cyclopiazonic acid-induced calcium store depletion in single smooth muscle cells of the mouse anococcygeus. British Journal of Pharmacology. 1996;117:566–572. doi: 10.1111/j.1476-5381.1996.tb15228.x. [DOI] [PMC free article] [PubMed] [Google Scholar]
- Wood JN, Winter J, James IF, Rang HP, Yeats J, Bevan S. Capsaicin-induced ion fluxes in dorsal root ganglion cells in culture. Journal of Neuroscience. 1988;8:3208–3220. doi: 10.1523/JNEUROSCI.08-09-03208.1988. [DOI] [PMC free article] [PubMed] [Google Scholar]
- Wrathall JR, Rigamonti DD, Braford MR, Kao CC. Non-neuronal cell cultures from dorsal root ganglia of the adult cat: production of Schwann-like cell lines. Brain Research. 1981;229:163–181. doi: 10.1016/0006-8993(81)90753-8. [DOI] [PubMed] [Google Scholar]