

Abstract
Whole-cell transmembrane currents of second-order neurones in the caudal part of the nucleus tractus solitarii (cNTS) of brainstem slices of the rat were recorded to analyse the effects of adenosine 5′-triphosphate (ATP) on: (1) EPSCs evoked by the solitary tract stimulation (eEPSCs) and (2) spontaneous EPSCs (sEPSCs).
ATP (10−6 to 10−4 m) significantly reduced the amplitude of eEPSCs to 46·6 ± 7·4 % and increased the frequency of sEPSCs to 268·0 ± 71·5 % of the control without significant changes in sEPSC amplitude. These opposite effects of ATP on eEPSCs and sEPSCs were concurrently observed in about 80 % of cNTS neurones recorded.
The reduction of eEPSC amplitude by ATP was similarly observed with the addition of an equimolar solution of adenosine but not with α,β-methylene ATP and was suppressed by 8-cyclopentyltheophylline (CPT) and 8-cyclopentyl-1,3-dipropylxanthine (DPCPX). Addition of pyridoxal-phosphate-6-azophenyl-2′,4′-disulphonic acid (PPADS) did not affect the reduction of eEPSC amplitude by ATP.
The increase in sEPSC frequency by ATP remained under tetrodotoxin addition but was abolished in the presence of PPADS.
It is suggested that ATP activates: (1) presynaptic adenosine A1 receptors, after being hydrolysed to adenosine, reducing evoked release of glutamate from the primary afferent terminals and (2) presynaptic P2X receptors on the axon terminals of intrinsic excitatory cNTS neurones facilitating spontaneous release of glutamate. This is the first evidence that ATP modulates excitatory synaptic inputs arising from distinct origins and converging on a single postsynaptic neurone in diametrically opposite directions through activation of distinct presynaptic purinoceptors.
The nucleus tractus solitarii (NTS) is a central ‘gateway’ relaying viscerosensory information to diverse networks involved in various autonomic functions, such as respiratory, cardiovascular and digestive (Champagnat et al. 1986; Andresen & Kunze, 1994). Neurones in the caudal NTS (cNTS) receive primary afferent inputs from visceral receptors including baroreceptors, chemoreceptors and pulmonary mechanoreceptors. In addition, neurones in the cNTS contact directly with the cerebrospinal fluid at the floor of the fourth ventricle and the rostral opening of the central canal at the obex level, enabling direct detection of changes in the extracellular milieu (Barraco et al. 1991). On the basis of this neuronal and humoral information, the cNTS regulates the activities of autonomic networks in the brainstem and spinal cord, thus optimising the internal environment of the body and intracranial space (Champagnat et al. 1986; Fortin & Champagnat, 1993; Andresen & Kunze, 1994; Kawai & Senba, 1996).
Extracellular purines, such as adenosine and adenosine 5′-triphosphate (ATP), are the primary mediators signalling emergency changes in the internal environment in the central nervous system (CNS; Braun et al. 1998). Besides being released synaptically from neurones (Robertson & Edwards, 1998; Jo & Schlichter, 1999) or from astrocytes (Queiroz et al. 1999), ATP is released into the extracellular space from damaged cells under various pathophysiological situations (Inoue, 1998). The extracellular ATP is rapidly catabolised to adenosine in structures equipped with extracellular catabolising enzymes, such as ecto-ATPase, ecto-apyrase and ecto-5′-nucleotidase (Zimmermann, 1996; Dunwiddie et al. 1997; Braun et al. 1998), resulting in a rise in the extracellular adenosine concentration. Moreover, under various pathophysiological situations with energy deficiency such as hypoxia and ischaemia, intracellular adenosine is expelled into the extracellular milieu via adenosine transporters, also elevating the extracellular adenosine concentration (Schmidt et al. 1995; Doolette, 1997). These extracellular purines activate specific receptors expressed on neuronal membranes in the CNS: A1, A2A, A2B and A3 receptors for adenosine and P2X and P2Y receptors for ATP. These purinoceptors have been shown to regulate the cell-to-cell signalling in many structures in the CNS (Fredholm et al. 1990; Salter et al. 1993; Barnard et al. 1997; Ralevic & Burnstock, 1998).
Central cardiorespiratory responses to hypoxia and/or ischaemia in anaesthetised animals are mediated mostly by extracellular purines and their receptors in the CNS (Simpson et al. 1989; Schmidt et al. 1995). Of particular interest is that even during mild hypoxia the adenosine concentration in the solitary complex is increased in unanaesthetised rats (Barraco et al. 1991), suggesting its primary role in the hypoxia-induced autonomic responses. Indeed, profound effects of ATP- and adenosine-related substances microinjected into the cNTS or endogenously released by hypothalamic stimulation on cardiorespiratory activity in anaesthetised rats have been demonstrated repeatedly (St Lambert et al. 1996; reviewed in Phillis et al. 1997). These studies made in vivo indicate that the purinergic signalling system is operational in the cNTS in anaesthetised animals. In addition, important roles of purinergic signalling in the cNTS are also suggested by the following bodies of evidence ranging from the molecular to cellular level: (1) the NTS expresses the highest level of adenosine transporter in the whole CNS (Bisserbe et al. 1985); (2) the cNTS is rich in expression of A1 receptor proteins (St Lambert et al. 1996), A1 agonist binding sites (Krstew et al. 1998) and adenosine deaminase (Geiger & Nagy, 1986); (3) the medulla oblongata presents the highest density of 5′-nucleotidase of the whole brain (Nagata et al. 1984); (4) mRNAs for the P2X2, P2X4 and P2X6 receptor subunits (Collo et al. 1996), high immunoreactivity to P2X2 and P2X3 proteins (Vulchanova et al. 1997; Kanjhan et al. 1999), and high density binding of 3H-α,β-methylene ATP (Tuyau et al. 1997) are detected in the NTS; and finally (5) a subset of acutely isolated NTS neurones presents fast inward currents activated by ATP (Ueno et al. 1992).
Despite those demonstrations, evidence is still lacking for direct effects of purine substances on the neurone-to-neurone signalling in the cNTS. In this study, we aimed to provide the first direct evidence that purinergic agonists affect synaptic transmission in the cNTS network using thick slice preparations and whole-cell patch-clamp recording of postsynaptic currents of identified cNTS neurones (Champagnat et al. 1986), which enables identification of the pre- and postsynaptic mechanisms involved. This preparation also allows simultaneous recording of the excitatory postsynaptic currents induced by glutamate release from visceral afferents and that from intrinsic cNTS neurones (Champagnat et al. 1986; Fortin & Champagnat, 1993; Aylwin et al. 1997). For this purpose, we recorded postsynaptic currents in small diameter cNTS neurones which have been shown to receive predominantly excitatory inputs (Champagnat et al. 1986; Fortin & Champagnat, 1993; Kawai & Senba, 1996). The results of this study indicate that the excitatory synaptic inputs to single second-order NTS neurones evoked by afferent stimulation and those occurring spontaneously are concurrently but separately modulated by distinct types of purinoceptors through presynaptic mechanisms. This is the first evidence, to our knowledge, that ATP and adenosine oppositely modulate the excitability of a single neurone not through the activation of P2 and adenosine receptors co-expressed in a postsynaptic cell such as reported by Dale & Gilday (1996) or Jo & Schlichter (1999), but through a presynaptic modulation of distinct synaptic inputs arising from different origins converging on a single target.
METHODS
Slice preparation
All experiments were performed in accordance with the Guiding Principles for the Care and Use of Animals in the Field of Physiological Sciences of the Physiological Society of Japan (1998). Wistar rats (2-4 weeks old) of either sex were anaesthetised with ketamine (100-150 mg kg−1, i.p.) and decapitated. The brainstem was excised and submerged in ice-cold low-calcium artificial cerebrospinal fluid (aCSF) containing (mM): NaCl, 125; KCl, 2.5; CaCl2, 0.1; MgCl2, 5; NaH2PO4, 1.25; D-glucose, 12.5; L-ascorbic acid, 0.4; NaHCO3, 25 (osmolarity 320 mosmol l−1, pH 7.4 when saturated with 95 % O2-5 % CO2). The brainstem was glued to the cutting stage of a vibrating slice cutter (DTK-1000, Dosaka, Kyoto, Japan) with the caudal side up. Two to three transverse slices of 400 μm thickness including the cNTS were made. The slices were incubated in standard aCSF (mM): NaCl, 125; KCl, 2.5; CaCl2, 2; MgCl2, 1.3; NaH2PO4, 1.25; D-glucose, 12.5; L-ascorbic acid, 0.4; NaHCO3, 25; saturated with 95 % O2-5 % CO2, for 30-40 min at 37°C, then kept at room temperature until the recording. The slice was fixed in a recording chamber (∼0.2 ml volume, RC-26GLP, Warner Instruments, Hamden, CT, USA) under nylon strings attached to a U-shaped platinum frame, then submerged in, and continuously perfused with, the standard aCSF at a flow rate of 1-2 ml min−1. The neurones in the caudal NTS were visually identified with an infrared-differential interference contrast (IR-DIC) videomicroscope (BX-50WI, Olympus; C2741-79H, Hamamatsu; Argus-20, Hamamatsu) and their images were stored on hard disk for the morphological analysis and identification of the location of the neurone recorded.
Whole-cell transmembrane current recording
Patch electrodes were fabricated from borosilicate glass capillaries of 1.2 mm outer diameter (1B120F-4, World Precision Instruments) with a programmable puller (P-87, Sutter). The composition of the intracellular solution was (mM): potassium gluconate, 120; NaCl, 6; CaCl2, 5; MgCl2, 2; MgATP, 2; NaGTP, 0.3; EGTA, 10; Hepes, 10; pH 7.2 with KOH. The tip resistance of the electrodes ranged from 4 to 6 MΩ when filled with this solution. The cNTS neurones with small diameters (< 15 μm) receiving predominantly excitatory synaptic inputs (Champagnat et al. 1986; Kawai & Senba, 1996) were preselected according to the IR-DIC image to analyse spontaneous excitatory postsynaptic currents (sEPSCs). After establishment of the cell-attached configuration (1-10 GΩ seal resistance), the whole-cell mode was established with a brief negative current and pressure pulses. Recording was started at least 15 min after the rupture of the patch membrane to stabilise the intracellular milieu. During the recording, the membrane potential was held at -70 mV. Neurones showing unstable or large (> 50 pA) holding current were rejected. The series resistance (< 30 MΩ) and membrane capacitance were compensated and checked regularly during the recording. The transmembrane current and potential were recorded with a CEZ-2400 patch-clamp amplifier (Nihon-Kohden, Tokyo, Japan) with the high-cut filter at 2 kHz. The membrane current was sampled on-line at 4 kHz (PowerLab, AD Instruments) and stored on the hard disk of a computer (Macintosh G3, Apple Corporation).
After establishment of the whole-cell recording, responses to the solitary tract (TS) stimulation were examined (see below for detail of the stimulation). If the neurone was judged to receive the primary afferent input, the concentration of MgCl2 in the aCSF was increased to 3 mM and 100 μM picrotoxin was added to the aCSF, in order to suppress prolonged polysynaptic excitation activated by afferent stimulation (Champagnat et al. 1986; Fortin & Champagnat, 1993) and to isolate EPSCs, respectively. The perfusion of picrotoxin did not apparently affect the frequency of sEPSCs of the small diameter neurones used in this study. All recordings presented in this study were made with this aCSF, unless otherwise stated, and the neurones were perfused for at least 20 min before the start of each session. Recordings were made at room temperature (20-25°C).
Tractus solitarii stimulation
A stainless concentric bipolar electrode was placed on the TS ipsilateral to the recorded neurone (Champagnat et al. 1986). The distance between the two poles was 100 μm. The distance between the central pole of the stimulation electrode and the neurone recorded ranged from about 250 to 680 μm (see Fig. 1A for a typical example of the stimulation electrode placement). The intensity of the stimulation was set to the minimal voltage or current with which every pulse of TS stimulation constantly induced a clear monosynaptic EPSC peak without failure. Usually, the stimulation intensity was between 2 and 30 V or 0.06 and 6 mA (Nihon-Kohden, SS-401J). The pulse duration was 100 μs (NEC San-ei, 3F46, Tokyo, Japan). Neurones with EPSCs with time to peak (latency of the evoked current onset from the stimulus) of less than 7.5 ms with little variation were judged to monosynaptically receive TS afferent inputs (Champagnat et al. 1986). Stimulation was given every 2.01 or 5.01 s with the timing cue generated by a DigiData 1200 interface (Axon Instruments) controlled by a pCLAMP6 (Axon Instruments) program. This timing cue was recorded simultaneously with the membrane current for the off-line analysis of the evoked EPSCs (eEPSCs). In most neurones, a slight decrease in the peak amplitude of eEPSCs was observed during the first three to ten stimuli. The analysis of eEPSCs was therefore commenced after the stabilisation of the eEPSC amplitude. The mechanism of this initial decrease was not investigated in detail.
Figure 1.

Visual identification of the recorded neurones in the caudal NTS (cNTS)
A, an infrared photomicrograph indicating the position of the patch recording pipette (p) and the stimulation electrode (s) in a 400-μm thick coronal slice from a 16-day-old rat. IV, the fourth ventricle; nTS, the nucleus tractus solitarii; TS, the tractus solitarius; dmnX, nucleus dorsalis motorius nervi vagi; XII, nucleus nervi hypoglossi. B, an infrared microscopic image of cNTS neurones in a slice from a 21-day-old rat. The recording pipette can be seen on the right. Scale bar, 50 μm. C, a confocal microscopic image of a cNTS neurone used in this study filled with lucifer yellow. Left, a coronal view; right, a reconstructed saggital view.
Drugs and their application
Picrotoxin, 6-cyano-7-nitroquinoxaline-2,3-dione disodium (CNQX), 8-cyclopentyltheophylline (CPT), 8-cyclopentyl-1,3-dipropylxanthine (DPCPX), pyridoxal-phosphate-6-azophenyl-2′,4′-disulphonic acid tetrasodium (PPADS) and tetrodotoxin citrate (TTX) were purchased from Research Biochemicals International (Natick, MA, USA). Adenosine 5′-triphosphate disodium (ATP), uridine 5′-triphosphate trisodium (UTP), α,β-methylene adenosine 5′-triphosphate lithium (α,βmeATP) and α,β-methylene adenosine 5′-diphosphate (α,βmeADP) were purchased from Sigma (St Louis, MO, USA) and adenosine from Kojin (Tokyo, Japan). All solutions except picrotoxin were stored as frozen stock solutions at ×200 to ×20000 the desired final concentration and dissolved in the aCSF just prior to application. The stock solutions of CPT and DPCPX were made with 0.1 n NaOH; this did not affect the pH of the final solution diluted with aCSF. Picrotoxin was directly dissolved in the aCSF. TTX, CPT, DPCPX, α,βmeADP and PPADS were bath applied. ATP, adenosine and α,βmeATP were applied locally to the slice with a glass pipette (0.7 mm, i.d.) whose tip was placed about 2-5 mm upstream of the tip of the recording electrode. The position of this application pipette was never changed in the course of recording from one cell. The application through this pipette was remotely controlled with an electromagnetic valve-based application system (Warner Instruments, VC-6, Hamden, CT, USA). The timing cue of the valve opening was recorded together with the membrane current so that the start and end of the application could be detected off-line. The time required for the drug solution to exit from the pipette tip after opening of the valve was less than 3 s with a rate of outflow of 2-3 ml min−1. It was estimated that the concentration of the agonists in the chamber reached an expected plateau within < 10 s after opening the valve and decayed to the level before application within 10 s. Bath superfusion with aCSF was discontinued during application of ATP, adenosine or α,βmeATP in order to assure the expected concentration in the chamber. After each application, the dead space of the pipette was filled with aCSF to avoid leakage of drugs from the tip of the pipette into the recording chamber. An interval of at least 5 min was allowed between repeated applications of ATP, adenosine and α,βmeATP even though there was no detectable effect. The aCSF with picrotoxin, TTX, CPT, DPCPX, α,βmeADP or PPADS was perfused for at least 10 min before testing the effects of agonists. Once perfused with any of these blockers, the slice was never used for recording from another neurone.
As described in Results, part of the response of cNTS neurones to ATP was very similar to that to adenosine. We therefore investigated whether the ATP solution was contaminated with adenosine, which is often the source of mis-interpretation of the data obtained with purinergic agonists (see Barnard et al. 1997). A 100 μl aliquot of the ATP stock solution (20 mM) was used for the analysis with high-performance liquid chromatography (SCL-6B and LC-6A, Shimadzu, Tokyo) and UV-VIS spectrophotometry (SPD-6AV, idem). The content of ATP, adenosine 5′-diphosphate and adenosine 5′-monophosphate in the stock solution of ATP was 97.79, 1.50 and 0.71 %, respectively. The adenosine content was under the detectable limit.
Data analysis
The recorded membrane current was analysed off-line with an Igor Pro 3.15 (WaveMetrics, OR, USA) program with the Igor Pro procedures written by F. Kato.
Evaluation of eEPSC amplitude
The eEPSC amplitude was calculated as the difference between the post-stimulus trough current and the pre-stimulus mean current over 10 ms. The eEPSC amplitude was normalised to the pre-application mean from the most stable period (30-60 s) before drug application. The moving average over nine consecutive eEPSC amplitudes was calculated and plotted vs. time scale (e.g. Fig. 2B). The averaged traces of the eEPSCs (e.g. Figs 2A1–3, 6A and 8A) were made by adding four to eight sampled membrane current data using stimulus pulse as the trigger. For the slow-sweep traces (e.g. Figs 2A, middle, 3A and 4A), the stimulus artefacts were digitally annulled in order to show both the time-dependent changes in the membrane current and the eEPSC minima.
Figure 2.
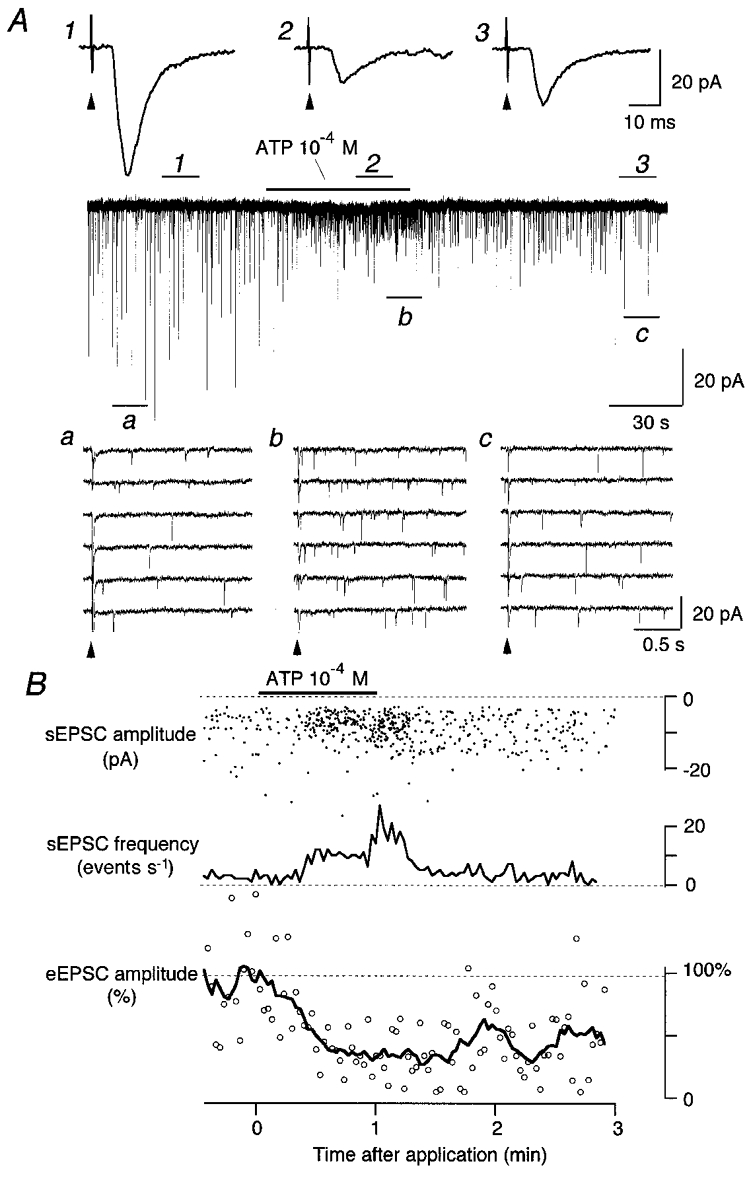
Effects of ATP on evoked and spontaneous excitatory postsynaptic currents (eEPSCs and sEPSCs, respectively) of a second-order cNTS neurone
A: top, mean eEPSC waveforms before (1), during (2) and after (3) ATP (10−4 M) application. Stimulus-triggered mean of six consecutive eEPSCs. The solitary tract was stimulated at arrowheads every 2.01 s. Middle, transmembrane current of a second-order cNTS neurone. ATP (10−4 M) was applied at the horizontal bar. Numbers 1, 2 and 3 show the periods in which the mean eEPSC traces at the top were obtained. The fast-sweep traces before (a), during (b) and after (c) ATP application are shown at the bottom. Bottom, the timing of stimuli is indicated with arrowheads. B: top, the amplitude of each detected sEPSC (ordinate) plotted at the time of its occurrence (abscissa). Middle, the instantaneous frequency of sEPSCs. Bottom, the amplitude of each eEPSC normalised to the pre-ATP mean (○) and their moving average over nine consecutive stimuli (line). The abscissae are the same for top, middle and bottom plots. ATP (10−4 M) was applied at the horizontal bar. The result of the same ATP application as in A. The membrane potential was held at -70 mV.
Figure 3.
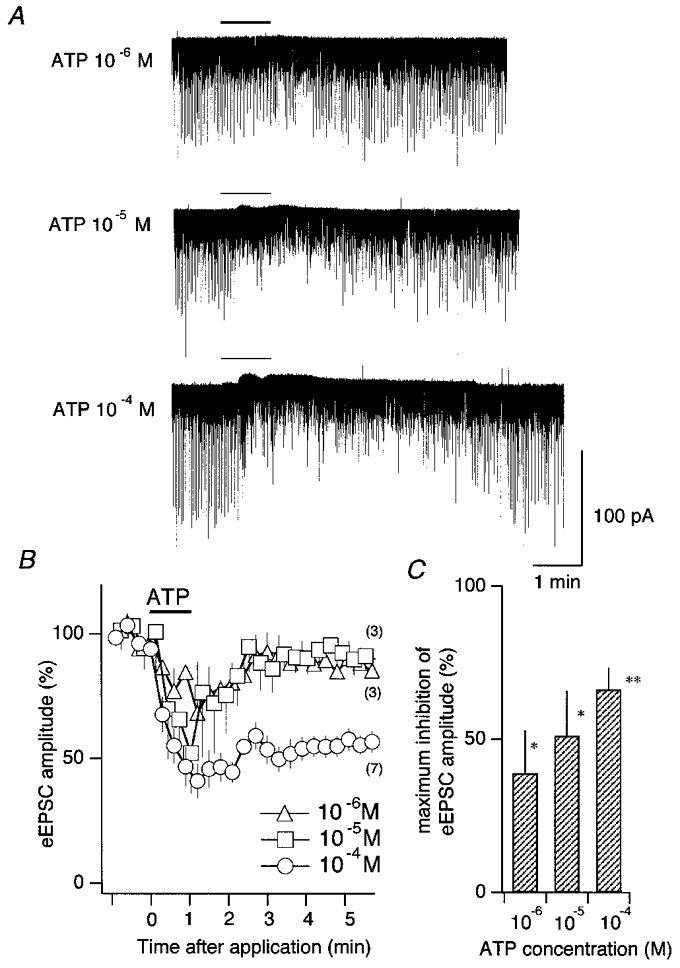
Inhibitory effect of ATP on eEPSCs of second-order cNTS neurones
A, effects of focal application of ATP, 10−6 m (top), 10−5 m (middle) and 10−4 m (bottom), on transmembrane current and eEPSCs. The period of application (1 min) is shown as a horizontal bar above each trace. Downward deflections represent the eEPSCs evoked by solitary tract stimulation at every 2.01 s; the stimulus artefacts were digitally annulled before plotting. B, the time course of the effect of ATP. Abscissa, time after ATP application. ATP was applied from 0 to 1 min (horizontal bar). Ordinate, eEPSC amplitude normalised to the pre-application mean. Each symbol and vertical bar represents the mean and s.e.m., respectively, of eEPSC amplitude averaged over nine consecutive stimuli. Numbers in parentheses indicate the number of neurones in which the same protocol of ATP application and stimulation was done for each ATP concentration. C, mean and s.e.m. (vertical bar) of the maximal inhibition of eEPSC amplitude in individual neurones. *P < 0.05; **P < 0.01. The number of neurones used are the same as in B.
Figure 6.
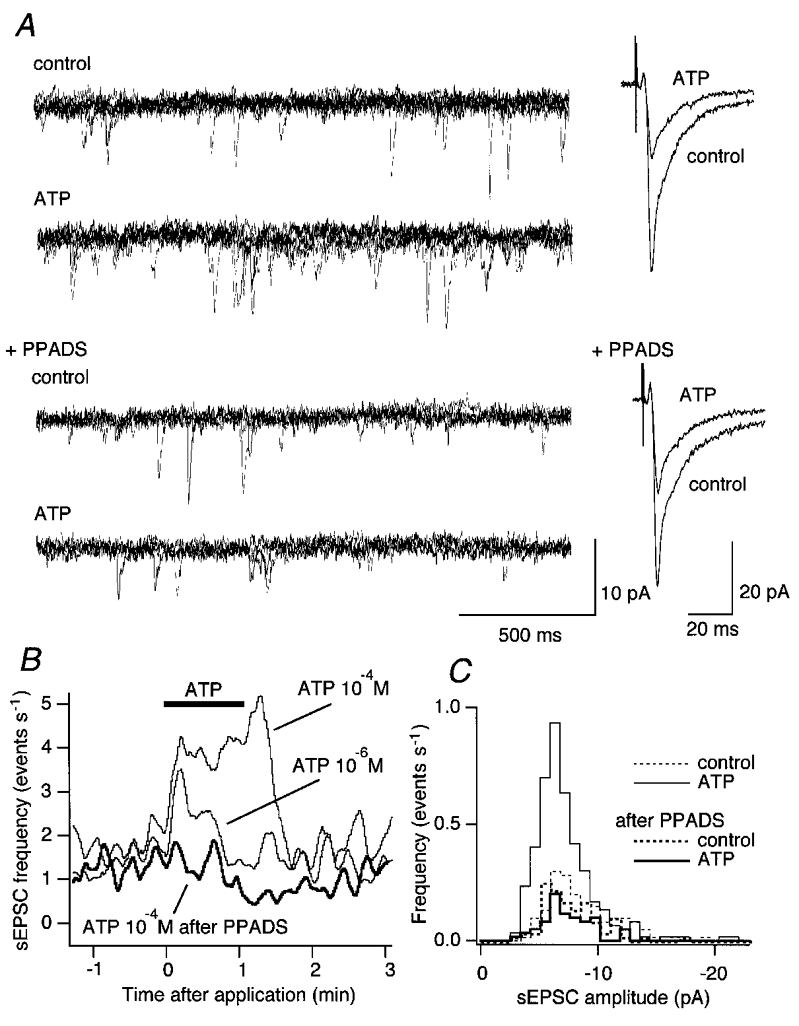
Enhancement of the spontaneous EPSC (sEPSC) frequency by ATP of a second-order cNTS neurone
A: left, traces (from top to bottom) showing sEPSCs before application (control), during application of ATP (10−4 m; ATP), before ATP application (control) with PPADS (40 μM) in the perfusate (+PPADS), and during ATP (10−4 m; ATP) application after PPADS pretreatment. Each trace is a superimposition of five sweeps. Right, effect of ATP (10−4 M) on eEPSCs before (top) and after (bottom) PPADS (40 μM). Each trace is a stimulus-triggered average of transmembrane current of four consecutive eEPSCs. The traces in the right panel are from the same recording shown in the left panel. B, instantaneous frequency of sEPSCs. Ordinate, the instantaneous sEPSC frequency; abscissa, the time after application. ATP was applied at the horizontal bar for 1 min. C, histograms showing the distribution of sEPSC amplitude. Histograms with thin lines show the result before PPADS and those with thick lines after PPADS pretreatment. Dashed and continuous lines indicate the distribution of sEPSC amplitude before and during ATP application, respectively. The total number of sEPSC events used was 105, 256, 79 and 50 for before ATP, during ATP, before ATP with PPADS and during ATP with PPADS, respectively, detected in a 60 s period.
Figure 8.

Increase of miniature EPSC (mEPSC) frequency by ATP of a second-order cNTS neurone
A, eEPSC traces of a second-order cNTS neurone evoked by solitary tract stimulation (arrowheads) at a 2.01 s interval. Left, eEPSC waveforms before (control) and during (ATP) application of ATP (10−4 M). Middle, the same as in the left panel but in the presence of CPT (10 μM). Right, addition of tetrodotoxin (1 μM) to the perfusate abolished the eEPSC. The effect of ATP on the mEPSC illustrated in B was tested under this condition. Stimulus-triggered averages of four (left and middle) or two (right) eEPSCs. Picrotoxin (0.1 mM) was always included in the perfusate. Ba1-3, consecutive traces of transmembrane current showing mEPSC events before (1), during (2) and after (3) ATP (10−4 M) application. Traces 1, 2 and 3 were taken at the points 1, 2 and 3 in Bb, respectively. Bb (from top to bottom), transmembrane current (Im), mEPSC amplitude plotted versus the timing of each event occurrence, and instantaneous mEPSC frequency. Abscissa (time after ATP application) is the same for all three plots. ATP was applied at the horizontal bar above the traces. The fast-sweep traces at 1, 2 and 3 are shown in Ba. C, cumulative probability distribution of mEPSC amplitudes before (thin dotted line) and during ATP (10−4 m; thick line) application. The two distributions were not significantly different (Kolmogorov-Smirnov test). Based on 517 events and 1127 events for control and during ATP, respectively, detected in an 86 s period.
Measurement of sEPSC amplitude and frequency
The sEPSC of cNTS neurones appeared as a rapidly rising and slowly decaying inward current as in many other EPSC recordings (e.g. Fortin & Champagnat, 1993). Each event of sEPSCs was detected and its amplitude and occurrence timing were measured with an Igor Pro procedure. In brief, the rapidly rising phase of sEPSCs was detected according to the moving variance (window width from 8 to 12 ms) of the transmembrane current data. The amplitude of each detected sEPSC was calculated by subtraction of the pre-event mean of the membrane current from the EPSC trough current. All detected sEPSCs were monitored and checked visually so that all detected events had a typical EPSC waveform. sEPSCs with a peak amplitude smaller than 2-5 pA (depending on the basal noise level of the recording) were rejected.
As mentioned above, the polysynaptic responses to TS stimulation were virtually suppressed with the aCSF containing 3 mM Mg2+ in this study (e.g. Fig. 2Aa–c). To further ensure that TS stimulation does not affect the results of sEPSC analysis, the membrane current data 30-100 ms after TS stimulation were not used in the evaluation of sEPSC amplitude and frequency. This post-stimulus period was determined according to the superimposed stimulus-triggered traces. This caused a slight (0.5-5 %) underestimation of the event frequency. To make this effect minimal, the instantaneous frequency of sEPSCs in events per second was calculated and plotted as the total number of events within a 5 s window divided by five.
Morphological analysis
The longitudinal diameter of the soma of the recorded NTS neurones was measured off-line, based on the digitised IR-DIC images (e.g. Fig. 1B). The location of the neurones recorded was plotted on two representative coronal planes (e.g. Fig. 10B) according to the IR-DIC image of the slice (e.g. Fig. 1A). In a small number of neurones, lucifer yellow (0.5 %) was added to the patch intracellular solution. In these cases, the slice was fixed with 4 % paraformaldehyde in phosphate-buffered saline (PBS) overnight and washed with PBS. The fixed slices were mounted on a slide glass with CoverWell (Grace Bio-Labs, Bend, OR, USA) for the imaging with a laser confocal microscope (Zeiss, LSM-410).
Figure 10.
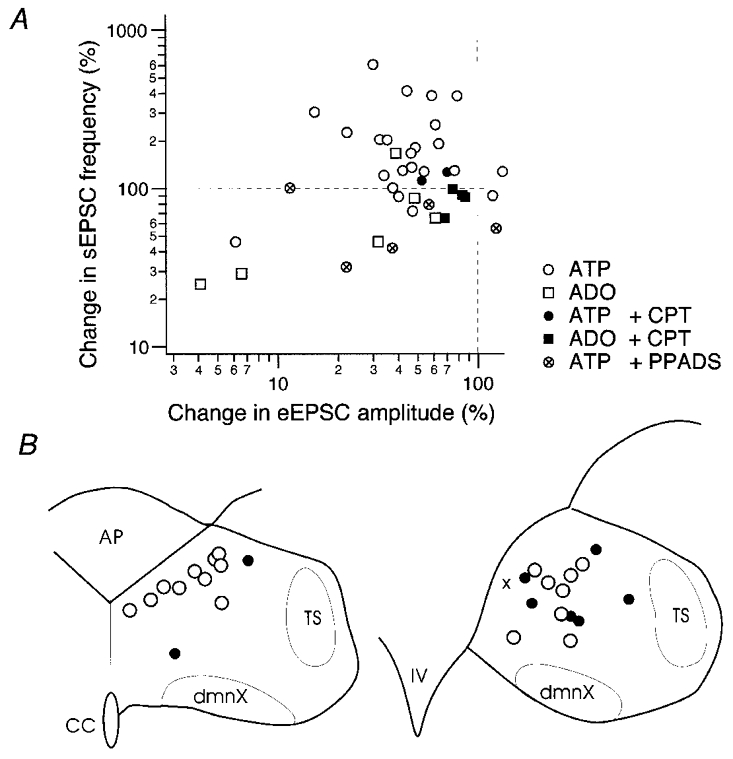
Summary of the changes in EPSCs in individual neurones by ATP and adenosine (ADO) and their location within the cNTS
A, relation of the changes by agonists in eEPSC amplitude (abscissa) and sEPSC frequency (ordinate) in individual neurones. Changes are normalised to the preapplication values. Each symbol represents the changes measured in each neurone. Legends of symbols are shown in the inset. ATP and adenosine were applied at 10−4 M. The concentrations of CPT and PPADS were 10 and 40 μM, respectively. Dashed horizontal and vertical lines at 100 % indicate that agonists induced no change in eEPSC amplitude and sEPSC frequency, respectively, of neurones whose symbols are on these lines. Note that the largest population of open circles (application of 10−4 M ATP without any blockers) is located in the upper left quadrant with respect to the dashed lines. B, location of cNTS neurones reconstructed based on infrared photomicrographs. Left, a coronal section at the subpostrema level; right, at the level of obex. AP, area postrema; TS, solitary tract; dmnX, nucleus dorsalis motorius nervi vagi; CC, the central canal; IV, the fourth ventricle. ○, location of neurones with both reduced eEPSC amplitude and increased sEPSC frequency by ATP application; •, neurones showing either reduced eEPSC amplitude or increased sEPSC frequency by ATP application; ×, a neurone showing none of the above with ATP application.
Statistical analysis
Values are expressed as mean values ± standard error of the mean (s.e.m.). Differences were compared with non-parametric Mann-Whitney U test for normalised values. Differences in the sEPSC frequencies before and after drug treatment were compared with one-way analysis of variance. Differences in the distribution of accumulated probability of the mEPSC amplitude were tested with the Kolmogorov-Smirnov test. Differences with a probability (P) of less than 0.05 were considered significant.
RESULTS
The cNTS neurones used in this study had a longitudinal diameter of the soma ranging from 6.5 to 14.5 μm (10.6 ± 0.4; n = 30) with a few dendrites and were distributed medially to the TS (Fig. 1; see also Fig. 10). As mentioned in Methods, all neurones analysed were identified as receiving monosynaptic excitatory input from TS afferents. Polysynaptic inhibitory current was not detected in all the neurones tested with, or without, picrotoxin. The mean amplitude of the eEPSC was -58.0 ± 9.1 pA (n = 21; range, -212.6 to -13.9 pA). The time to rise and the time to peak (latency of the inward current trough from the stimulus) were 3.7 ± 0.3 ms (n = 21; range, 1.5-6.3 ms) and 7.7 ± 0.4 ms (n = 21; range, 4.75-11.5 ms), respectively. The mean frequency and the mean amplitude of sEPSCs were 6.7 ± 1.8 events s−1 (n = 18; range, 1.1-34.0 events s−1) and -9.1 ± 0.9 pA (n = 18; range, -4.5 to -18.3 pA), respectively. The eEPSCs and sEPSCs were completely abolished with CNQX (10 μM) within 4 min of perfusion (6 of 6 neurones tested), indicating that they are both AMPA/kainate receptor currents. Picrotoxin (100 μM) did not significantly change the sEPSC frequency (only by 6.1 ± 9.2 % of the frequency before picrotoxin; n = 20), indicating that these neurones receive predominantly glutamatergic synaptic inputs. The neurones studied did not show spontaneous firing when no current was injected under current clamp, just after establishment of the whole-cell mode. The mean resting potential was -64.2 ± 1.4 mV (n = 21; range, -48 to -74 mV).
Effects of ATP on eEPSC and sEPSC
Figure 2 depicts typical responses of a cNTS neurone to ATP application. ATP reduced the eEPSC amplitude (Fig. 2A1-3) by more than 60 % in this neurone. The eEPSC amplitude started to decrease within ∼30 s after the beginning of ATP application and reached a plateau thereafter. The eEPSC remained reduced after washout of ATP and slowly recovered within 3-5 min (Fig. 2A, middle trace; see Fig. 3A for complete recovery).
In contrast, ATP exerted an opposite effect on sEPSCs (Fig. 2Aa-c); the number of interstimuli inward events increased during the application of ATP (Fig. 2A). The fast-sweep traces in Fig. 2Aa-c indicate that this increase was due to an increase in the number of sEPSC events.
The time course of the increase in sEPSC frequency and that of the reduction of eEPSC were distinct (Fig. 2B); the increase in sEPSC frequency was observed during ATP application and recovered immediately upon washout of ATP whereas the eEPSC amplitude still remained reduced after washout. Importantly, the reduction of eEPSC amplitude (Fig. 2B, bottom) was never accompanied with manifest changes in sEPSC amplitude (Fig. 2B, top), suggesting a presynaptic mechanism for the reduction of eEPSC amplitude for the synapses between TS fibre terminals and the neurone recorded. Similar responses of eEPSCs and sEPSCs to ATP were observed in 18 out of 20 neurones and in 13 out of 18 cNTS neurones analysed, respectively. Besides these effects on the EPSCs, 100 μM ATP transiently generated a slight outward (1.6 ± 0.9 pA; range, 0.0-7.0 pA; n = 7) or a slight inward (-4.4 ± 1.0 pA; range, -0.75 to -12.0 pA; n = 12) current in the cNTS neurones (see Fig. 2A for an example of the neurones showing an inward current and Fig. 3A for the outward current), except in two neurones in which a larger outward (19.8 pA at the peak) or inward current (-71.3 pA) was induced by ATP.
Reduction of eEPSC amplitude by ATP and adenosine
A significant reduction of eEPSCs was readily observed with ATP at a concentration of 10−6 m (Fig. 3A, top). In the range tested from 10−6 to 10−4 m, the eEPSC amplitude was more reduced and the effect lasted longer with a larger concentration (Fig. 3B). An almost complete recovery from the reduced eEPSCs was attained within 1-2 min with 10−6 or 10−5 m ATP whereas the reduction by 10−4 M ATP did not recover completely until after 5-8 min (Fig. 3A, bottom, and B).
This slow onset and recovery of the ATP effect on eEPSCs led us to speculate that there is an involvement of metabotropic receptors. As there have been a number of studies indicating presynaptic inhibition of glutamate release by adenosine (Fredholm et al. 1990), we examined the effect of adenosine on the TS-evoked EPSCs (Fig. 4). As expected, in a neurone whose eEPSC was reduced by ATP, the amplitude of the eEPSC was reduced also by an equimolar addition of adenosine (Fig. 4A and B). Adenosine exerted small and inconsistent shifts of the holding current (3.8 ± 0.2 pA; range, -3.0 to 13.0 pA; n = 8) in the cNTS neurones tested. Surprisingly, their effects were highly similar in the degree of reduction and the time course except that the onset of reduction was earlier with adenosine than with ATP (Fig. 4C). To evaluate the difference in the onset of the eEPSC inhibition by ATP and adenosine, the latency to the half-maximal response (T½) was measured for neurones showing manifest responses to ATP and adenosine (e.g. the dashed line and arrow in Fig. 4C). The T½ for ATP and adenosine was 67.8 ± 17.9 and 36.1 ± 16.5 s, respectively (n = 5). The T½ for adenosine was consistently smaller than that for ATP by 31.7 ± 4.4 s (range, 18.9-44.6 s; P < 0.002), indicating that the onset of the ATP effect on eEPSC amplitude was significantly delayed to that of adenosine.
Figure 4.
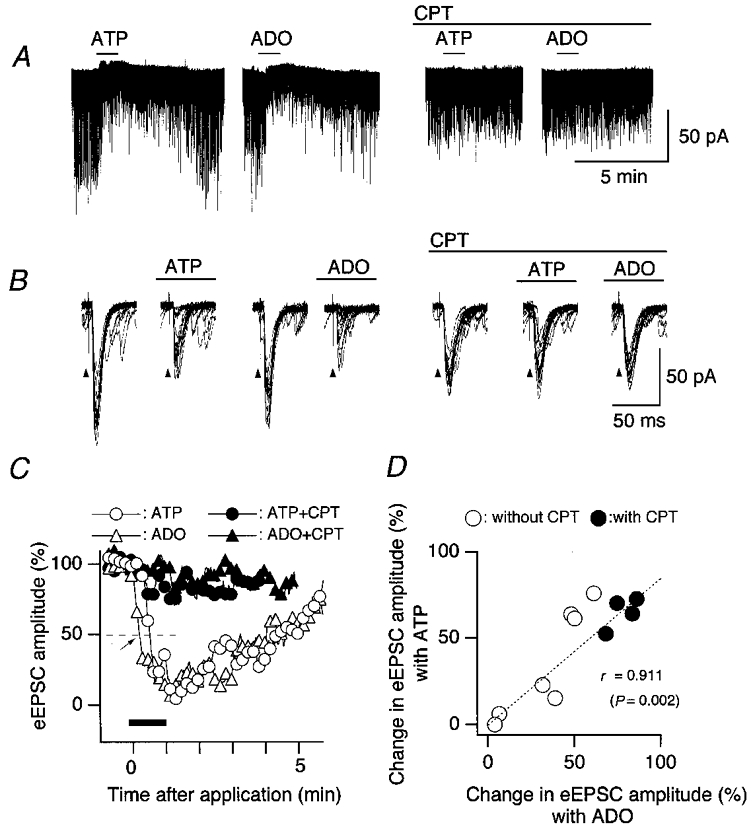
Similar inhibitory effects of ATP and adenosine on eEPSCs of second-order cNTS neurones
A, effects of ATP (10−4 m) and adenosine (ADO, 10−4 m) on transmembrane current and eEPSCs. ATP and adenosine were applied at the horizontal bar above each trace. Preperfusion and continuous perfusion of CPT (10 μM) suppressed the effects of both ATP and adenosine (two traces at the right). B, superimposed traces of eEPSCs taken from the same traces as in A but shown at a faster sweep. From left to right, fifteen superimposed eEPSC traces before ATP, during ATP, before adenosine, during adenosine, before ATP after perfusion of CPT, during ATP with CPT, and during adenosine with CPT. The solitary tract was stimulated at arrowheads every 2.01 s. C, the time course of the effect of ATP and adenosine on the normalised eEPSC amplitude recorded in the neurone shown in A and B. Agonists were applied at the horizontal bar. Each point represents the moving average of eEPSC amplitude of nine consecutive stimuli normalised to the preapplication mean. D, relation between the maximal effect of adenosine (abscissa) and ATP (ordinate) on the normalised eEPSC amplitude tested in the same individual neurones.
To examine whether the effects of ATP and adenosine on eEPSCs are mediated by common receptors, we tested the effects of blocking adenosine and P2 receptors. The reduction of eEPSC amplitude by either ATP or adenosine was markedly and significantly attenuated when CPT (10 μM), an adenosine receptor blocker, was preperfused for more than 15 min (Figs 4C, filled symbols; and 5, +CPT). We also examined the effect of DPCPX, a more selective A1-receptor antagonist, in five cNTS neurones in which the eEPSC amplitude was markedly reduced by ATP. ATP (10−4 m) reduced the eEPSC amplitude to 47.4 ± 4.7 % of the control before DPCPX and to 91.7 ± 6.9 % after DPCPX (significantly larger than before DPCPX), suggesting that an activation of adenosine A1 receptors underlies the inhibitory effects of ATP and adenosine on eEPSCs. The eEPSC amplitude was not significantly changed with CPT and DPCPX (to 118.4 ± 27.8 and 92.1 ± 3.8 % of the values before antagonist perfusion; n = 4 and 5; P = 0.84 and 0.76, respectively), suggesting little involvement if any of intrinsic extracellular adenosine in the tonic modulation of eEPSCs in the present preparation.
Figure 5.
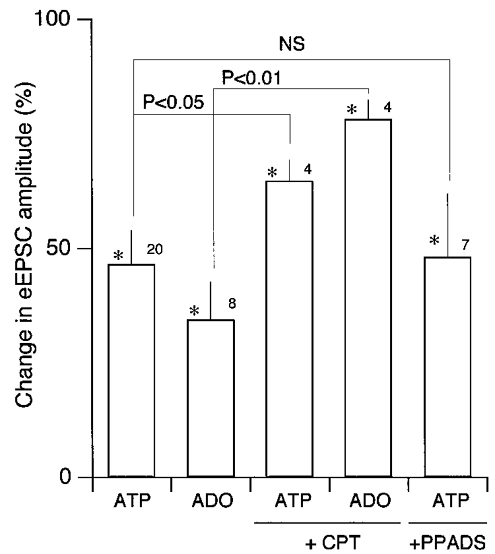
Summary of the effects of ATP and adenosine (ADO) on the eEPSC amplitude
Means and s.e.m. (vertical bar) of the eEPSC amplitude normalised to mean values before agonist application. *Significantly different from the values before agonist application at P < 0.05. NS, not significantly different. Numbers above each column indicate the number of neurones used. The concentrations of ATP, adenosine, CPT and PPADS were 10−4 M, 10−4 m, 10 μM and 40 μM, respectively. Statistical comparisons were made with Mann-Whitney U test.
The degree of the reduction of eEPSC amplitude by ATP and adenosine varied in the neurones analysed. To examine whether the reduction by ATP was related to that by adenosine, we calculated the correlation between the changes in eEPSC amplitude by these two purinergic agonists in individual cells and found a very strong significant correlation (Fig. 4D), further supporting that their effects on eEPSC amplitude were mediated by common receptors sensitive to CPT.
In contrast to CPT and DPCPX, PPADS, at a concentration that clearly suppressed the effect of ATP on sEPSC frequency (Fig. 6A, left), had no detectable effect on the ATP-induced reduction of eEPSC amplitude (e.g. Fig. 6A, right). We failed to detect any significant difference between the changes by ATP in the eEPSC amplitude with and without PPADS (P = 0.868; Mann-Whitney U test; Figs 5, far-right column, and 6A, bottom right trace), further supporting that PPADS-sensitive P2 receptors are not involved in this reduction.
To identify further the mechanism of the inhibition of eEPSCs by ATP, we examined the effect of α,βmeATP, a relatively undegradable analogue of ATP (Zimmermann, 1996), on the eEPSC (Fig. 7). In a cNTS neurone whose eEPSC amplitude was clearly reduced with ATP (Fig. 7A and B, left), α,βmeATP exerted no detectable effect on the eEPSC (Fig. 7A and B, right), despite a marked increase in the sEPSC frequency during its application (Fig. 7C). As a summary, in neurones in which the eEPSC amplitude was significantly reduced to 58.5 ± 12.6 % (n = 3) of the control with ATP (10−4 m), the eEPSC amplitude was only reduced to 97.0 ± 3.9 % of the control with α,βmeATP (10−4 m), indicating that this undegradable analogue of ATP is much less potent than ATP at inhibiting eEPSCs.
Figure 7.
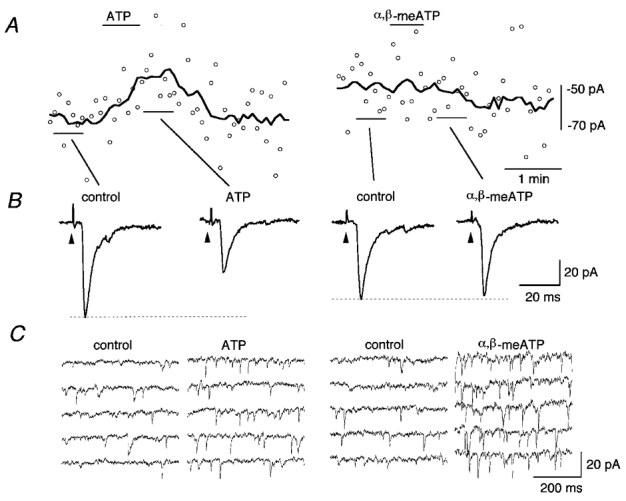
Effects of ATP and α,β-methylene ATP (α,βmeATP) on the eEPSCs and sEPSCs of a cNTS neurone
A, eEPSC amplitude (○) and the moving average over nine consecutive stimuli (thick line). Left, effect of ATP (10−4 m); right, effect of α,βmeATP (10−4 m). The drugs were applied at the horizontal bars above the traces. B, averaged waveform of eEPSC. Stimulus-triggered average of four consecutive eEPSCs. The solitary tract was stimulated at the arrowheads every 5.01 s. From left to right, before ATP, during ATP, before α,βmeATP, and during α,βmeATP. C, consecutive fast-sweep traces showing the effect of ATP and α,βmeATP on the occurrence of sEPSCs. All traces in C were selected from the periods in which there was no stimulation. A-C were from a recording in the same cNTS neurone.
We then attempted to inhibit the enzymes that break down ATP to adenosine with α,βmeADP, an inhibitor of ecto-5′-nucleotidase (Zimmermann, 1996). Contrary to expectation, in five cNTS neurones in which the eEPSC amplitude was reduced to 43.8 ± 10.2 % of the control by ATP, ATP still reduced the eEPSC amplitude to 43.1 ± 12.7 % after perfusion of α,βmeADP (100-200 μM; 10 min), which was not significantly different from the value without α,βmeADP.
Increase in sEPSC frequency by ATP
In contrast to the effect of ATP on eEPSC amplitude, ATP no longer increased the sEPSC frequency in the presence of PPADS (Fig. 6A, left, and B). Before PPADS, ATP significantly increased the sEPSC frequency to 268.0 ± 71.5 % of the control (Mann-Whitney U test; n = 17). With PPADS, ATP decreased, though not significantly, the sEPSC frequency to 62.1 ± 12.6 % of the pre-ATP value (P = 0.095). Despite the manifest increase in sEPSC frequency by ATP and its blockade by PPADS, the amplitude of sEPSCs remained unaffected by ATP or PPADS (Fig. 6C), suggesting that the increase in the sEPSC frequency is mediated by presynaptic mechanisms.
In all five neurones tested, perfusion of PPADS alone reduced the sEPSC frequency by 3.1 ± 1.5 events s−1; however, this reduction was not considered to be significant (P = 0.27), presumably due to variation over slices in the background ATP level.
Unlike the effect on the eEPSC amplitude, the effect of ATP on sEPSC frequency was not mimicked by adenosine; adenosine rather slightly reduced the mean sEPSC frequency (Figs 9; and 10A, open squares). The mean frequency of sEPSCs decreased to 75.2 ± 16.2 and 85.9 ± 7.3 % of control with adenosine before and after perfusion with 10 μM CPT, respectively. The significant increase in sEPSC frequency by ATP was still observed after CPT and DPCPX (to 143.2 ± 23.8 and 180.6 ± 27.0 % of control, respectively). We failed to detect any significant changes in the baseline sEPSC frequency by CPT and DPCPX alone (P = 0.61 and 0.37, respectively). UTP (100 μM) induced no detectable change in the sEPSC frequency nor in the eEPSC amplitude (n = 5).
Figure 9.
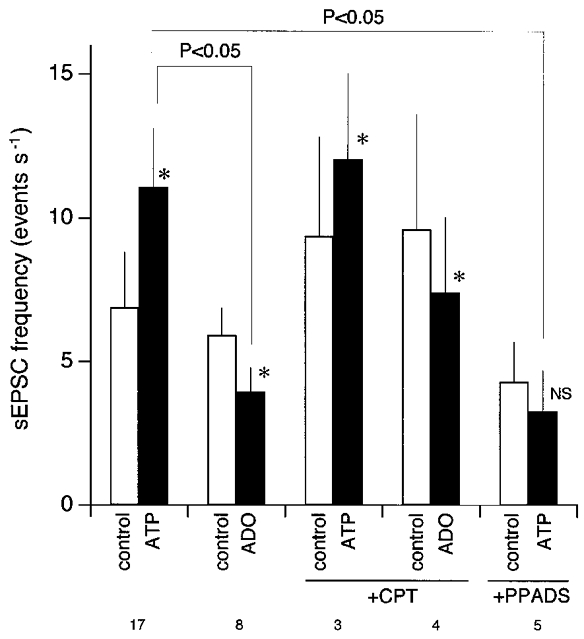
Summary histograms showing the effects of ATP and adenosine (ADO) on the spontaneous EPSC (sEPSC) frequency of cNTS neurones
Ordinate, sEPSC frequency. Open bars, sEPSC frequency (means ±s.e.m.) before agonist application (control); filled bars, the maximal sEPSC frequency during each agonist application. *The change in sEPSC frequency in each neurone by ATP or adenosine was significant (Mann-WhitneyU test; P < 0.05). NS, not significantly different. +CPT, tested in the presence of CPT (10 μM); +PPADS, tested in the presence of PPADS (40 μM). The numbers at the bottom indicate the number of neurones. Comparisons between different groups were made with one-way analysis of variance. The difference of the pairs without indication of probability were not considered significant.
To confirm further an involvement of presynaptic P2 receptors in the increase in sEPSC frequency, we measured the amplitude and frequency of miniature EPSCs (mEPSCs) recorded under TTX perfusion. In neurones in which the eEPSC amplitude was reduced by ATP in a manner sensitive to CPT as in many other neurones (Fig. 8A), TTX (1 μM) completely abolished the eEPSCs (Fig. 8A, right). However, spontaneous mEPSCs were still evident in the recording of the membrane current (Fig. 8B a). ATP increased the frequency of mEPSCs (Fig. 8B a1-3 and Bb) with a similar time course to that observed without TTX (e.g. in Figs 2B and 6B); the onset and recovery were very rapid. The increase in mEPSC frequency by ATP was without significant change in the distribution of mEPSC amplitude (Fig. 8C). A similar increase in mEPSC frequency by ATP was observed at repeated application (2 to 4 times) of ATP in all three neurones tested. ATP elevated the sEPSC frequency from 4.2 ± 1.0 to 13.6 ± 3.1 events s−1 without TTX and from 3.9 ± 1.0 to 15.1 ± 4.7 events s−1 with TTX (n = 3). We found no significant difference in the ATP-induced increase in sEPSC frequency with and without TTX (P = 0.52; Mann-Whitney U test).
Reduction of eEPSC amplitude and increase in sEPSC frequency by ATP were concurrent
The relation between changes by ATP and adenosine in the eEPSC amplitude and sEPSC frequency is summarised in Fig. 10A. In ∼80 % (18/23) of second-order NTS neurones tested, ATP induced both reduction of eEPSC amplitude and increase of sEPSC frequency simultaneously (open circles). After PPADS, ATP still reduced the eEPSC amplitude whereas the sEPSC frequency was not increased, but rather decreased (circles with central ×). In contrast, adenosine reduced both the eEPSC amplitude and sEPSC frequency in the majority of cells tested (open squares). An increase in eEPSC amplitude was observed in only two of 23 neurones with ATP and in no neurone with adenosine.
Figure 10B illustrates the location of neurones analysed within the cNTS. Though the number of neurones was not large enough and our cell selection might have been biased, we observed a slight tendency for the second-order neurones showing opposite changes in evoked and spontaneous EPSCs by ATP to be located dorsomedially in the cNTS.
DISCUSSION
This study presents the first direct demonstration that distinct purinergic receptors regulate excitatory synaptic transmission through distinct presynaptic mechanisms in the caudal NTS. The most important finding is that ATP concurrently exerted diametrically opposite effects on the TS stimulation-evoked EPSCs and on the spontaneously occurring EPSCs recorded in the same postsynaptic neurone.
The neurones analysed in the present study are likely to be members of ‘local circuit neurones’ and ‘interneurones’ of the cNTS (Kawai & Senba, 1996) which are almost identical to the cells classified as ‘prolonged increased excitability’ neurones in the pioneering work of Jean Champagnat and colleagues (Champagnat et al. 1986), because of predominant excitatory synaptic inputs abolished by CNQX and insensitive to GABAA receptor blockade (Fortin & Champagnat, 1993), small soma diameters (Champagnat et al. 1986; Kawai & Senba, 1996) and their distribution in the cNTS (ibid.). It is certain that both sEPSCs and eEPSCs recorded with picrotoxin are postsynaptic non-NMDA receptor currents activated by synaptically released glutamate as they were both abolished with CNQX (Fortin & Champagnat, 1993; Aylwin et al. 1997). The fast synaptic transmission from the axon terminal of TS fibres to second-order cNTS neurones has been shown to be mainly mediated by glutamate and ionotropic glutamate receptors (Bonham et al. 1993; Andresen & Kunze, 1994; Aylwin et al. 1997). On the other hand, it has been shown that small diameter (< 15 μm) cNTS neurones receive exclusively glutamatergic synaptic inputs from intrinsic NTS neurones in the brainstem slice of rats (Champagnat et al. 1986; Fortin & Champagnat, 1993; Kawai & Senba, 1996). A large part of the sEPSCs analysed in this study is likely to be due to action potential-independent release of glutamate because: (1) the neurones recorded in this study showed more hyperpolarised resting membrane potentials without spontaneous firing when measured just after establishment of the whole-cell mode than previous studies (e.g. Champagnat et al. 1986; Fortin & Champagnat, 1993) and (2) the sEPSC frequency was lower than that reported (ibid.) and was not significantly reduced with TTX. These differences are presumably due to the lower extracellular K+ concentration in this study.
The present results imply that distinct purinergic mechanisms controlling glutamate release are expressed on distinct presynaptic terminals depending on the origin of the terminal (TS afferents vs. intrinsic NTS neurones) and/or the mechanism of transmitter release (evoked vs. spontaneous). The most likely interpretation of the present results is as follows (Fig. 11): (1) presynaptic adenosine A1 receptors located on the axon terminals of TS fibres downregulate the action potential-dependent synaptic release of glutamate; (2) extracellular ATP is rapidly hydrolysed to adenosine in the proximity of these presynaptic receptors of TS fibres allowing extracellular ATP to activate presynaptic A1 receptors; (3) presynaptic P2X receptors located at the axon terminal of glutamatergic NTS neurones synapsing to small diameter second-order NTS neurones facilitate glutamate release through action potential-independent mechanisms; and (4) these distinct presynaptic purinergic mechanisms are expressed at distinct axon terminals converging on single cNTS neurones. Each notion is discussed below.
Figure 11.
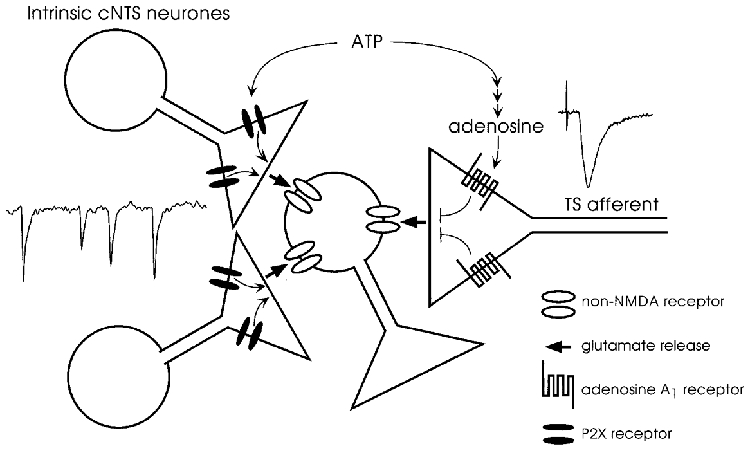
Schema for the interpretation of the opposite effects of ATP on the evoked and spontaneous excitatory inputs converging on a single second-order cNTS neurone
ATP activates directly the P2X receptors located at the presynaptic terminal of the intrinsic cNTS neurones to facilitate glutamate release. Adenosine, produced from ATP by a chain of ecto-enzymes, activates presynaptic A1 receptors located at the terminal of solitary tract afferents to suppress action potential-dependent release of glutamate (see text for detail).
Mechanism underlying presynaptic inhibition of evoked excitatory synaptic transmission by ATP and adenosine
The pharmacological characteristics demonstrated in this study, such as the time course of the action, the similarity of the effects of ATP and adenosine, the antagonism by CPT and DPCPX but not by PPADS and the lack of effect of α,βmeATP, indicate that the inhibition of eEPSCs by purines is primarily mediated by presynaptic adenosine A1 receptors; involvement of A2, P2X or P2Y receptors is, if any, little. In many structures in the CNS, activation of presynaptic A1 receptors inhibits the action potential-dependent release of glutamate through inhibition of presynaptic calcium currents (Fredholm et al. 1990). The result of the present study directly confirms, for the first time, that this presynaptic inhibition of glutamate release by adenosine is operational also in the NTS. As the amplitude of sEPSCs was not reduced by ATP or adenosine even under marked reduction of eEPSC amplitude in the present study (e.g. Figs 2 and 6), this A1 receptor-mediated reduction of glutamate release is specific to the synapses between TS fibre and second-order neurones in the cNTS. In support of this notion, Krstew et al. (1998) have demonstrated [3H]DPCPX binding in the nodose ganglion and vagal afferents projecting to the NTS, indicating that A1 receptors are localised at the central terminal of vagal afferents in the NTS. In anaesthetised rats, microinjection of a selective A1 receptor agonist into the cNTS elevates arterial blood pressure in a dose-dependent manner (Phillis et al. 1997). On the basis of the present in vitro finding, this in vivo observation can be interpreted: that reduction of glutamate release from baroreceptor nerve terminals by A1 receptor agonists induced a reflexogenic pressor response.
In contrast, it has been demonstrated that microinjection of adenosine or selective A2A receptor antagonists into the cNTS elevates the arterial blood pressure in anaesthetised rats (Phillis et al. 1997). The presence of functional A2A receptors in the nodose ganglion neurones and central terminal of the vagus nerve has been demonstrated (Castillo-Meléndez et al. 1994). A2A receptors are coupled with adenylate cyclase and their activation generally facilitates release of transmitters, such as acetylcholine and catecholamines, in the CNS and peripheral nervous system (Ralevic & Burnstock, 1998). In the isolated cNTS preparation, activation of A2A receptors results in a large increase in noradrenaline and serotonin release (Barraco et al. 1995, 1996). Since in the present study: (1) an increase in the eEPSC amplitude by ATP was observed in only two neurones and was virtually negligible (Fig. 10A) and (2) adenosine- or ATP-induced reduction of eEPSC amplitude was blocked not only by 10 μM CPT (∼1000-fold and ∼7-fold Ki for A1 and A2 receptors, respectively), but also by 1 μM DPCPX (∼1500-fold and 2-fold Ki for A1 and A2 receptors, respectively), we assume that the presynaptic A2A receptors are not primarily involved in the control of glutamate release from TS fibre endings, as indirectly suggested by Castillo-Meléndez et al. (1994).
In addition to the adenosine receptors, it should be noted that the nodose ganglia express mRNAs for six of seven known P2X receptor subunits (Collo et al. 1996). Immunoreactivity to P2X2 receptor protein in the NTS disappears in the side ipsilateral to the nodose ganglionectomy in rats (Vulchanova et al. 1996), suggesting its central terminal localisation. These P2X receptors depolarise the nodose ganglion cells and activate inward calcium current (Li et al. 1997) and thus may promote transmitter release from their central terminal. However, presynaptic enhancement of evoked glutamate release by ATP was scarcely observed in the present study. It is again possible that TS fibre terminals expressing P2X receptors are not glutamatergic. Another possible explanation for the absence of P2X receptor-mediated excitatory response of the eEPSCs in our study is the Mg2+ concentration of 3 mM in the extracellular milieu used, which was necessary to suppress polysynaptic re-excitatory processing in the cNTS network (Fortin & Champagnat, 1993). Li et al. (1997) have shown that extracellular Mg2+ reduces the ATP-activated P2X receptor currents of an acutely dissociated nodose ganglion cell at an IC50 of 1.5 mM. This Mg2+-dependent inhibition of P2X current at the TS terminal might have masked the direct ATP effect on the glutamate release from the TS terminal via P2X receptors. However, in the present study, a promoting effect of ATP on the sEPSCs and mEPSCs, likely to be mediated also by P2X receptors, was clearly observed in the same high Mg2+ solution. In addition, the reduction of eEPSC amplitude was observed also with aCSF containing 1.3 mM Mg2+ in our preliminary experiments (E. Shigetomi & F. Kato, unpublished observations). We speculate therefore that the P2X receptors expressed on the TS fibre terminals and those on the terminals of intrinsic NTS neurones are distinct in terms of pharmacological characteristics and desensitisation properties, probably due to differences in their subunit composition (Barnard et al. 1997; North & Surprenant, 2000). Immunohistochemical and pharmacological analyses suggest that P2X2/3 heteromer receptors are expressed at the central terminal of the vagus nerve in the NTS (Vulchanova et al. 1997; Virginio et al. 1998). Alternatively, it is possible that activation of presynaptic P2X receptors on the TS terminals can increase glutamate release only at the much lower release probability than in the present stimulation conditions which might have fully activated the afferent fibres with P2X receptors.
Activation of common receptors by ATP and adenosine
In many CNS structures extracellular ATP is rapidly hydrolysed to adenosine through the intermediary of extracellular catabolising enzymes (Salter et al. 1993; Zimmermann, 1996; Cunha et al. 1998). The interpretation presented in the previous section that ATP activated presynaptic A1 receptors on the TS terminals assumes that these ecto-enzyme chains breaking down ATP to adenosine are expressed close to the presynaptic A1 receptors.
The ATP-induced reduction of eEPSC amplitude was consistently delayed by ∼30 s to that by adenosine in this study. We interpret that this delay corresponds to the time required for extracellular conversion of ATP to adenosine in the cNTS. This small delay is not so unexpected as it was demonstrated in a similar slice preparation in which ATP was hydrolysed to adenosine within less than 1 s after ATP was puff-applied directly to the hippocampal neurones (Dunwiddie et al. 1997). Considering the method of application (see Discussion in Dunwiddie et al. 1997) and the high activity of adenosine transporters (Bisserbe et al. 1985) in the NTS, we consider that the delay of ∼30 s reasonably represents the time required for the conversion of ATP to adenosine to activate adenosine receptors. As the potency of adenosine in individual neurones was highly correlated to that of equimolar ATP in reducing eEPSC amplitude, it is possible that the sites of production of adenosine from ATP are localised close to the A1 receptors underlying these responses (Salter et al. 1993; Zimmermann, 1996; Dunwiddie et al. 1997).
To date, the expression of ecto-nucleotidase in the NTS has not yet been studied in detail. Nagata et al. (1984) have demonstrated that the medulla presents the highest activity of 5′-nucleotidase within the whole brain of the rat. Indeed, St Lambert et al. (1997) demonstrated that the primary phase of the pressor response by electrical stimulation of the hypothalamic defence area is mediated by A1 receptors and reduced by blocking ecto-5′-nucleotidase in the cNTS in anaesthetised rats, suggesting that the ecto-enzyme chain is functional in the cNTS in vivo.
However, we failed to demonstrate attenuation of the effect of ATP on the eEPSC amplitude by α,βmeADP, a 5′-nucleotidase inhibitor, at concentrations of 100-200 μM which are reported in the literature to be effective (Dale & Gilday, 1996; Jo & Schlichter, 1999). One possibility is that the ecto-5′-nucleotidase in the cNTS is relatively resistant to α,βmeADP (therefore a higher concentration for a longer pre-incubation period is required; Cunha et al. 2000). In support of this possibility, St Lambert et al. (1997) found that microinjection into the cNTS of 500 μM α,βmeADP resulted in only an ∼20 % decrease of the A1 receptor-mediated pressor response. Alternatively, the common effects of ATP and adenosine on the eEPSCs were not mediated by adenosine receptors but by another type of purinoceptor, e.g. P3 receptor, which is activated by both ATP and adenosine (Ralevic & Burnstock, 1998). Very recently, it was suggested that, in hippocampal pyramidal neurones, P3 receptors, activated by both ATP and adenosine, insensitive to α,βmeATP, blocked by both CPT and DPCPX and resistant to PPADS, inhibit synaptic release of glutamate (Mendoza-Fernandez et al. 2000). Involvement of such an unidentified type of purinoceptor activated by both adenosine and ATP cannot be fully ruled out at this moment; however, the difference in the T½ for adenosine and ATP in this study argues against this possibility. Due to the current limitation in pharmacological tools available for the selective block of various types of ecto-nucleotidase and P3 receptors, full identification of the mechanisms underlying the α,βmeADP-insensitive effects of ATP remains an open issue to be studied in the future (see Discussion in Robertson & Edwards, 1998).
Mechanism underlying presynaptic facilitation of spontaneous excitatory synaptic transmission by ATP
This is the first study showing a facilitation of transmitter release by presynaptic P2 receptors in the medullary nuclei. The fast rise and termination with ATP application, the manifest effect of α,βmeATP, lack of UTP effects and the blockade by PPADS suggest that this effect is mediated by ionotropic P2X receptors (Barnard et al. 1997; North & Surprenant, 2000). In addition, our unpublished observation (E. Shigetomi & F. Kato) that the increase in mEPSC frequency of cNTS neurones by ATP is dependent on extracellular Ca2+ argues against involvement of presynaptic P2Y receptors linked to intracellular Ca2+ mobilisation (Barnard et al. 1997; Ralevic & Burnstock, 1998) in this facilitation. In the NTS, expression of mRNAs for P2X2, P2X4 and P2X6 subunits (Collo et al. 1996) and immunoreactivity to P2X2 and P2X3 receptors (Vulchanova et al. 1997; Kanjhan et al. 1999) have been confirmed. As discussed above, P2X2 and P2X3 subunits seem to be expressed on the TS fibre terminals. Therefore, the P2X receptors expressed in the intrinsic NTS neurones are likely to be composed of P2X4, P2X6 and/or their heteromers (Barnard et al. 1997; North & Surprenant, 2000). Our results, that the increase in sEPSC frequency lasted almost during the whole span of the ATP application, support an involvement of slowly desensitising P2X receptors activated by α,βmeATP and sensitive to PPADS. The most probable receptor subunit composition for these properties is P2X4/6 heteromeric receptors (Barnard et al. 1997; North & Surprenant, 2000).
Compared with the manifest presynaptic effects, ATP produced little postsynaptic responses in this study. This was not due to the extracellular Mg2+ concentration of 3 mM in this study, as we have observed a similar absence of postsynaptic effects of ATP in small cNTS neurones in a study made with 1.3 mM Mg2+ (Kato, 1998). This is also consistent with the report by Nabekura et al. (1995) who observed ATP-induced inward currents in only 25 % of acutely dissociated NTS neurones. It is therefore likely that the P2X receptors in the small NTS neurones are mostly, but not exclusively, presynaptic. This contrasts with the large solitary complex neurones, such as neurones in the dorsal motor nucleus of the vagus, most of which show a large, slowly desensitising inward current in response to ATP application (Nabekura et al. 1995; Kato, 1998).
Modulation of transmitter release by presynaptic P2X receptors has been demonstrated in a number of preparations (MacDermott et al. 1999). The following three modes of presynaptic enhancement of synaptic release of glutamate by P2X receptors have been documented: (1) ATP-induced transient non-NMDA receptor currents blocked by TTX in cultured hippocampal neurones (Inoue et al. 1992); (2) ATP-induced increase in EPSC frequency, which was calcium dependent, resistant to TTX but blocked by cadmium in trigeminal mesencephalic nucleus neurones in the slice (Khakh & Henderson, 1998); and (3) increase in EPSC frequency by ATP, dependent on calcium, resistant to TTX and partly resistant to cadmium in synapses between co-cultured dorsal root ganglion cells and dorsal horn neurones (Gu & MacDermott, 1997). On the basis of our present observation that ATP increased mEPSC frequency and our unpublished observation (E. Shigetomi & F. Kato) that this increase by ATP remained in the presence of cadmium, we speculate that direct calcium influx through presynaptic P2X receptors underlies the presynaptic facilitation of glutamate release in the cNTS.
Differential regulation of glutamate release and its functional implications
The most striking finding of this study is that the inhibition of eEPSCs and enhancement of sEPSCs by ATP were simultaneously observed in single cells in a large proportion of cNTS neurones. We propose three possible mechanisms underlying this differential regulation. First, presynaptic A1 receptors at TS terminals and presynaptic P2X receptors at axon terminals of intrinsic NTS neurones are more predominant and influential than the other purinoceptors in controlling glutamate release from each terminal. Morphofunctional studies demonstrating a difference in the expression level or in the coupling with glutamate release between these receptors at distinct terminals would be required to support this possibility. It is also possible that the influence of P2X receptors at the TS terminals and that of A1 receptors at the axon terminals of intrinsic NTS neurones was masked due to their distinct properties as discussed above and therefore could not be detected under the present experimental conditions. Second, the lack, or a lower activity, of the enzyme chains that produce adenosine from ATP near the terminals of intrinsic NTS neurones does not allow A1 receptors at these terminals to be activated by ATP. Third, activation of A1 receptors can only suppress transmitter release mediated by voltage-dependent calcium channel activation, such as those underlying eEPSCs, regardless of the source of release. Despite the reduction of release mediated by voltage-dependent Ca2+ channels by A1 receptor activation, release of glutamate independent of Ca2+ channels, likely to be a part of mEPSCs (MacDermott et al. 1999), can still be facilitated. In this case, it is possible that the spontaneous glutamate release activated by ATP could arise not exclusively from intrinsic NTS neurones but also partly from TS terminals. It is an important subject for future studies to identify the precise mechanism underlying this differential regulation of glutamate release.
The first and second mechanisms mentioned above imply that axon terminals of different origins with two distinct purinergic mechanisms make synaptic connections, in the course of development, onto a single neurone in the cNTS. Since the intrinsic NTS neurones are derived from the neural crest and those in the nodose ganglia are from the epibranchial placodes (Noden, 1993), this finding provides an interesting issue concerning synaptogenesis and the regulation of expression of purinoceptors and related enzymes within the cNTS network during development.
To our knowledge, this is a novel type of co-regulation of a single target by ATP and its metabolite, adenosine. This mechanism is distinct from the co-regulation through distinct receptors co-expressed in a single neurone, such as in cultured spinal neurones (Jo & Schlichter, 1999) and from acutely isolated non-mammalian spinal motor and premotor neurones (Dale & Gilday, 1996). It is also distinct from the mechanism that pre- and postsynaptic ATP receptors activate distinct metabotropic processes as documented in cultured neuromuscular junction of Xenopus embryos (Fu & Poo, 1991).
It is proposed that the cNTS is not a simple ‘relay’ nucleus of afferent information. Rather, it controls the downstream autonomic networks through two types of intrinsic activities. First, the cNTS network generates a tonic background excitatory activity through re-excitatory interconnections between intrinsic neurones, providing a tonic excitatory or inhibitory influence over other nuclei (Fortin & Champagnat, 1993; Kawai & Senba, 1996). Second, this tonic activity is modulated by incoming neural and humoral information resulting in a rapid phasic adaptation of outputs, i.e. classically termed ‘reflex’. The results of this study indicate that extracellular ATP enhances the ‘tonic’ activity maintained by the local network excitation, while suppressing the ‘phasic’ reflex gain through A1 receptor-mediated attenuation of afferent inputs. It has been shown that excitation of the hypothalamic defence area triggers synaptic release of ATP in the cNTS from the hypothalamo-cNTS projection (St Lambert et al. 1997). Other possible sources of ATP in the NTS, such as that released from damaged cells near or upstream of the forth ventricle (Barraco et al. 1991; Inoue, 1998) or that released from astrocytes (Queiroz et al. 1999), remain to be identified in future studies. Considering the fact that the ecto-enzyme chain converting ATP to adenosine in the CNS is inducible under hypoxia (Braun et al. 1998), this differential regulation system in the cNTS provides an important means of optimising the autonomic responses to anomalous changes in the purine concentration in the extracellular milieu under various pathophysiological situations.
Acknowledgments
The authors acknowledge the encouragement by Drs S. Kurihara, M. Kawamura and H. Ono. Technical assistance by Takako Matsuo during experiments and preparation of the manuscript was invaluable. This work was supported by a Grant-in-Aid for Scientific Research (No. 09680773) from the Ministry of Education, Science and Culture, Japan, grants from the Japan Private School Promotion Foundation, grants for Research on Health Sciences focusing on Drug Innovation from The Japan Health Sciences Foundation, a research grant from the Takeda Science Foundation and a supporting grant from The Fujisawa Foundation to F. Kato. E. Shigetomi is a Japan Scholarship Foundation Fellow at the Graduate School of the Science University of Tokyo.
References
- Andresen MC, Kunze DL. Nucleus tractus solitarius - gateway to neural circulatory control. Annual Review of Physiology. 1994;56:93–116. doi: 10.1146/annurev.ph.56.030194.000521. [DOI] [PubMed] [Google Scholar]
- Aylwin ML, Horowitz JM, Bonham AC. NMDA receptors contribute to primary visceral afferent transmission in the nucleus of the solitary tract. Journal of Neurophysiology. 1997;77:2539–2548. doi: 10.1152/jn.1997.77.5.2539. [DOI] [PubMed] [Google Scholar]
- Barnard EA, Simon J, Webb TE. Nucleotide receptors in the nervous system. Molecular Neurobiology. 1997;15:103–130. doi: 10.1007/BF02740631. [DOI] [PubMed] [Google Scholar]
- Barraco RA, Clough-Helfman C, Goodwin BP, Anderson GF. Evidence for presynaptic adenosine A2a receptors associated with norepinephrine release and their desensitization in the rat nucleus tractus solitarius. Journal of Neurochemistry. 1995;65:1604–1611. doi: 10.1046/j.1471-4159.1995.65041604.x. [DOI] [PubMed] [Google Scholar]
- Barraco RA, Helfman CC, Anderson GF. Augmented release of serotonin by adenosine A2a receptor activation and desensitization by CGS 21680 in the rat nucleus tractus solitarius. Brain Research. 1996;733:155–161. doi: 10.1016/0006-8993(96)00279-x. [DOI] [PubMed] [Google Scholar]
- Barraco RA, Walter GA, Polasek PM, Phillis JW. Purine concentrations in the cerebrospinal fluid of unanesthetized rats during and after hypoxia. Neurochemistry International. 1991;18:243–248. doi: 10.1016/0197-0186(91)90191-f. [DOI] [PubMed] [Google Scholar]
- Bisserbe JC, Patel J, Marangos PJ. Autoradiographic localization of adenosine uptake sites in rat brain using [3H]nitrobenzylthioinosine. Journal of Neuroscience. 1985;5:544–550. doi: 10.1523/JNEUROSCI.05-02-00544.1985. [DOI] [PMC free article] [PubMed] [Google Scholar]
- Bonham AC, Coles SK, McCrimmon DR. Pulmonary stretch receptor afferents activate excitatory amino acid receptors in the nucleus tractus solitarii in rats. The Journal of Physiology. 1993;464:725–745. doi: 10.1113/jphysiol.1993.sp019660. [DOI] [PMC free article] [PubMed] [Google Scholar]
- Braun N, Zhu Y, Krieglstein J, Culmsee C, Zimmermann H. Upregulation of the enzyme chain hydrolyzing extracellular ATP after transient forebrain ischemia in the rat. Journal of Neuroscience. 1998;18:4891–4900. doi: 10.1523/JNEUROSCI.18-13-04891.1998. [DOI] [PMC free article] [PubMed] [Google Scholar]
- Castillo-Meléndez M, Krstew E, Lawrence AJ, Jarrot B. Presynaptic adenosine A2a receptors on soma and central terminals of rat vagal afferent neurons. Brain Research. 1994;652:137–144. doi: 10.1016/0006-8993(94)90327-1. [DOI] [PubMed] [Google Scholar]
- Champagnat J, Denavit-Saubié M, Grant K, Shen KF. Organization of synaptic transmission in the mammalian solitary complex, studied in vitro. The Journal of Physiology. 1986;381:551–573. doi: 10.1113/jphysiol.1986.sp016343. [DOI] [PMC free article] [PubMed] [Google Scholar]
- Collo C, North RA, Kawashima E, Merlo-Pich E, Neidhart S, Surprenant A, Buell G. Cloning of P2X5 and P2X6 receptors and the distribution and properties of an extended family of ATP-gated ion channels. Journal of Neuroscience. 1996;16:2495–2507. doi: 10.1523/JNEUROSCI.16-08-02495.1996. [DOI] [PMC free article] [PubMed] [Google Scholar]
- Cunha RA, Brendel P, Zimmermann H, Ribeiro JA. Immunologically distinct isoforms of ecto-5′-nucleotidase in nerve terminals of different areas of the rat hippocampus. Journal of Neurochemistry. 2000;74:334–338. doi: 10.1046/j.1471-4159.2000.0740334.x. [DOI] [PubMed] [Google Scholar]
- Cunha RA, Sebastião AM, Ribeiro JA. Inhibition by ATP of hippocampal synaptic transmission requires localized extracellular catabolism by ecto-nucleotidases into adenosine and channeling to adenosine A1 receptors. Journal of Neuroscience. 1998;18:1987–1995. doi: 10.1523/JNEUROSCI.18-06-01987.1998. [DOI] [PMC free article] [PubMed] [Google Scholar]
- Dale N, Gilday D. Regulation of rhythmic movements by purinergic neurotransmitters in frog embryos. Nature. 1996;383:259–263. doi: 10.1038/383259a0. [DOI] [PubMed] [Google Scholar]
- Doolette DJ. Mechanism of adenosine accumulation in the hippocampal slice during energy deprivation. Neurochemistry International. 1997;30:211–223. doi: 10.1016/s0197-0186(96)00055-1. [DOI] [PubMed] [Google Scholar]
- Dunwiddie TV, Diao L, Proctor WR. Adenine nucleotides undergo rapid, quantitative conversion to adenosine in the extracellular space in rat hippocampus. Journal of Neuroscience. 1997;17:7673–7682. doi: 10.1523/JNEUROSCI.17-20-07673.1997. [DOI] [PMC free article] [PubMed] [Google Scholar]
- Fortin G, Champagnat J. Spontaneous synaptic activities in rat nucleus tractus solitarius neurons in vitro: evidence for re-excitatory processing. Brain Research. 1993;630:125–135. doi: 10.1016/0006-8993(93)90650-c. [DOI] [PubMed] [Google Scholar]
- Fredholm BB, Dunér-Engström M, Fastbom J, Hu PS, van der Ploeg I. Role of G proteins, cyclic AMP, and ion channels in the inhibition of transmitter release by adenosine. Annals of the New York Academy of Sciences. 1990;604:276–288. doi: 10.1111/j.1749-6632.1990.tb32000.x. [DOI] [PubMed] [Google Scholar]
- Fu W-M, Poo M-M. ATP potentiates spontaneous transmitter release at developing neuromuscular synapses. Neuron. 1991;6:837–843. doi: 10.1016/0896-6273(91)90179-4. [DOI] [PubMed] [Google Scholar]
- Geiger JD, Nagy JI. Distribution of adenosine deaminase activity in rat brain and spinal cord. Journal of Neuroscience. 1986;6:2707–2714. doi: 10.1523/JNEUROSCI.06-09-02707.1986. [DOI] [PMC free article] [PubMed] [Google Scholar]
- Gu JG, MacDermott AB. Activation of ATP P2X receptors elicits glutamate release from sensory neuron synapses. Nature. 1997;389:749–753. doi: 10.1038/39639. [DOI] [PubMed] [Google Scholar]
- Inoue K. ATP receptors for the protection of hippocampal functions. Japanese Journal of Pharmacology. 1998;78:405–410. doi: 10.1254/jjp.78.405. [DOI] [PubMed] [Google Scholar]
- Inoue K, Nakazawa K, Fujimori K, Watano T, Takanaka A. Extracellular adenosine 5′-triphosphate-evoked glutamate release in cultured hippocampal neurons. Neuroscience Letters. 1992;134:215–218. doi: 10.1016/0304-3940(92)90520-h. [DOI] [PubMed] [Google Scholar]
- Jo Y-H, Schlichter R. Synaptic corelease of ATP and GABA in cultured spinal neurons. Nature Neuroscience. 1999;2:241–245. doi: 10.1038/6344. [DOI] [PubMed] [Google Scholar]
- Kanjhan R, Housley GD, Burton LD, Christie DL, Kippenberger A, Thorne PR, Luo L, Ryan AF. Distribution of the P2X2 receptor subunit of the ATP-gated ion channels in the rat central nervous system. Journal of Comparative Neurology. 1999;407:11–32. [PubMed] [Google Scholar]
- Kato F. Adenosine 5′-triphosphate induces P2X purinoceptor- and non-NMDA receptor-mediated inward currents of the solitary complex neurons in rat brainstem slice. Society for Neuroscience Abstracts. 1998;24:1601. part 2. [Google Scholar]
- Kawai Y, Senba E. Organization of excitatory and inhibitory local networks in the caudal nucleus of tractus solitarius of rats revealed in in vitro slice preparation. Journal of Comparative Neurology. 1996;373:309–321. doi: 10.1002/(SICI)1096-9861(19960923)373:3<309::AID-CNE1>3.0.CO;2-6. [DOI] [PubMed] [Google Scholar]
- Khakh BS, Henderson G. ATP receptor-mediated enhancement of fast excitatory neurotransmitter release in the brain. Molecular Pharmacology. 1998;54:372–378. doi: 10.1124/mol.54.2.372. [DOI] [PubMed] [Google Scholar]
- Krstew E, Jarrott B, Lawrence AJ. Autoradiographic visualisation of axonal transport of adenosine A1 receptors along the rat vagus nerve and characterisation of adenosine A1 receptor binding in the dorsal vagal complex of hypertensive and normotensive rats. Brain Research. 1998;802:61–68. doi: 10.1016/s0006-8993(98)00567-8. [DOI] [PubMed] [Google Scholar]
- Li C, Peoples RW, Weight FF. Mg2+ inhibition of ATP-activated current in rat nodose ganglion neurons: Evidence that Mg2+ decreases the agonist affinity of the receptor. Journal of Neurophysiology. 1997;77:3391–3395. doi: 10.1152/jn.1997.77.6.3391. [DOI] [PubMed] [Google Scholar]
- MacDermott AB, Role LW, Siegelbaum SA. Presynaptic ionotropic receptors and the control of transmitter release. Annual Review of Neuroscience. 1999;22:443–485. doi: 10.1146/annurev.neuro.22.1.443. [DOI] [PubMed] [Google Scholar]
- Mendoza-Fernandez V, Andrew RD, Barajas-Leópez C. ATP inhibits glutamate synaptic release by acting at P2Y receptors in pyramidal neurons of hippocampal slices. Journal of Pharmacology and Experimental Therapeutics. 2000;293:172–179. [PubMed] [Google Scholar]
- Nabekura J, Ueno S, Ogawa T, Akaike N. Colocalization of ATP and nicotinic ACh receptors in the identified vagal preganglionic neurone of rat. The Journal of Physiology. 1995;489:519–527. doi: 10.1113/jphysiol.1995.sp021069. [DOI] [PMC free article] [PubMed] [Google Scholar]
- Nagata H, Mimori Y, Nakamura S, Kameyama M. Regional and subcellular distribution in mammalian brain of the enzymes producing adenosine. Journal of Neurochemistry. 1984;42:1001–1007. doi: 10.1111/j.1471-4159.1984.tb12703.x. [DOI] [PubMed] [Google Scholar]
- Noden DM. Spatial integration among cells forming the cranial peripheral nervous system. Journal of Neurobiology. 1993;24:248–261. doi: 10.1002/neu.480240210. [DOI] [PubMed] [Google Scholar]
- North RA, Surprenant A. Pharmacology of cloned P2X receptors. Annual Review of Pharmacology and Toxicology. 2000;40:563–580. doi: 10.1146/annurev.pharmtox.40.1.563. [DOI] [PubMed] [Google Scholar]
- Phillis JW, Scislo TJ, O'Leary DS. Purines and the nucleus tractus solitarius: Effects on cardiovascular and respiratory function. Clinical and Experimental Pharmacology and Physiology. 1997;24:738–742. doi: 10.1111/j.1440-1681.1997.tb02124.x. [DOI] [PubMed] [Google Scholar]
- Queiroz G, Meyer DK, Meyer A, Starke K, von Kügelgen I. A study of the mechanism of the release of ATP from rat cortical astroglial cells evoked by activation of glutamate receptors. Neuroscience. 1999;91:1171–1181. doi: 10.1016/s0306-4522(98)00644-7. [DOI] [PubMed] [Google Scholar]
- Ralevic V, Burnstock G. Receptors for purines and pyrimidines. Pharmacological Reviews. 1998;50:413–492. [PubMed] [Google Scholar]
- Robertson SJ, Edwards FA. ATP and glutamate are released from separate neurones in the rat medial habenula nucleus: frequency dependence and adenosine-mediated inhibition of release. The Journal of Physiology. 1998;508:691–701. doi: 10.1111/j.1469-7793.1998.691bp.x. [DOI] [PMC free article] [PubMed] [Google Scholar]
- St Lambert JH, Dashwood MR, Spyer KM. Role of brainstem adenosine A1 receptors in the cardiovascular response to hypothalamic defence area stimulation in the anaesthetized rat. British Journal of Pharmacology. 1996;117:277–282. doi: 10.1111/j.1476-5381.1996.tb15187.x. [DOI] [PMC free article] [PubMed] [Google Scholar]
- St Lambert JH, Thomas T, Burnstock G, Spyer KM. A source of adenosine involved in cardiovascular responses to defense area stimulation. American Journal of Physiology. 1997;272:R195–200. doi: 10.1152/ajpregu.1997.272.1.R195. [DOI] [PubMed] [Google Scholar]
- Salter MW, De Koninck Y, Henry JL. Physiological roles for adenosine and ATP in synaptic transmission in the spinal dorsal horn. Progress in Neurobiology. 1993;41:125–156. doi: 10.1016/0301-0082(93)90006-e. [DOI] [PubMed] [Google Scholar]
- Schmidt C, Bellingham MC, Richter DW. Adenosinergic modulation of respiratory neurones and hypoxic responses in the anaesthetized cat. The Journal of Physiology. 1995;483:769–781. doi: 10.1113/jphysiol.1995.sp020621. [DOI] [PMC free article] [PubMed] [Google Scholar]
- Simpson L, Barraco RA, Phillis JW. A central role for adenosine in the hypotension elicited by hypoxia in anesthetized rats. Brain Research Bulletin. 1989;23:37–40. doi: 10.1016/0361-9230(89)90160-3. [DOI] [PubMed] [Google Scholar]
- Tuyau M, Hansen MA, Coleman MJ, Dampney RAL, Balcar VJ, Bennett MR. Autoradiography of [3H]α,β-methylene-ATP binding sites in medulla oblongata and spinal cord of the rat. Neurochemistry International. 1997;30:159–169. doi: 10.1016/s0197-0186(96)00062-9. [DOI] [PubMed] [Google Scholar]
- Ueno S, Harata N, Inoue K, Akaike N. ATP-gated current in dissociated rat nucleus solitarii neurons. Journal of Neurophysiology. 1992;68:778–785. doi: 10.1152/jn.1992.68.3.778. [DOI] [PubMed] [Google Scholar]
- Virginio C, North RA, Surprenant A. Calcium permeability and block at homomeric and heteromeric P2X2 and P2X3 receptors, and P2X receptors in rat nodose neurones. The Journal of Physiology. 1998;510:27–35. doi: 10.1111/j.1469-7793.1998.027bz.x. [DOI] [PMC free article] [PubMed] [Google Scholar]
- Vulchanova L, Arvidsson U, Riedl M, Wang J, Buell G, Surprenant A, North RA. Differential distribution of two ATP-gated ion channels (P2x receptors) determined by immunocytochemistry. Proceedings of the National Academy of Sciences of the USA. 1996;93:8063–8067. doi: 10.1073/pnas.93.15.8063. [DOI] [PMC free article] [PubMed] [Google Scholar]
- Vulchanova L, Riedl MS, Shuster SJ, Buell G, Surprenant A, North RA, Elde R. Immunohistochemical study of the P2X2 and P2X3 receptor subunits in rat and monkey sensory neurons and their central terminals. Neuropharmacology. 1997;36:1229–1242. doi: 10.1016/s0028-3908(97)00126-3. [DOI] [PubMed] [Google Scholar]
- Zimmermann H. Biochemistry, localization and functional roles of ecto-nucleotidases in the nervous system. Progress in Neurobiology. 1996;49:589–618. doi: 10.1016/0301-0082(96)00026-3. [DOI] [PubMed] [Google Scholar]