

Abstract
The Na+–H+ exchanger NHE3 and the thiazide-sensitive Na+–Cl− cotransporter NCC are the major apical sodium transporters in the proximal convoluted tubule and the distal convoluted tubule of the kidney, respectively. We investigated the mechanism of compensation that allows maintenance of sodium balance in NHE3 knockout mice and in NCC knockout mice.
We used a so-called ‘targeted proteomics’ approach, which profiles the entire renal tubule with regard to changes in Na+ transporter and aquaporin abundance in response to the gene deletions. Specific antibodies to the Na+ transporters and aquaporins expressed along the nephron were utilized to determine the relative abundance of each transporter. Semiquantitative immunoblotting was used which gives an estimate of the percentage change in abundance of each transporter in knockout compared with wild-type mice.
In NHE3 knockout mice three changes were identified which could compensate for the loss of NHE3-mediated sodium absorption. (a) The proximal sodium-phosphate cotransporter NaPi-2 was markedly upregulated. (b) In the collecting duct, the 70 kDa form of the γ-subunit of the epithelial sodium channel, ENaC, exhibited an increase in abundance. This is thought to be an aldosterone-stimulated form of γ-ENaC. (c) Glomerular filtration was significantly reduced.
In the NCC knockout mice, amongst all the sodium transporters expressed along the renal tubule, only the 70 kDa form of the γ-subunit of the epithelial sodium channel, ENaC, exhibited an increase in abundance.
In conclusion, both mouse knockout models demonstrated successful compensation for loss of the deleted transporter. More extensive adaptation occurred in the case of the NHE3 knockout, presumably because NHE3 is responsible for much more sodium absorption in normal mice than in NCC knockout mice.
The rate of sodium excretion by the kidney is the rate of sodium filtration by the glomerulus minus the net rate of sodium reabsorption along the renal tubule. The renal tubule consists of several distinct segments, each with distinct sodium transporters. The sites of expression of the major apical Na+ transporters are summarized in Fig. 1. The predominant apical Na+ transporter in the proximal tubule is NHE3, the type 3 Na+–H+ exchanger (Biemesderfer et al. 1993). In the distal convoluted tubule, the predominant apical Na+ transporter is NCC, the thiazide-sensitive Na+–Cl− cotransporter (Kaplan et al. 1996). The genes for these two transporters have been knocked out in mice as described previously (Schultheis et al. 1998a,b).
Figure 1. Sodium transporter distribution along the nephron.
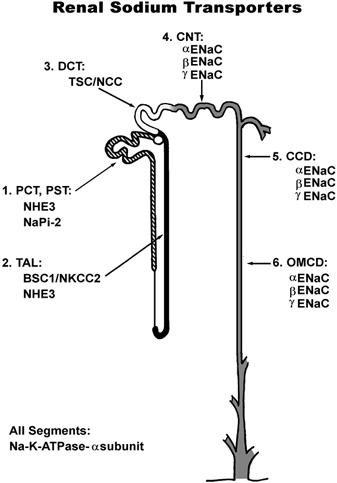
PCT, proximal convoluted tubule; PST, proximal straight tubule; TAL, thick ascending limb; DCT, distal convoluted tubule; CNT, connecting tubule; CCD, cortical collecting duct; OMCD outer medullary collecting duct.
In previous studies (Schultheis et al. 1998a) the most prominent effects in homozygous NHE3 knockout mice were in the gastro-intestinal tract, with dilatation of the small bowel and sustained diarrhoea. These mice exhibited a mild metabolic acidosis and had decreased arterial blood pressure. There was an increase in their circulating aldosterone levels, along with an increase in renin mRNA expression in the kidney. The most prominent effect in homozygous NCC knockout mice was decreased arterial blood pressure when placed on a low salt diet (Schultheis et al. 1998b). In addition, these mice displayed increased renin mRNA levels in the kidney, hypomagnesemia and hypocalciuria. These two knockout models are the focus of the present study.
The other apical Na+ transporters described in Fig. 1 are: (1) NaPi-2, the sodium-phosphate cotransporter expressed in proximal tubule (Biber et al. 1998); (2) NKCC-2, the bumetanide-sensitive Na+-K+-2Cl− cotransporter expressed in the thick ascending limb of Henle's loop (Kaplan et al. 1996); and (3) ENaC, the amiloride-sensitive Na+ channel of the connecting tubule and the collecting duct, consisting of α-, β- and γ-subunits (Garty & Palmer, 1997). The major basolateral sodium transporter is the same in all segments, the Na+-K+-ATPase, which in the kidney consists of a complex of α1 and β1 subunit proteins (Lingrel et al. 1994). The Na+-K+-ATPase is the primary active transporter responsible for the maintenance of low intracellular sodium concentration and a negative intracellular electrical potential in all renal tubule epithelial cells. The electrochemical driving force for apical sodium entry through the various apical Na+ transporters described above is generated by the Na+-K+-ATPase in each segment.
The cDNAs encoding the apical Na+ transporters described in Fig. 1 have been cloned, allowing the production of peptide-directed rabbit polyclonal antibodies to each (Fernandez-Llama et al. 1998; Kim et al. 1998, 1999, 2000; Masilamani et al. 1999). This ensemble of antibodies has allowed the development of a so-called ‘targeted proteomics’ approach (Masilamani et al. 1999; Kim et al. 2000) to the analysis of renal adaptation. This approach profiles the entire renal tubule with regard to changes in apical Na+ transporter and aquaporin abundance in response to specific systemic physiological perturbations. Here we use this transporter-profiling approach to investigate the mechanism of compensation that allows maintenance of sodium balance in the NHE3 and NCC knockout mice. We hypothesize that the deletion of an individual sodium transporter will result in compensatory increases in abundance of one or more of the remaining Na+ transporters.
In NHE3 knockout mice three changes were identified which could compensate for the loss of NHE3-mediated sodium absorption. (a) The proximal sodium-phosphate cotransporter NaPi-2 was markedly upregulated. (b) In the collecting duct, the 70 kDa form of the γ-subunit of the epithelial sodium channel, ENaC, exhibited an increase in abundance. (c) Glomerular filtration was significantly reduced.
In the NCC knockout mice, amongst all the sodium transporters expressed along the renal tubule, only the 70 kDa form of the γ-subunit of the epithelial sodium channel, ENaC, exhibited an increase in abundance.
METHODS
Animals
Homozygous NHE3 (Schultheis et al. 1998a) and NCC (Schultheis et al. 1998b) knockout mice were used for this study. These mice and their wild-type littermates were maintained on a normal sodium replete diet (Harlan-Teklad TD 90220) and tap water ad libitum. All experiments were carried out according to the guidelines laid down by the University of Cincinnati Animal Care and Use Committee.
Antibodies
We utilized rabbit polyclonal antibodies to the following renal sodium transporters: the type 2 sodium-phosphate cotransporter (NaPi-2) of the proximal tubule (Kim et al. 2000), the type 3 Na+–H+ exchanger (NHE3) of the proximal tubule (Fernandez-Llama et al. 1998), the Na+-K+-2Cl− cotransporter (NKCC-2) of the thick ascending limb (Kim et al. 1999), the thiazide-sensitive Na+–Cl− cotransporter (NCC) of the distal convoluted tubule (Kim et al. 1998), and all three subunits of the epithelial Na+ channel (ENaC) of the collecting duct (Masilamani et al. 1999), aquaporin-1 (Terris et al. 1996), aquaporin-2 (DiGiovanni et al. 1994) and aquaporin-3 (Ecelbarger et al. 1995). Each antiserum was affinity purified on a maleimide-activated agarose bead column (Immobilization kit 2; Pierce Chemical Co., Rockford, IL, USA), to which 2 mg of the relevant synthetic peptide was immobilized by covalent linkage.
A mouse monoclonal antibody specific to the Na+-K+-ATPase α1 subunit was obtained from a commercial source (Upstate Biotechnology, Lake Placid, NY, USA) and used for immunoblotting.
Sample preparation, SDS-PAGE electrophoresis and immunoblotting
Whole kidneys were homogenized in 1 ml of ice-cold isolation solution (250 mm sucrose, 10 mm triethanolamine, pH 7.6, containing 1 μg ml−1 leupeptin and 0.1 mg ml−1 phenylmethylsulphonyl fluoride) using a tissue homogenizer (Omni 1000 fitted with a micro-sawtooth generator) at maximum speed for three 15 s intervals. Total protein concentrations were measured (BCA kit; Pierce Chemical Co.) and the samples were solubilized in Laemmli sample buffer, at 60 oC for 15 min.
Semi-quantitative immunoblotting was carried out as previously described (Terris et al. 1996) in order to assess the relative abundances of the proteins of interest. To confirm that protein loading of the gels was equal, preliminary 12 % polyacrylamide gels were stained with Coomassie Blue, as previously described (Terris et al. 1996). Densitometry (Personal Densitometer SI, Molecular Dynamics, San Jose, CA, USA) was performed on representative bands to ensure that the loading of the gels did not differ by more than 10 % of the mean.
Proteins were separated on 7.5, 10 or 12 % polyacrylamide gels by sodium dodecyl sulphate-polyacrylamide gel electrophoresis (SDS-PAGE) and the proteins were transferred to nitrocellulose membranes electrophoretically (BioRad Mini Trans-Blot Cell). Membranes were blocked for 1 h at room temperature with 5 % non-fat dried milk and probed overnight at 4 oC with the respective primary antibodies. Membranes were washed and exposed to secondary antibodies (goat anti-rabbit IgG conjugated to horseradish peroxidase, Pierce no. 31463; rabbit anti-mouse IgG conjugated to horseradish peroxidase, Pierce no. 31450, both diluted to 1:5000) for 1 h at room temperature. After washing, bands were visualized using a luminol-based enhanced chemiluminescence substrate (LumiGLO, Kirkegaard and Perry Laboratories, Gaithersburg, MD, USA). Band densities were determined by laser densitometry (Personal Densitometer SI, Molecular Dynamics, San Jose, CA, USA).
Measurement of glomerular filtration rate
Male mice of each genotype weighing between 30 and 40 g were prepared according to conventional techniques modified for use in the mouse as previously described (Lorenz & Gruenstein, 1999). Mice were anaesthetized with separate intraperitoneal injections of ketamine (50 μg (g body wt)−1) and thiobutabarbital (Inactin, Research Biochemicals International, Natick, MA, USA; 100 μg (g body wt)−1), and placed on a thermally controlled surgical table. Following tracheostomy, the right femoral artery and vein were cannulated with polyethylene tubing hand-drawn to a fine tip over a flame (o.d. 0.3-0.5 mm). The arterial catheter was connected to a COBE CDXIII fixed-dome pressure transducer (COBE Cardiovascular, Arvada, CO, USA) for measurement of arterial blood pressure, and the venous catheter was connected to a syringe pump for infusion. The bladder was also cannulated with flared PE-10 tubing for the collection of urine. Blood pressure and heart rate were monitored throughout the experiment using a MacLab data acquisition system (AD Instruments, Boston, MA, USA) with a sampling rate of 200 samples s−1. Body temperature was maintained at 37.5 oC. A 2 μl (g body wt)−1 bolus infusion of isotonic phosphate-buffered saline containing 1.0 g (100 ml)−1 of FITC-inulin (Sigma) was then administered, followed by a maintenance infusion of the same solution at 0.15 μl min−1 (g body wt)−1 for the remainder of the experiment.
After a 30-45 min equilibration period, two consecutive 30 min urine collections were performed. Urine was collected into pre-weighed polyethylene vials, and a 40 μl blood sample was taken at the midpoint of each collection. For the determination of glomerular filtration rate, FITC-inulin concentrations in urine and plasma were measured by diluting 3 μl of sample into 197 μl of 10 mm Hepes buffer at pH 7.4 in 96-well microplates. The fluorescence was then measured at an excitation wavelength of 485 nm and emission wavelength of 538 nm using a Fluoroskan II fluorescence microplate reader.
At the end of the experiment 200 μl of blood was drawn for the measurement of plasma electrolyte concentrations, osmolality, blood gases and haematocrit. Sodium and potassium concentrations were measured in 4 μl samples by flame photometry (Corning Model 480 Flame Photometer, Medfield, MA, USA). Osmolality was measured by freezing point depression in 10 μl samples using a Fiske 110 osmometer (Fiske Associates, Norwood, MA, USA). Samples of whole blood were also analysed for PO2, PCO2, pH, haematocrit, sodium, potassium, chloride and bicarbonate using a Chiron Model 384 blood gas analyser (Chiron Diagnostics, Norwood, MA, USA).
RESULTS
NHE3 knockout mice
Plasma composition and blood pressure
The NHE3 knockout mice have been described in previous papers (Schultheis et al. 1998a; Lorenz et al. 1999; Wang et al. 1999). The observations are consistent with the view that the NHE3 knockout mice have sustained extracellular fluid volume depletion, presumably due to their observed diarrhoea. Plasma composition and blood pressure in the present studies confirm this general picture (Table 1). In the NHE3 knockout mice, there was a decrease in arterial blood pressure, an increase in plasma potassium concentration, and decreases in plasma bicarbonate concentration and pH.
Table 1.
Physiological measurements
| NHE3−/− | NHE+/+ | |
|---|---|---|
| Blood pressure (mmHg) | 92 ± 3 | 83 ± 2* |
| Heart rate (beats min-1) | 393 ± 15 | 367 ± 18 |
| Plasma Na+ (mequivl−1) | 151 ± 1 | 151 ± 1 |
| Plasma K+ (mequivl−1) | 4.66 ± 0.09 | 5.33 ± 0.17* |
| Plasma Cl− (mequivl−1) | 119 ± 1 | 121 ± 1 |
| Plasma osmolality (mosmolkg−1) | 330 ± 3 | 330 ± 2 |
| pH | 7.33 ± 0.01 | 7.27 ± 0.02* |
| Plasma HCO3 (mequivl−1) | 24.2 ± 0.6 | 21.1 ± 0.9* |
| Vurine (μl min−1) | 1.71 ± 0.22 | 1.18 ± 0.12* |
| UNaV (μequiv min−1) | 0.276 ± 0.084 | 0.069 ± 0.011* |
| UKV (μequiv min−1) | 0.496 ± 0.054 | 0.295 ± 0.037* |
| UosmV (μosmol min−1) | 3.23 ± 0.35 | 2.34 ± 0.2* |
Values are means ±s.e.m. from 11 NHE3+/+ and 12 NHE3−/− anaesthetized mice.
Significantly different from wild-type (P < 0.05 by ANOVA). UNa is urine Na+ concentration, UK is urine K+ concentration and Uosm is urine osmolality.
Abundance of apical sodium transporter and sodium channel proteins
Figure 2 shows immunoblots of whole kidney samples from wild-type and knockout mice for all of the Na+ transporters shown in Fig. 1. Immunoblotting confirmed the absence of NHE3 protein in the knockout mice. A significant increase was seen for the type 2 sodium-phosphate co-transporter of the proximal tubule, NaPi-2 (345 %± 52 % compared with 100 %± 14 % in wild-type kidneys, P < 0.05). γ-ENaC is known to exist in the kidney as two polypeptides, one at 85 kDa and the other at 70 kDa. The combined densities of these two γ-ENaC bands were decreased in knockout mice (22 %± 7 % compared with wild-type, 100 %± 4 %, P < 0.05). However, as shown in Fig. 2, there was an increase in the density of the 70 kDa γ-ENaC band in the knockout mice (177 %± 36 % compared with 100 %± 7 % in wild-type kidneys, P < 0.05). A previous study in rats demonstrated that this 70 kDa band is induced by aldosterone (Masilamani et al. 1999). This 70 kDa ENaC form has been proposed to form endogenously through the action of an aldosterone induced extracellular protease associated with activation of the channel (Masilamani et al. 1999).
Figure 2. Abundance of sodium transporters in whole kidney homogenates of NHE3 null and wild-type mice.
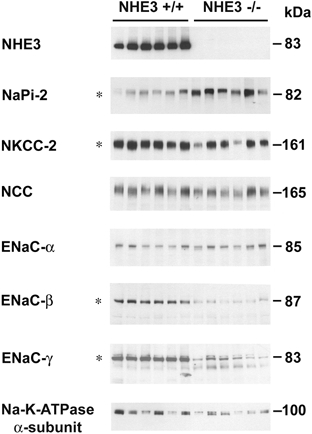
Immunoblot of whole kidney homogenates from wild-type and NHE3 null mice. Each lane was loaded with a protein sample from a different mouse. Equal loading was confirmed via parallel Coomassie stained gels. * indicates differences in protein abundance levels which were statistically significant between wild-type and knockout mice (P < 0.05).
β-ENaC subunit levels were significantly decreased in the NHE3 knockout mice (9 %± 2 % compared with the level in whole kidneys from wild-type mice, 100 %± 12 %, P < 0.05) and there was a decrease in the abundance of the Na+-K+-2Cl− cotransporter of the thick ascending limb, NKCC-2 (45 %± 15 % compared with 100 %± 17 % in wild-type mice kidneys, P < 0.05). No change was observed in the abundance of NCC, or in the α-subunit of ENaC (the amiloride-sensitive sodium channel of the collecting duct).
To confirm the increase in NaPi-2 abundance, we repeated the NaPi-2 immunoblotting in samples from an additional set of animals (Fig. 3). Again, NaPi-2 band density was markedly increased in the NHE3 knockout mice (276 %± 42 % compared with the wild-type level of 100 %± 8 %, P < 0.05). This observation was also confirmed in a third set of animals (results not shown).
Figure 3. Abundance of NaPi-2 in whole kidney homogenates of NHE3 null and wild-type mice.

Immunoblot of whole kidney homogenates from 3 wild-type and 3 NHE3 null mice. Each lane was loaded with a protein sample from a different mouse, and 20 μg of whole kidney protein were run for each sample. NaPi-2 abundance was significantly increased in knockout mice (276 %± 42 % compared with the wild-type level of 100 %± 8 %, P < 0.05).
Aquaporin proteins in NHE3 knockout mice
Figure 4 shows the immunoblots for aquaporin-1, -2 and -3, using the same whole kidney samples employed for Fig. 2. No significant changes in abundance between the wild-type and knockout mice were observed.
Figure 4. Abundance of aquaporin-1, -2 and -3 in whole kidney homogenates of NHE3 null and wild-type mice.

Immunoblot of whole kidney homogenates from wild-type and NHE3 null mice. Each lane was loaded with a protein sample from a different mouse. No significant differences in any transporter abundance levels were observed between wild-type and knockout mice.
Measurement of glomerular filtration rate
Figure 5 shows the direct measurements of glomerular filtration rate (GFR) by inulin clearance. There was a statistically significant 26 % decrease in mean GFR in NHE3 knockout mice (P < 0.05).
Figure 5. Whole kidney glomerular filtration rate measured in NHE3 null and wild-type mice.

Direct measurements of GFR by inulin clearance. *P < 0.05 compared with NHE3+/+ mice. Bars are ±s.e.m.
NCC knockout mice
Abundance of apical sodium transporter and channel proteins
Figure 6 shows immunoblots of whole kidney samples from wild-type and NCC knockout mice for all of the Na+ transporters shown in Fig. 1. Immunoblotting confirmed the absence of NCC protein in the knockout mice. No significant changes in band density were seen for NHE3, NaPi-2, NKCC-2, α-ENaC or β-ENaC. However, as seen in the NHE3 knockout mice, there was an increase in the density of the 70 kDa γ-ENaC band (401 %± 45 % compared with the wild-type level of 100 %± 17 %, P < 0.05).
Figure 6. Abundance of sodium transporters in whole kidney homogenates of NCC null and wild-type mice.

Immunoblot of whole kidney homogenates from wild-type and NCC null mice. Each lane was loaded with a protein sample from a different mouse. * indicates differences in protein abundance levels which were statistically significant between wild-type and knockout mice (P < 0.05).
Aquaporin proteins in NCC null mice
Figure 7 shows the immunoblots for aquaporin-1, -2 and -3, using the same whole kidney samples employed for Fig. 6. No significant changes in abundance between the wild-type and knockout mice were observed.
Figure 7. Abundance of aquaporin-1, -2 and -3 in whole kidney homogenates of NCC null and wild-type mice.

Immunoblot of whole kidney homogenates from wild-type and NCC null mice. Each lane was loaded with a protein sample from a different mouse. No significant differences in any transporter abundance levels were observed between wild-type and knockout mice.
DISCUSSION
We hypothesized that a deletion of individual renal sodium transporters may result in compensatory increases in the abundance of other sodium transporters to maintain sodium balance. We approached this question using a Na+ transporter profiling technique in which specific antibodies to the major apical Na+ transporters and channels expressed along the nephron were utilized to determine their relative abundance. Semiquantitative immunoblotting was used which gives an estimate of the percentage change of each transporter abundance in knockout compared with wild-type mice. In the NHE3 knockout mice, an increase in NaPi-2 abundance was seen which could provide part of the compensation for the loss of NHE3. In addition, the abundance of the 70 kDa isoform of γ-ENaC was increased. The glomerular filtration rate of the knockout mice was decreased by about one third, which presumably accounted for a large part of the compensation. The abundances of NKCC-2 and β-ENaC decreased, contrary to the hypothesis.
In contrast, in the NCC knockout mice, an increase was seen only in the abundance of the 70 kDa isoform of γ-ENaC, which is thought to be induced by aldosterone and to correlate with an increase in ENaC activity in the collecting duct. The significance of these findings is discussed in greater detail in the remainder of this discussion.
Compensation in NHE3 null mice
Based on previous micropuncture experiments, NHE3 mediates the absorption of at least 40 % of the filtered load of sodium (Wang et al. 1999). If the knockout of NHE3 resulted in losses of sodium that were equal to the sodium normally absorbed, the result would be rapid volume depletion and death. The survival of these animals bespeaks success in attaining sodium balance. In micropuncture studies (Lorenz et al. 1999; Schnermann, 2000), it was demonstrated that this success is largely due to a fall in single nephron glomerular filtration rate of superficial nephrons. Because of the fall in single nephron GFR a marked fall in proximal sodium absorption did not result in a significant change in the rate of sodium delivery to the distal tubule. The authors attributed an observed decrease in single nephron GFR to activation of the tubulo-glomerular feedback mechanism. In the present study we show that there is a decrease in whole kidney GFR, suggesting that the decrease in GFR is not confined to the superficial nephrons.
In addition to the decrease in GFR in the NHE3 knockout mice, there were two additional compensatory changes, namely a large increase in the abundance of the sodium-phosphate cotransporter of the proximal tubule, and an increase in the 70 kDa isoform of γ-ENaC. Although large, the degree of compensation afforded by this increase in NaPi-2 would be expected to be partial, owing to the low filtered load of inorganic phosphate relative to sodium. In previous studies several factors have been identified which regulate NaPi-2 abundance in the proximal tubule. In animal studies, chronic dietary phosphate deprivation (Collins et al. 1995) and metabolic alkalosis (Kim et al. 2000) were found to increase NaPi-2 abundance. Glucocorticoids (Guner et al. 1999), parathyroid hormone (Traebert et al. 2000), excess dietary phosphate (Keusch et al. 1998) and metabolic acidosis (Kim et al. 2000) reduce NaPi-2 abundance. These NHE3 knockout animals manifest metabolic acidosis (Table 1), ruling out acid-base state as a cause of increased NaPi-2 abundance. Changes in the other potential regulatory factors have not been reported in NHE3 knockout mice. Elimination of NHE3 activity would be expected to increase the driving force for sodium entry into the proximal tubule cells via other pathways, including NaPi-2, in part by reducing intracellular sodium concentration. This would partially compensate for a loss of NHE3 in proximal tubule sodium absorption without the requirement of a change in transporter protein abundance.
The abundance of the 70 kDa γ-ENaC isoform was observed to increase in the NHE3 knockout mice (Fig. 2). This is thought to be indicative of increased aldosterone action (Masilamani et al. 1999). This would be expected to result in an increase in sodium absorption in the collecting duct and connecting tubule. Plasma aldosterone levels were increased in NHE3 knockout mice on a normal diet (Schultheis et al. 1998a). The amiloride-sensitive short circuit current in the distal colon was increased in the NHE3 knockout mice (Schultheis et al. 1998a), consistent with activation of ENaC. Another aldosterone target is Na+-K+-ATPase (Garg et al. 1981) whose activity is markedly increased in the connecting tubule and collecting duct, presumably as a result of increased gene expression. However, Na+-K+-ATPase is expressed in all nephron segments including those that are not aldosterone responsive. In the present study we did not observe an overall increase in the abundance of Na+-K+-ATPase presumably because the amount of this protein in the aldosterone-responsive collecting duct and connecting tubule is small compared with the total in the whole kidney.
We found that the total amounts of β- and γ-ENaC subunit proteins are markedly decreased in the NHE3 knockout mice. β- and γ-ENaC subunits normally exist in great excess relative to the α-subunit in the collecting duct principal cells (Masilamani et al. 1999). Therefore, a reduction in β- and γ-ENaC subunit abundances would not necessarily result in a decrease in the quantity of the fully assembled, functional α-β-γ-ENaC complex. A recent study in rats showed that acid loading was associated with a decreased abundance of β- and γ-ENaC (Kim et al. 2000). Thus, we presume that the decreases in β- and γ-ENaC abundance relate to the mild metabolic acidosis seen in the NHE3 knockout mice. The observed decrease in NKCC-2 abundance in the NHE3 knockout mice is unexplained based on current knowledge regarding the regulation of these transporters.
Compensation in NCC null mice
NCC is responsible for at least 3 % of the filtered load of sodium (Ellison et al. 1987), compared with the 40 % attributable to NHE3. Thus it is not surprising that the changes in Na+ transporter protein abundance are less extensive in the NCC knockout mice than in the NHE3 knockout mice. Nevertheless, if the NCC knockout mice on a normal diet excreted 3 % of the filtered load of sodium due to the lack of NCC, then progressive volume depletion and death would result. The survival of the NCC knockout mice showed that they were able to establish sodium balance, although perhaps with some reduction in extracellular fluid volume as suggested by an increase of renin mRNA in the renal cortex (Schultheis et al. 1998b). The adaptation to the loss of NCC appears to involve an increase in the abundance of the 70 kDa isoform of the γ-ENaC subunit (Fig. 6) suggesting that there may be increased sodium absorption in the collecting duct of the NCC knockout mice. Based on previous observations the appearance of this 70 kDa band could be indicative of increased aldosterone action in the collecting duct (Masilamani et al. 1999), although measurements in a previous study did not document a rise in plasma aldosterone level in the NCC knockout mice.
We emphasize that compensatory increases in Na+ absorption may have occurred in segments other than the distal convoluted tubule as a result of changes that would not ordinarily be detectable by immunoblotting, such as trafficking, phosphorylation, protein-protein interactions or altered driving forces for Na+ movement.
Acknowledgments
Funding for this study was derived from the intramural budget of the National Heart Lung and Blood Institute (National Institutes of Health, project no. Z01-HL-01282-KE to M. A. Knepper), from NIH grant DK50594 awarded to G. E. Shull, and from NIH grant RO1-DK57552 awarded to J. N. Lorenz.
References
- Biber J, Murer H, Forster I. The renal type II Na+/phosphate cotransporter. Journal of Bioenergetics and Biomembranes. 1998;30:187–194. doi: 10.1023/a:1020525409894. [DOI] [PubMed] [Google Scholar]
- Biemesderfer D, Pizzonia J, Abu-Alfa A, Exner M, Reilly R, Igarashi P, Aronson PS. NHE3: a Na+/H+ exchanger isoform of renal brush border. American Journal of Physiology. 1993;265:F736–742. doi: 10.1152/ajprenal.1993.265.5.F736. [DOI] [PubMed] [Google Scholar]
- Collins JF, Bulus N, Ghishan FK. Sodium-phosphate transporter adaptation to dietary phosphate deprivation in normal and hypophosphatemic mice. American Journal of Physiology. 1995;268:G917–924. doi: 10.1152/ajpgi.1995.268.6.G917. [DOI] [PubMed] [Google Scholar]
- DiGiovanni SR, Nielsen S, Christensen EI, Knepper MA. Regulation of collecting duct water channel expression by vasopressin in Brattleboro rat. Proceedings of the National Academy of Sciences of the USA. 1994;91:8984–8988. doi: 10.1073/pnas.91.19.8984. [DOI] [PMC free article] [PubMed] [Google Scholar]
- Ecelbarger CA, Terris J, Frindt G, Echevarria M, Marples D, Nielsen S, Knepper MA. Aquaporin-3 water channel localization and regulation in rat kidney. American Journal of Physiology. 1995;269:F663–672. doi: 10.1152/ajprenal.1995.269.5.F663. [DOI] [PubMed] [Google Scholar]
- Ellison DH, Velazquez H, Wright FS. Thiazide-sensitive sodium chloride cotransport in early distal tubule. American Journal of Physiology. 1987;253:F546–554. doi: 10.1152/ajprenal.1987.253.3.F546. [DOI] [PubMed] [Google Scholar]
- Fernandez-Llama P, Andrews P, Ecelbarger CA, Nielsen S, Knepper MA. Concentrating defect in experimental nephrotic syndrome: Altered expression of aquaporins and thick ascending limb Na+ transporters. Kidney International. 1998;54:170–179. doi: 10.1046/j.1523-1755.1998.00984.x. [DOI] [PubMed] [Google Scholar]
- Garg LC, Knepper MA, Burg MB. Mineralocorticoid effects on Na-K-ATPase in individual nephron segments. American Journal of Physiology. 1981;240:F536–544. doi: 10.1152/ajprenal.1981.240.6.F536. [DOI] [PubMed] [Google Scholar]
- Garty H, Palmer LG. Epithelial sodium channels: function, structure, and regulation. Physiological Reviews. 1997;77:359–396. doi: 10.1152/physrev.1997.77.2.359. [DOI] [PubMed] [Google Scholar]
- Guner YS, Kiela PR, Xu H, Collins JF, Ghishan FK. Differential regulation of renal sodium-phophate transporter by glucocorticoids during rat ontogeny. American Journal of Physiology. 1999;277:C884–890. doi: 10.1152/ajpcell.1999.277.5.C884. [DOI] [PubMed] [Google Scholar]
- Kaplan MR, Mount DB, Delpire E. Molecular mechanisms of NaCl cotransport. Annual Review of Physiology. 1996;58:649–668. doi: 10.1146/annurev.ph.58.030196.003245. [DOI] [PubMed] [Google Scholar]
- Keusch I, Traebert M, Lotscher M, Kaissling B, Murer H, Biber J. Parathyroid hormone and dietary phosphate provoke a lysosomal routing of the proximal tubular Na/Pi contransporter type II. Kidney International. 1998;54:1224–1232. doi: 10.1046/j.1523-1755.1998.00115.x. [DOI] [PubMed] [Google Scholar]
- Kim G-H, Ecelbarger CA, Mitchell C, Packer RK, Wade JB, Knepper MA. Vasopressin increases Na-K-2Cl cotransporter expression in thick ascending limb of Henle's loop. American Journal of Physiology. 1999;276:F96–103. doi: 10.1152/ajprenal.1999.276.1.F96. [DOI] [PubMed] [Google Scholar]
- Kim G-H, Martin SW, Fernandez-Llama P, Masilamani S, Packer RK, Knepper MA. Long-term regulation of sodium-dependent cotransporters and ENaC in rat kidney: response to altered acid-base intake. American Journal of Physiology, Renal Physiology. 2000;279:F459–467. doi: 10.1152/ajprenal.2000.279.3.F459. [DOI] [PubMed] [Google Scholar]
- Kim G-H, Masilamani S, Turner R, Mitchell C, Wade JB, Knepper MA. The thiazide-sensitive Na-Cl cotransporter is an aldosterone-induced protein. Proceedings of the National Academy of Sciences of the USA. 1998;95:14552–14557. doi: 10.1073/pnas.95.24.14552. [DOI] [PMC free article] [PubMed] [Google Scholar]
- Lingrel JB, Van Huysse J, O'Brien W, Jewell-Motz E, Askew R, Schultheis P. Structure-function studies of the Na,K-ATPase. Kidney International. 1994;44:S32–39. [PubMed] [Google Scholar]
- Lorenz JN, Gruenstein E. A simple, nonradioactive method for evaluating single-nephron filtration rate using FITC-inulin. American Journal of Physiology. 1999;276:F172–177. doi: 10.1152/ajprenal.1999.276.1.F172. [DOI] [PubMed] [Google Scholar]
- Lorenz JN, Schultheis PJ, Traynor T, Shull GE, Schnermann J. Micropuncture analysis of single-nephron function in NHE3-deficient mice. American Journal of Physiology. 1999;277:F447–453. doi: 10.1152/ajprenal.1999.277.3.F447. [DOI] [PubMed] [Google Scholar]
- Masilamani S, Kim G-H, Mitchell C, Wade JB, Knepper MA. Aldosterone-mediated regulation of ENaC α, β, and γ subunit proteins in rat kidney. Journal of Clinical Investigation. 1999;104:R19–23. doi: 10.1172/JCI7840. [DOI] [PMC free article] [PubMed] [Google Scholar]
- Schnermann J. NaCl transport deficiencies - hemodynamics to the rescue. Pflügers Archiv. 2000;439:682–690. doi: 10.1007/s004240000258. [DOI] [PubMed] [Google Scholar]
- Schultheis P, Clarke LL, Meneton P, Miller ML, Soleimani M, Gawenis LR, Riddle TM, Duffy JJ, Doetschman T, Wang T, Giebisch G, Aronson PS, Lorenz JN, Shull GE. Renal and intestinal absorptive defects in mice lacking the NHE3 Na+/H+ exchanger. Nature Genetics. 1998a;19:282–285. doi: 10.1038/969. [DOI] [PubMed] [Google Scholar]
- Schultheis PJ, Lorenz JN, Meneton P, Nieman ML, Riddle TM, Flagella M, Duffy JJ, Doetschman T, Miller ML, Shull GE. Phenotype resembling Gitelman's syndrome in mice lacking the apical Na+–Cl− cotransporter of the distal convoluted tubule. Journal of Biological Chemistry. 1998b;273:29150–29155. doi: 10.1074/jbc.273.44.29150. [DOI] [PubMed] [Google Scholar]
- Terris J, Ecelbarger CA, Nielsen S, Knepper MA. Long-term regulation of four renal aquaporins in rat. American Journal of Physiology. 1996;271:F414–422. doi: 10.1152/ajprenal.1996.271.2.F414. [DOI] [PubMed] [Google Scholar]
- Traebert M, Roth J, Biber J, Murer H, Kaissling B. Internalization of proximal tubular type II Na-Pi cotransporter by PTH:immunogold electron microscopy. American Journal of Physiology Renal Physiology. 2000;278:F148–154. doi: 10.1152/ajprenal.2000.278.1.F148. [DOI] [PubMed] [Google Scholar]
- Wang T, Yang C-L, Abbiati T, Schultheis PJ, Shull GE, Giebisch G, Aronson PS. Mechanism of proximal tubule bicarbonate absorption in NHE3 null mice. American Journal of Physiology. 1999;277:F298–302. doi: 10.1152/ajprenal.1999.277.2.F298. [DOI] [PubMed] [Google Scholar]