

Abstract
The effect of cardiac hypertrophy on electrocardiogram (ECG), action potential duration (APD) and repolarizing K+ currents was investigated in epicardial, midmyocardial and endocardial myocytes isolated from the rat left ventricular free wall.
Cardiac hypertrophy was induced by stenosis of the ascending aorta (AS), which led to an increased pressure load (+85 ± 10 mm) of the left ventricle; sham-operated animals served as controls.
In ECG recordings from AS rats, the QTc interval was prolonged and the main vectors of the QRS complex and the T-wave pointed in opposite directions, indicating an abnormal sequence of repolarization.
APD and K+ currents were recorded using the whole-cell patch-clamp technique. In the AS group, APD90 (90 % repolarization) was significantly prolonged in epicardial and midmyocardial, but not endocardial myocytes.
Corresponding to the increase in APD, the magnitude of the transient outward K+ current (Ito1) was significantly smaller (-30 %) in epicardial and midmyocardial, but not endocardial myocytes.
Inactivation and steady-state inactivation of Ito1 were not affected by hypertrophy. Recovery from inactivation was slightly prolonged in endocardial myocytes from AS rats.
No differences in delayed rectifier currents (IK) or inwardly rectifying K+ currents (IK1) were detected between myocytes of the three regions of sham-operated or AS animals. However, both currents were reduced by AS.
The present data show that cardiac hypertrophy caused by pressure overload leads to an increase in APD and a decrease in Ito1 primarily in epicardial and midmyocardial myocytes, which implies a major role of alterations in Ito1 for the reduced gradient in APD. The effects of AS on IK1 and IK may slightly counteract the decrease in APD gradient. The observed changes in APD and underlying ionic currents could well explain the alterations in repolarization observed in the ECG induced by cardiac hypertrophy.
During normal cardiac cycles, the wave of excitation travels from endocardial to epicardial regions. Due to the shorter action potential duration (APD) in epicardial myocytes (Solberg et al. 1974), they repolarize earlier and thus repolarization of the ventricle travels in the opposite direction from epicardial to endocardial regions. These differences in APD are responsible for the fact that in the normal heart the main vector of the T-wave in the electrocardiogram (ECG) points in the same direction as the main vector of the QRS complex (Cohen et al. 1976; Franz et al. 1987).
Recently, studies investigating the regional distribution of ionic currents underlying the ventricular action potential (AP) in normal hearts have identified inhomogeneities in the distribution of repolarizing currents among the ventricular wall, which could account for the gradient in APD. In several species including dog (Litovsky & Antzelevitch, 1988), rat (Clark et al. 1993; Shimoni et al. 1995; Volk et al. 1999), and rabbit (Fedida & Giles, 1991), as well as in humans (Wettwer et al. 1994; Näbauer et al. 1996), the Ca2+-independent transient outward K+ current (Ito1) has been found to be significantly smaller in endocardial than in epicardial regions. Additionally, in dogs and ferrets, differences in the distribution of delayed rectifier (IK) and inward rectifier (IK1) currents have been described (Liu & Antzelevitch, 1995; Liu et al. 1993).
Cardiac hypertrophy is associated with several changes in cellular electrophysiology. A prolongation of the AP has commonly been observed in various animal models and in humans (for review, see Wickenden et al. 1998). Little is known, however, about the effect of cardiac hypertrophy on the regional distribution of APD. Recently, Shipsey et al. (1997) demonstrated that cardiac hypertrophy causes a more pronounced increase of APD in myocytes from epicardial than in those from endocardial layers of the rat left ventricular free wall, and suggested that these regional changes in APD may be responsible for the changes in ECG observed in hypertrophy. The ionic basis underlying these selective changes in APD is still a matter of debate. A number of studies suggested a potential role of a decrease in Ito1 for the AP prolongation in cardiac hypertrophy of different origin, including abdominal ligation of the aorta (Tomita et al. 1994), or treatment with catecholamines (Mészáros et al. 1996; Bryant et al. 1999), deoxycorticosterone acetate (Coulombe et al. 1994), or growth hormone (Xu & Best, 1991), and in spontaneously hypertensive rats (Cerbai et al. 1994). The present study was therefore undertaken to further elucidate regional effects of cardiac hypertrophy on APD and underlying ionic currents. Cardiac hypertrophy was induced in rats by clipping of the proximal aorta and thus generating an increase in afterload. ECGs were recorded before and after development of hypertrophy. Using the whole-cell patch-clamp technique, APs and repolarizing ionic currents were recorded from myocytes isolated from endocardial, midmyocardial and epicardial layers of hypertrophied hearts and compared with results obtained from sham-operated animals.
METHODS
Induction of ascending aortic stenosis
Ascending aortic stenosis (AS) was induced as described previously (Wiesner et al. 1994, 1997). Briefly, female Sprague-Dawley rats weighing 180-190 g were anaesthetized by i.p. injection of Ketamin-HCl/Xylazin-HCl (100/4 mg (kg body wt)−1, respectively), intubated and mechanically ventilated. The ascending aorta was partially occluded by a haemoclip (Pilling Weck Inc., Research Triangle Park, NC, USA) set to an outer diameter of 0.85 mm. In sham-operated animals, the aortic root was shortly occluded with forceps instead of clipping. About 90 % of the animals survived the surgical procedure. All animal experiments were conducted in accordance with institutional guidelines and were approved by local authorities. Previous experiments using this model have demonstrated a 20-30 % hypertrophy caused by an increase in ventricular afterload without a stimulation of the systemic renin-angiotensin system (Wiesner et al. 1997) or the local renin-angiotensin system of the heart (Ehmke et al. 1997; Weinberg et al. 1997).
Haemodynamic measurements and ECG recordings
Seven days after surgery the rats were anaesthetized by i.p. injection of Inactin (thiobutabarbital sodium, Byk Gulden, Konstanz, Germany), at 100 mg (kg body mass)−1. A femoral artery catheter was inserted to measure peripheral blood pressure (BP). Left ventricular pressure (LVP) was measured by cannulating the left ventricle through the cardiac apex. BP was sampled at 1 kHz using an ITC-16 interface (Instrutech Corp., Port Washington, NY, USA) connected to a Macintosh computer (Apple Computers Inc., CA, USA). Six-lead ECGs were recorded after induction of anaesthesia with the rats in the supine position using an EK56 (Hellige, Freiburg, Germany) with a voltage gain of 20 mm mV−1 and a paper speed of 50 mm s−1. To calculate QTc, Bazett's formula (Bazett, 1920) was adjusted to the resting heart rate of young rats (280 min−1):
Isolation of myocytes
After completion of the haemodynamic measurements, the heart was quickly excised and placed in cold (4°C) cardioplegic solution where it stopped beating immediately. After removal of the stenosing clip, the heart was mounted on a Langendorff apparatus and left ventricular myocytes were isolated according to the method described by Isenberg & Klockner (1982). The aorta was cannulated and retrogradedly perfused with nominally Ca2+-free modified Tyrode solution at 37°C for 5 min. Perfusion pressure was 75 mmHg, and all solutions were bubbled with 100 % oxygen. The perfusion was continued for 15 min with 20 ml of the same solution containing collagenase (type CLS II, 200 U ml−1; Biochrom KG, Berlin, Germany) and protease (type XIV, 0.7 U ml−1; Sigma, USA), and the solution was recirculated. Finally, the heart was perfused with modified Tyrode solution containing 100 μM Ca2+ for another 5 min. After the perfusion, the left ventricular free wall was separated from the rest of the heart. Since there are known differences in APD and Ito1 magnitude between basal and apical regions of the left ventricle (Gómez et al. 1997), care was taken to isolate endocardial, midmyocardial and epicardial myoctyes from the centre part of the left ventricular free wall. Using fine forceps, endocardial and epicardial tissue pieces were carefully dissected from the left ventricular free wall and placed in separate cups. After the superficial parts of endocardial and epicardial regions had been removed, midmyocardial tissue pieces were isolated from deeper parts of the left ventricular wall. To further disaggregate the tissue pieces, they were gently shaken at 37°C for some minutes, filtered through a cotton mesh and allowed to settle for half an hour. Cells were stored at room temperature in modified Tyrode solution containing 100 μM Ca2+. Only single rod-shaped cells with clear cross striations and no spontaneous contractions were used for experiments.
Solutions and chemicals
Cardioplegic solution contained (mM): 15 NaCl, 9 KCl, 4 MgCl2, 0.33 NaH2PO4, 0.015 CaCl2, 10 glucose and 238 mannitol, titrated to pH 7.40 with NaOH. Giga-ohm seals were obtained in modified Tyrode solution (control solution, mM): 138 NaCl, 4 KCl, 1 MgCl2, 0.33 NaH2PO4, 2 CaCl2, 10 glucose and 10 Hepes, titrated to pH 7.30 with NaOH. To inhibit Ca2+ currents, 0.3 mM CdCl2 was added to some solutions. Inward rectifier currents were inhibited by 2 mM Ba2+. The pipette solution contained (mM): 120 glutamic acid, 10 KCl, 2 MgCl2, 10 EGTA, 2 Na2-ATP and 10 Hepes, titrated to pH 7.20 with KOH. Na2-ATP, 4-AP, TEA and CdCl2 were purchased from Sigma (Deisenhofen, Germany), glucose, KCl, MgCl2, NaCl, BaCl2 and NaOH from Merck (Darmstadt, Germany), CaCl2 from J. T. Baker (Deventer, The Netherlands), EGTA from Boehringer (Mannheim, Germany), glutamic acid from Fluka (Neu-Ulm, Germany), and KOH from Riedel de Haen (Seelze, Germany).
Patch-clamp technique
The ruptured patch whole-cell configuration was used as described previously (Hamill et al. 1981). Myocytes were transferred to an elongated chamber (2.5 × 20 mm), mounted on the stage of an inverted microscope (Axiovert 25, Zeiss, Jena, Germany), and were initially superfused with control solution. All experiments were performed at room temperature (22-26°C). The flow rate was 15 ml min−1 and solution exchange of the bath was achieved within seconds. Patch pipettes were pulled from borosilicate glass (GC150-15, Clark Electromedical Instruments, Reading, UK) using a P-87 Puller (Sutter Instruments, CA, USA).
Currents were recorded using an EPC-9 amplifier (HEKA Elektronik, Lambrecht, Germany), controlled by a Power-Macintosh computer (Apple Computers Inc.) and Pulse software (HEKA Elektronik). Membrane capacitance (Cm) and series resistance (Rs) were calculated using the automated capacitance compensation procedure of the EPC-9 amplifier. When filled with potassium glutamate, pipette resistance (Rpip) averaged 3.7 ± 0.1 MΩ (n = 175). Rs averaged 6.1 ± 0.1 MΩ (n = 174) and was compensated by 85 %, leading to an average effective Rs of 0.9 MΩ. Accordingly, at the largest recorded currents of about 6 nA observed at Vpip=+80 mV, the maximal voltage error was less then 6 mV or 8 %. Cm averaged 122 ± 4 pF (n = 82) in myocytes of sham-operated and was increased to 151 ± 4 pF (n = 92; P < 0.0001) in myocytes of AS animals, demonstrating hypertrophy at the cellular level. Pipette potential (Vpip) and membrane potential (Vm) were corrected for liquid junction potentials occurring at the reference electrode bridge/bath junction (13 mV for pipette solution vs. control solution). Whole-cell currents were low-pass filtered at 1 kHz and sampled at 5 kHz. APs were sampled at 1 kHz. Whole-cell data were analysed using PulseFit software (HEKA Elektronik) and IGOR (WaveMetrics, Lake Oswego, OR, USA). Data are given as means ±s.e.m. Unless stated otherwise, statistical significance was calculated using the appropriate version of Student's t test or Mann-Whitney U test after an initial two-way ANOVA using PRISM software (Graph-Pad Inc., San Diego, CA, USA). Differences with P < 0.05 were considered statistically significant.
RESULTS
Haemodynamic effects of ascending aortic stenosis
Table 1 summarizes haemodynamic data obtained from all rats used for electrophysiological experiments. Femoral artery pressure was similar in both sham-operated and AS animals. Left ventricular peak pressure (LVPP) averaged 185 ± 8 mmHg in AS rats, resulting in a mean pressure difference of 85 mmHg between the left ventricle and the peripheral circulation (P < 0.0001). Sham-operated animals displayed no difference between LVPP and peripheral systolic BP. Left ventricular end-diastolic pressure (LVEDP) and heart rate (HR) were identical in both groups, and we did not observe pleural or peritoneal effusions, indicating that the hypertrophied hearts were not failing. In summary, these data suggest that rats with ascending aortic stenosis developed a compensated cardiac hypertrophy.
Table 1.
Haemodynamic data
| Systolic BP (mm Hg) | Diastolic BP (mm Hg) | LVPP (mm Hg) | LVEDP (mmHg) | HR (beats min−1) | n | |
|---|---|---|---|---|---|---|
| Sham | 109 ± 5 | 74 ± 5 | 113 ± 5 | 10 ± 1 | 309 ± 11 | 13 |
| AS | 100 ± 4 | 71 ± 5 | 185 ± 8* | 11 ± 1 | 303 ± 11 | 12 |
Summary of haemodynamic data obtained from animals used for electrophysiological experiments. Systolic BP, systolic blood pressure; Diastolic BP, diastolic blood pressure; LVPP, left ventricular peak pressure; LVEDP, left ventricular end-diastolic pressure; HR, heart rate; n, number of animals.
P < 0.001, AS vs. sham.
ECG recordings
In a different set of rats, ECGs were recorded prior to the initial sham or AS operation and a second time 1 week later, prior to the haemodynamic measurements. Figure 1 shows representative ECG recordings 1 week after the sham operation (Fig. 1A) and 1 week after AS (Fig. 1B). In the ECG of the sham-operated animal, the largest deflection of the QRS complex was positive and observed in lead III, indicating that the direction of the main vector of the QRS complex points in this direction. The ECG recorded from the AS animal shows a leftwards shift of the main vector of the QRS complex: the largest deflection was negative and observed in lead III. The T-waves of both ECGs were similar in that their largest deflection was positive and observed in lead III. Figure 1 summarizes the direction of the main vector of the QRS complex and the T-wave of sham-operated (Fig. 1C, n = 7) and AS animals (Fig. 1D, n = 5). In the sham-operated group, QRS complex and T-wave direction were similar before and 7 days after the operation and point in the same direction. In the AS group, the direction of the main vector of the QRS complex was significantly shifted by an average of 103 ± 23 deg (n = 5; P < 0.05) to the left, whereas the direction of the T-wave remained unchanged. Thus in the hypertrophied hearts, QRS complex and T-wave point in almost opposite directions, indicating an abnormal sequence of repolarization.
Figure 1. ECG recordings of sham-operated and AS rats.
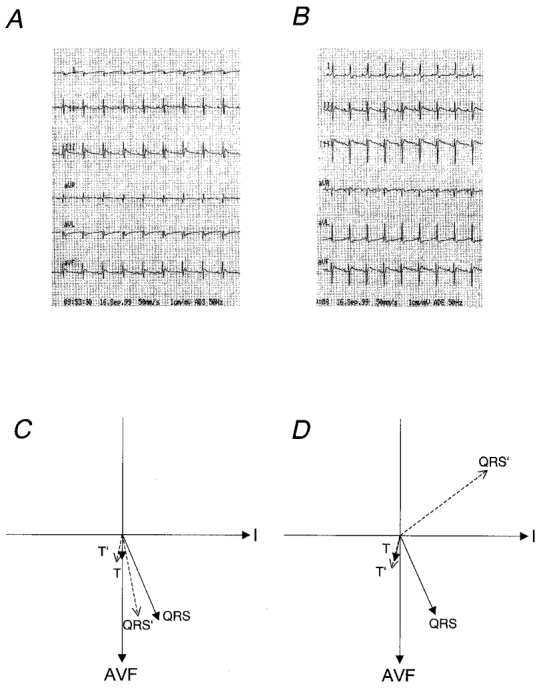
Representative ECG recordings 1 week after sham operation (A) or AS (B). The voltage gain was 20 mm mV−1 and the paper speed was 50 mm s−1. Average main vectors of the QRS complex and the T-wave are illustrated in panel C for sham-operated animals (n = 7) and in panel D for AS animals (n = 5). Continuous arrows represent recordings made before surgery; dashed arrows represent recordings 7 days after surgery. QRS and T are the main vectors before surgery; QRS’ and T’ are main vectors 7 days after surgery; AVF is the direction of lead AVF; I is the direction of lead I.
Table 2 summarizes ECG characteristics of both groups. Heart rate, PQ interval, QRS duration and magnitude of the main vector of the QRS complex and the T-wave were not significantly different between sham-operated and AS animals. The QT interval and the QTc were significantly longer in AS than in sham-operated animals, suggesting an increase in myocardial APD.
Table 2.
ECG properties
| HR (beats min−1) | PQ (ms) | QRS (ms) | QT (ms) | QTc | n | |
|---|---|---|---|---|---|---|
| Sham | 385 ± 16 | 47 ± 1 | < 20 | 51 ± 3 | 60 ± 3 | 7 |
| AS | 388 ± 9 | 46 ± 1 | < 20 | 64 ± 5* | 75 ± 6* | 5 |
Characteristics of ECGs obtained from rats 1 week after sham operation or AS. QTc was calculated as described in the Methods. QRS duration was always less than 20 ms and too short to be accurately estimated from the ECG chart.
P < 0.05, AS vs. sham.
Action potential characteristics
At the beginning of each experiment, after the conventional ruptured patch whole-cell configuration was established, Vm was recorded in the zero current clamp mode of the amplifier. Vm was similar in endocardial, midmyocardial and epicardial myocytes, so all data were pooled. Average Vm was -86.6 ± 0.2 mV (n = 68) in myocytes from sham-operated rats and -86.2 ± 0.3 mV (n = 83, n.s.) in myocytes from AS rats. Figure 2 displays representative individual APs recorded from endocardial, midmyocardial and epicardial myocytes of sham-operated (Fig. 2A) and AS (Fig. 2B) rats. In both groups, APD was smallest in epicardial myocytes and increased towards endocardial regions. In epicardial and midmyocardial myocytes isolated from AS rats, APD was longer and the APs displayed a more pronounced plateau phase compared with APs recorded from sham-operated animals. Figure 2C compares average values for APD90 recorded from sham-operated and AS rats. APD90 was significantly longer in epicardial (P < 0.05) and midmyocardial (P < 0.05), but not in endocardial myocytes (P = 0.10). Similar results were obtained for APD0 mV (data not shown). When tested for a trend, APD90 (and APD0 mV) significantly increased from epicardial to endocardial regions in sham-operated animals (P < 0.05, one-way ANOVA, post-test for trend). In AS animals, a trend was still visible, but did not reach statistical significance (P = 0.11), further supporting a reduction of the APD gradient within the left ventricular free wall by cardiac hypertrophy. It was also noted that the overshoot of the AP was significantly higher in endocardial compared with midmyocardial and epicardial myocytes of both sham-operated (38.0 ± 1.8, 28.8 ± 3.4 and 27.4 ± 3.1 mV) and AS animals (36.7 ± 1.4, 27.3 ± 2.6 and 25.7 ± 1.9 mV).
Figure 2. Effect of pressure-induced cardiac hypertrophy on regional APD.
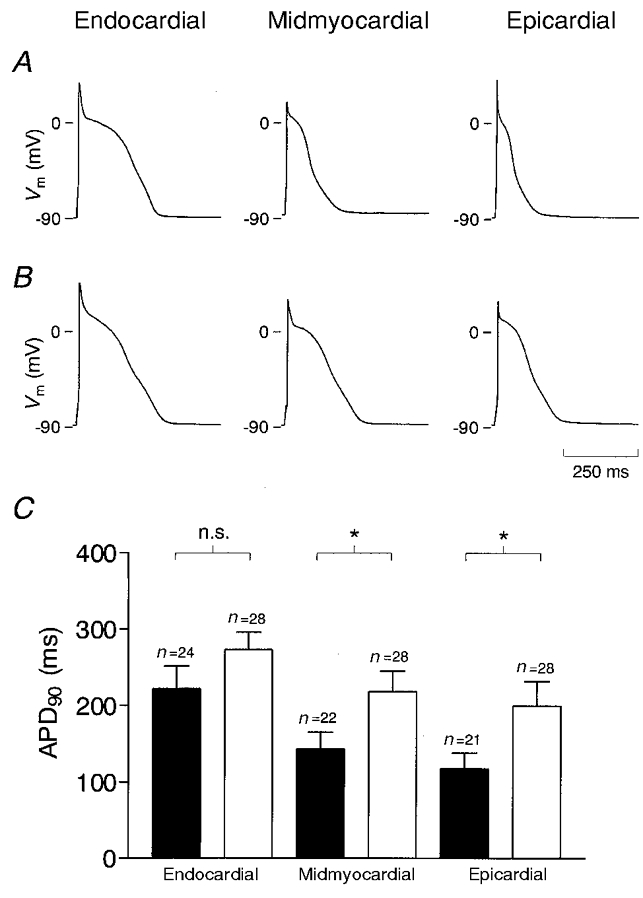
Representative APs recorded from endocardial, midmyocardial and epicardial myocytes of sham-operated (A) and AS rats (B). APs were elicited at a rate of 0.3 Hz by a depolarizing current pulse of 5 ms duration. C, average APD90 obtained from myocytes of sham-operated (▪) and AS rats (□). *P < 0.05; n is the number of myocytes.
Transient outward K+ current
Figure 3 shows representative current traces recorded from myocytes isolated from endocardial, midmyocardial and epicardial regions of sham-operated (Fig. 3A) and AS (Fig. 3B) animals. At depolarizing voltage steps exceeding Vpip= -20 mV, a rapidly activating and inactivating Ito1 was observed in all myocytes. The magnitude of this current showed a distinct distribution in both sham-operated and AS animals: in endocardial myocytes Ito1 was small, whereas it was large in epicardial myocytes; in midmyocardial myocytes Ito1 attained values in-between those recorded from endocardial and epicardial myocytes. In epicardial and midmyocardial myocytes isolated from AS rats, Ito1 was smaller than in the corresponding regions from sham-operated rats, whereas Ito1 in endocardial myocytes was similar in both groups.
Figure 3. Selective reduction of Ito1 in epicardial and midmyocardial myocytes in pressure-induced cardiac hypertrophy.
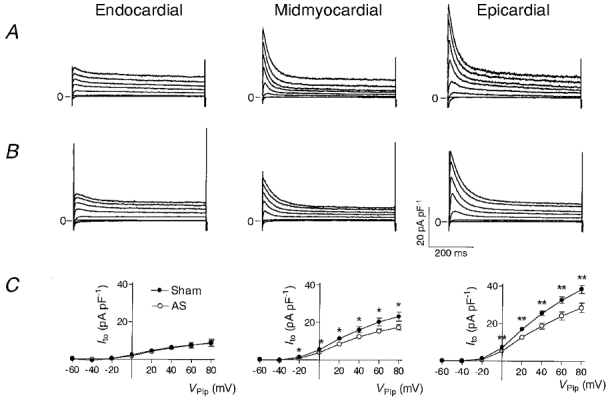
Representative outward currents recorded from endocardial, midmyocardial and epicardial myocytes of sham-operated (A) and AS rats (B). Currents were activated at a rate of 0.3 Hz by rectangular voltage pulses from a holding potential of Vpip= -90 mV to values ranging from -60 to +80 mV in steps of 20 mV. Each voltage pulse was preceded by a depolarization to Vpip= -50 mV for 20 ms to inactivate Na+ currents. The bath solution contained 0.3 mM Cd2+ to inhibit Ca2+ currents. Currents were normalized to Cm to correct for different cell sizes and are thus given in pA pF−1. C, average current-voltage relationships of Ito1 recorded from endocardial (sham, n = 25; AS, n = 26), midmyocardial (sham, n = 21; AS, n = 29) and epicardial (sham, n = 23; AS, n = 26) myocytes of sham-operated (•) and AS (○) rats. Ito1 was quantified by subtracting the current at the end of the voltage pulse (600 ms) from the peak current. *P < 0.05, **P < 0.01, sham-operated vs. AS rats.
Figure 3C shows average current-voltage (I-V) relationships from all myocytes investigated. Ito1 was quantified by calculating the amplitude of the transient component of the current, i.e. the difference between the peak current and the steady-state current at the end of the voltage pulse. Independent of the origin of the myocyte, Ito1 activated at pulse potentials positive to Vpip= -20 mV in both sham-operated and AS animals, and the I-V relationship was linear from this potential up to Vpip= 80 mV. In epicardial myocytes Ito1 was ∼30 % lower in AS than in sham-operated animals (18.7 ± 1.6 pA pF−1, n = 26vs. 25.5 ± 1.3 pA pF−1, n = 23; P < 0.01, Vpip= 40 mV). A similar reduction was observed in midmyocardial myocytes (12.5 ± 1.0 pA pF−1, n = 29vs. 16.2 ± 1.6 pA pF−1, n = 21; P < 0.05). In contrast, in endocardial myocytes no differences could be detected (6.1 ± 1.1 pA pF−1, n = 26vs. 6.5 ± 1.0 pA pF−1, n = 25; n.s.).
Kinetic properties of Ito1
Since altered channel kinetics may contribute to a decreased current magnitude, we analysed kinetic properties of Ito1 in the different groups. Figure 4 summarizes inactivation (Fig. 4A), steady-state inactivation (Fig. 4B), and recovery from inactivation (Fig. 4C) of Ito1 recorded from endocardial, midmyocardial and epicardial myocytes of sham-operated and AS animals. Detailed characteristics of Ito1 kinetics are summarized in Table 3.
Figure 4. Kinetic properties of Ito1 in normal and hypertrophied hearts.
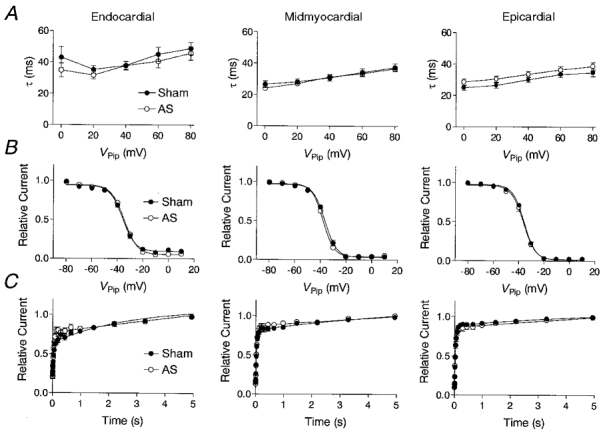
Inactivation (A), steady-state inactivation (B), and recovery kinetics (C) of Ito1 recorded from endocardial, midmyocardial and epicardial myocytes of sham-operated (•) and AS (○) rats. A, inactivation time constants (τ) were estimated at holding potentials ranging from Vpip= 0 mV to Vpip=+80 mV by mono-exponential fitting of the current decay. B, steady-state inactivation was determined by a two-step pulse protocol: a conditioning pulse of 600 ms duration ranging from -80 to +10 mV in steps of 10 mV was followed by a step to +60 mV for 600 ms. The magnitude of Ito1 detected at +60 mV after the conditioning pulse was normalized to Ito1 recorded at a conditioning potential of -90 mV in each individual experiment, and is given as a function of the conditioning pulse potential. Data were fitted assuming a Boltzmann kinetic of steady-state inactivation. C, recovery from inactivation was determined by two consecutive pulses to +60 mV, each of 600 ms. During the interval between the two depolarizations, Vpip was returned to -90 mV. The interval between the voltage pulses ranged from 5 to 5000 ms and increased exponentially, with 1.5 being the exponent. Pulses were delivered at 0.1 Hz. The magnitude of Ito1 recorded during the second voltage pulse was normalized to the magnitude of the first, and plotted versus the duration of the interval between the voltage pulses. Recovery curves were fitted using a bi-exponential function.
Table 3.
Kinetic properties of Ito1
| Endocardial | Midmyocardial | Epicardial | ||
|---|---|---|---|---|
| τ (0 mV)(ms) | Sham | 43.0 ± 6.7 ‡ | 26.5 ± 2.1 | 28.5 ± 2.0 |
| AS | 34.8 ± 4.4† | 24.1 ± 1.2 | 24.8 ± 1.6 | |
| τ (80 mV)(ms) | Sham | 48.9 ± 4.0† | 37.4 ± 2.5 | 38.6 ± 2.5 |
| AS | 45.9 ± 4.3† | 36.7 ± 1.2 | 34.6 ± 2.5 | |
| n | Sham | 24 | 21 | 23 |
| AS | 25 | 29 | 24 | |
| V1½2(mV) | Sham | –34.0 ± 1.1 | –33.5 ± 3.3 | –35.6 ± 0.6 |
| AS | –34.1 ± 0.8 | –37.5 ± 0.5 | –36.3 ± 0.9 | |
| Slope(mV) | Sham | –4.9 ± 0.4 | –3.8 ± 0.6 | –4.4 ± 0.1 |
| AS | –4.4 ± 0.6 | –4.4 ± 0.2 | –4.4 ± 0.2 | |
| n | Sham | 22 | 20 | 23 |
| AS | 25 | 28 | 26 | |
| Recovery | Sham | 49.1 ± 4.3‡ | 31.7 ± 2.7 | 34.1 ± 1.9 |
| τ1 (ms) | AS | 36.6 ± 3.0* | 32.4 ± 1.3 | 31.7 ± 2.3 |
| τ2 (ms) | Sham | 2164 ± 353 | 2381 ± 227 | 2525 ± 150 |
| AS | 3145 ± 457 | 3314 ± 836 | 2505 ± 335 | |
| %τ1 | Sham | 58.3 ± 5.0§ | 73.1 ± 6.2 | 88.6 ± 1.9 |
| AS | 72.2 ± 4.5* | 85.1 ± 2.6 | 83.1 ± 5.2 | |
| %τ2 | Sham | 41.7 ± 5.0§ | 26.9 ± 6.2 | 11.4 ± 1.9 |
| AS | 27.8 ± 4.5* | 17.9 ± 2.6 | 16.9 ± 5.2 | |
| n | Sham | 19 | 13 | 17 |
| AS | 17 | 21 | 13 |
τ (0 mV) and ± (80 mV), inactivation time constants obtained by mono-exponential fitting of current decay Vpip= 0 or 80 mV, respectively. V1½2, voltage at which half-maximal steady-state inactivation was observed. Slope, slope factor of the Boltzmann equation. τ1 and τ2, time constants for recovery from inactivation, obtained by bi-exponentially fitting the current recovery. %τ1 and %τ2, contribution of τ1 and τ2 to total recovery; values are given as a percentage of total recovery. n, number of myocytes investigated.
P < 0.05
P < 0.01, endocardial vs. midmyocardial and epicardial.
P < 0.001, endocardial vs. epicardial.
P < 0.05, AS vs. sham.
Figure 4A shows inactivation time constants plotted versus the activation voltage pulse potential. Inactivation time constants were similar in both sham-operated and AS animals. In epicardial and midmyocardial myocytes a small increase in inactivation time constant with increasing depolarisation was noted. In endocardial myocytes of both sham-operated and AS rats, inactivation time constants at Vpip= 0 and +80 mV were slightly, but significantly higher than in midmyocardial and epicardial myocytes (P < 0.05).
Figure 4B displays average steady-state inactivation curves of Ito1. In both sham-operated and AS animals, the potential at which half-maximal inactivation occurred (V½) was in the region of -35 mV and similar in all three layers. The slope of the Boltzmann-fit was also similar in the three regions of sham-operated and AS rats, and averaged around -4.5 mV (see Table 3).
Recovery from inactivation (Fig. 4C) followed a bi-exponential characteristic, resulting in a short time constant in the region of 40 ms and a long time constant in the region of 2000 ms. In sham-operated animals, the short time constant was significantly longer in endocardial (49.1 ± 4.3 ms, n = 19) compared with midmyocardial (31.7 ± 2.7 ms, n = 19, P < 0.01) and epicardial myocytes (34.1 ± 1.9 ms, n = 17, P < 0.01) and accounted for less of total recovery (58.3 ± 5.0 %, n = 19) compared with epicardial (88.6 ± 1.9 %, n = 17, P < 0.001) myocytes. In AS animals, the short time constant significantly decreased in endocardial myocytes to 36.6 ± 3.0 ms (n = 17, P < 0.05), and accounted for more of total recovery (72.2 ± 4.5 %, n = 17, P < 0.05). The long time constant was not different within the ventricular wall, nor was it affected by AS, except that it accounted for less of total recovery in endocardial myocytes of AS animals. Table 3 summarizes recovery from inactivation in detail.
Delayed rectifier K+ current
IK is a major repolarizing ionic current in the dog ventricle and it has been found to be differentially expressed within the canine left ventricle (Liu & Antzelevitch, 1995). We therefore speculated that alterations in IK might also contribute to changes in APD observed in AS animals. Unlike in other species, e.g. guinea-pigs, where IK activates slowly and increases with prolonged depolarization (Sanguinetti & Jurkiewicz, 1990), IK in rat ventricular myocytes activates rapidly and inactivates slowly with prolonged depolarization until a steady state is reached (Apkon & Nerbonne, 1991). We therefore compared the steady-state current at the end of voltage pulses of 600 ms duration (Isus), where Ito1 has already inactivated, in myocytes from sham-operated and from AS animals. I-V relationships of Isus were obtained by quantifying the current after 600 ms from voltage pulses similar to those shown in Fig. 3A and B, and are shown in Fig. 5. In both sham-operated and AS rats, Isus was similar in endocardial, midmyocardial and epicardial myocytes. In AS animals, however, Isus was significantly smaller in endocardial and midmyocardial myocytes, although this effect was quantitatively very small (see Table 4 for exact values).
Figure 5. Effect of pressure-induced cardiac hypertrophy on delayed rectifier K+ currents.
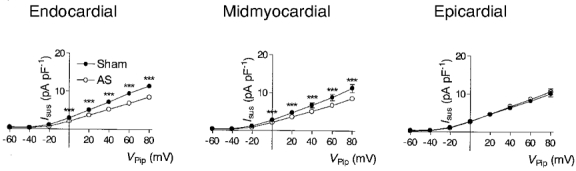
Average current-voltage relationship of the steady-state current estimated at the end of a 600 ms voltage pulse and recorded from endocardial, midmyocardial and epicardial myocytes of sham-operated (•) and AS (○) rats. Current magnitude was estimated using recordings similar to those shown in Fig. 3, same n as in Fig. 3. ***P < 0.001, AS vs. sham.
Table 4.
Properties of IK and IK1
| Endocardial | Midmyocardial | Epicardial | ||
|---|---|---|---|---|
| IK(40 mV)(pA pF−1) | Sham | 7.2 ± 0.3 | 6.7 ± 0.6 | 6.4 ± 0.5 |
| AS | 5.2 ± 0.2*** | 5.1 ± 0.3*** | 6.7 ± 0.4 | |
| n | Sham | 20 | 20 | 22 |
| AS | 26 | 29 | 22 | |
| g(IK1)(pS pF−1) | Sham | 323 ± 24 | 331 ± 27 | 327 ± 54 |
| AS | 243 ± 15** | 247 ± 27* | 237 ± 17 | |
| n | Sham | 11 | 15 | 10 |
| AS | 16 | 10 | 8 |
IK(40 mV), current magnitude of IK, obtained at Vpip= 40 mV. IK was estimated as the current at the end (600 ms) of the depolarizing voltage step. g(IK1), conductance of IK1, calculated as the chord conductance between Vpip=−120 and −90 mV. n, number of myocytes investigated.
P < 0.05
P < 0.01
P < 0.001, AS vs. sham.
Inward rectifying K+ current
IK1 sets the membrane potential and contributes to the late phase of repolarization. To estimate IK1 we subtracted current recordings in the presence of 2 mM Ba2+ in the bath solution from those recorded in its absence. Figure 6 shows recordings of Ba2+-sensitive currents recorded from endocardial, midmyocardial and epicardial myocytes of sham-operated (Fig. 6A) and AS rats (Fig. 6B). At potentials negative to -90 mV, large inward currents can be observed, whereas at holding potentials positive to -90 mV, only very small outward currents are detectable. Figure 6C shows average I-V relationships calculated from all Ba2+-sensitive currents recorded from sham-operated and AS animals. IK1 magnitude was estimated at the end of the voltage pulse. In myocytes isolated from sham-operated rats, the slope conductances of IK1 (calculated between -120 and -90 mV) were similar in the three regions. AS led to a similar decrease of the slope conductance in all regions (see Table 4 for exact values).
Figure 6. Effect of pressure-induced cardiac hypertrophy on inwardly rectifying K+ currents.
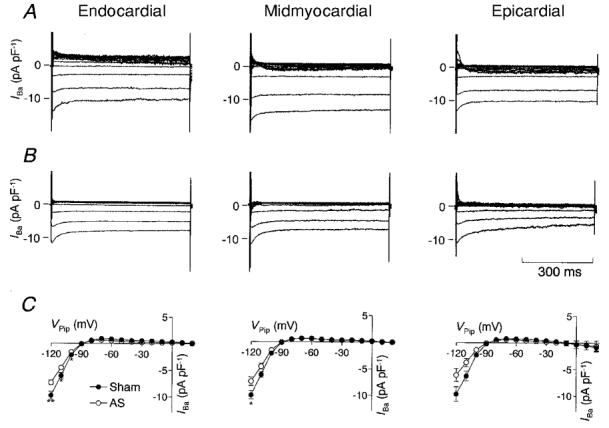
Recordings of Ba2+-sensitive currents obtained from an endocardial, midmyocardial and epicardial myocyte of sham-operated (A) and AS (B) rats. Vpip was clamped for 600 ms to a potential from -120 to +30 mV in steps of 10 mV. Using this protocol, currents recorded in the presence of 2 mM Ba2+ in the bath solution were subtracted from those recorded in the absence of 2 mM Ba2+. In the current traces recorded from midmyocardial and epicardial myocytes, a small transient outward current can be detected at positive pulse potentials. Addition of Ba2+ to the bath solution not only inhibits IK1 but also shifts the activation curve of Ito1. Thus the small transient component in the Ba2+-sensitive currents may have resulted from the effect of Ba2+ on Ito1. However, since this component was only detectable at potentials positive to Vpip= -20 mV and was transient in nature, it did not interfere with the estimate of IK1. C, average current-voltage relationship of the Ba2+-sensitive currents determined at the end of a 600 ms voltage pulse and recorded from endocardial (sham, n = 11; AS, n = 16), midmyocardial (sham, n = 15; AS, n = 10) and epicardial (sham, n = 10; AS, n = 8) myocytes from sham-operated (•) and AS (○) rats. *P < 0.05, **P < 0.01, sham-operated vs. AS rats.
DISCUSSION
The results of this study show that cardiac hypertrophy induced by pressure overload is associated with regional as well as non-regional effects on repolarizing K+ currents: Ito1 was selectively reduced in myocytes of epicardial and midmyocardial origin, whereas IK1 was reduced in all layers, and IK only in endocardial and midmyocardial myocytes. These results indicate that the regional reduction of Ito1 underlies the concurrently observed changes in APD in the same regions, whereas the effects of AS on IK1 and IK may slightly counteract this modulatory action. Furthermore, the observed regional changes in Ito1 may cause, via an altered gradient in APD within the left ventricular free wall, the dissociation of QRS complex and T-wave direction observed in ECG recordings in cardiac hypertrophy.
Limitations of the study
Although we tried to work under physiological conditions, some compromises had to be made. All experiments were performed at room temperature, since at 37°C kinetics and magnitude of currents such as Ito1 reach levels that may exceed the capacity of the whole-cell configuration.
Intracellular Ca2+ was buffered using EGTA in the pipette solution to exclude Ca2+-dependent currents such as the Ca2+-dependent transient outward current (Zygmunt & Gibbons, 1992) from our recordings. Cd2+, which was used to inhibit Ca2+ currents, is known to affect activation and inactivation kinetics of Ito1: at a concentration of 300 μM, Cd2+ shifts the steady-state activation and inactivation curves by about 15-20 mV to more positive potentials (Agus et al. 1991). However, other, more specific inhibitors of Ca2+ channels such as dihydropyridines or D600 are also potent inhibitors of Ito1 (Gotoh et al. 1991; Lefevre et al. 1991). Furthermore, Cd2+ has been used as an inhibitor of Ca2+ currents in several other studies investigating Ito1 (Shibata et al. 1989; Wettwer et al. 1993; Tomita et al. 1994), thus by using Cd2+, the current properties may be compared directly with those recorded previously.
Since a key aim of this study was to investigate changes in ionic currents underlying changes in APs, we recorded APs under identical conditions as ionic currents. By working at room temperature and with buffering of internal Ca2+, the APs we recorded were longer than they are under physiological conditions. However, in our study the relation of APD in each myocardial region of sham-operated and AS animals was more important than absolute values. Furthermore, the gradient in APD we observed within the left ventricular wall is similar to results recorded under more physiological conditions at 37°C (Shipsey et al. 1997).
We have used the sustained current after 600 ms of depolarization as an estimate for total IK in this study, as done previously (Clark et al. 1993; Bryant et al. 1999). Recently, Himmel et al. (1999) showed that IK consists of three components in rat ventricular myocytes. However, a complex approach beyond the scope of our study is needed to identify these individual components. By using Isus, we may have underestimated some of these components, especially those inactivating with a short time constant.
Regional distribution of APD and ionic currents
In rats, differences in the magnitude of Ito1 between endocardial and epicardial myocytes have been found to be the primary cause of the accompanying differences in APD (Clark et al. 1993; Shimoni et al. 1995). Unlike in other species, where differences in the magnitude of IK and IK1 within the left ventricular wall contribute to the gradient in APD (Furukawa et al. 1992; Liu & Antzelevitch, 1995), the rat ventricle displays no differences in IK and IK1 between endocardial and epicardial myocytes (Clark et al. 1993; Shimoni et al. 1995). The magnitudes of Ito1 and APD observed in endocardial and epicardial myocytes in the present study correspond very well to those previously reported for rats (Clark et al. 1993; Shimoni et al. 1995). Furthermore, our data demonstrate that APD and Ito1 recorded from midmyocardial regions attain values in-between those in endocardial and epicardial layers. Thus we identified a continuous gradient in APD and Ito1 from endocardial to epicardial myocytes. Shipsey et al. (1997) similarly found a continuous gradient in APD within the left ventricular free wall. By addition of 4-aminopyridine to inhibit Ito1, the authors could not completely remove the differences in APD between the three layers and concluded that other ionic currents than Ito1 participate in AP heterogeneity among the left ventricular free wall. Since we could not detect any differences in current magnitude of the L-type Ca2+ current (ICaL, T. Volk & H. Ehmke, unpublished observation), IK and IK1, our data do not support the hypothesis that differences in ionic currents other than Ito1 contribute to the gradient in APD. However, we cannot exclude the possibility that ionic currents we have not investigated, e.g. Ca2+-dependent currents, are differentially distributed within the left ventricular free wall and thus contribute to the gradient in APD.
Kinetic properties of Ito1 were essentially identical between midmyocardial and epicardial myocytes. However, myocytes of endocardial origin showed a slightly but significantly longer inactivation time constant, and the short time constant of recovery was larger and contributed to less of total recovery. In some experiments, Ito1 was very small in endocardial myocytes, thus fitting of an exponential function to the current decay phase was difficult and may have yielded artificially large values for inactivation constants. Nevertheless, there is evidence that in ferret left ventricle, Ito1 in endocardial myocytes may be composed of different current components with differences in kinetics and pharmacology than Ito1 in epicardial myocytes (Brahmajothi et al. 1999). In rat left ventricle, Shimoni et al. (1995) detected differences in recovery of Ito1 in endocardial and epicardial myocytes that were similar to the results we have obtained. These results and our data further support the hypothesis that Ito1 in endocardial and epicardial regions may be composed of different components.
In canine left ventricle, a cell type with characteristic properties, the so-called ‘M-cell’, has been identified in the midmyocardial region (Sicouri & Antzelevitch, 1991). At slow stimulation rates, M-cells characteristically display much longer APs than myoctyes of endocardial or epicardial origin, and a lower magnitude of the slow component of IK (IKs) has been postulated to cause the typical shape of the M-cell AP in canine ventricle (Liu & Antzelevitch, 1995). A previous study failed to detect myocytes with AP properties typical for M-cells in the rat left ventricle, and suggested the absence of M-cells in the rat left ventricle (Shipsey et al. 1997). We also failed to detect a subpopulation of myocytes with AP properties typical for M-cells. Even with prolonged depolarizations of more than 3000 ms, we did not detect any increases in the depolarization-activated current, but rather a continuous decrease (data not shown), indicating that IKs currents play little or no role in shaping the rat AP. Nevertheless, it has recently been questioned whether the method of cell isolation is a proper approach for the detection of M-cells in hearts of small animals such as the rat or the guinea-pig. Since the left ventricular wall is rather thin in these animals, the fraction of myocytes that is assigned to the endocardial and epicardial groups may be ‘contaminated’ with M-cells or transitional cells (Antzelevitch et al. 1999). Therefore we cannot entirely exclude the possibility that the myocytes we have assigned to the endocardial group may actually be a mixture of ‘true’ endocardial myocytes and M-cells, with the M-cells being those myocytes with the longest APs recorded in this group.
Regional modulation of APD and ionic currents by cardiac hypertrophy
Previous studies consistently found an increase in APD associated with a decrease in Ito1 in cardiac hypertrophy (Xu & Best, 1991; Tomita et al. 1994; Cerbai et al. 1994; Coulombe et al. 1994; Mészáros et al. 1996). However, the precise origin of the myocytes was not taken into account and thus no information about regional effects of hypertrophy was gained. More recently, the effects of hypertrophy induced by abdominal aortic constriction (which in contrast to ascending aortic stenosis leads to an increase in circulating angiotensin II levels and to volume expansion) on APD and ionic currents in rat myocytes isolated from the apex, septum and from the free wall of the left ventricle was investigated (Gómez et al. 1997). The authors identified an increase in APD and a decrease in Ito1 in apical myocytes, but not in myocytes from the septum or from the free wall. The values obtained for Ito1 were considerably lower than those in the present study. Given the strong gradient of Ito1 within the free wall, it seems likely that most of the myocytes investigated in that study originated from regions close to the endocardium, which would explain the absence of a significant reduction of Ito1 in the free wall. A decrease in APD gradient and Ito1 within the left ventricular free wall was also found in catecholamine-induced cardiac hypertrophy (Shipsey et al. 1997; Bryant et al. 1999), and it was postulated that the shift in the direction of the main vector of the T-wave that occurred in this model was caused by a decrease in APD gradient. We have found similar changes in ECG and in APD gradient in cardiac hypertrophy induced by pressure overload. The strong reduction of Ito1 observed in epicardial and midmyocardial myocytes appears to be the underlying mechanism for the reduced APD gradient and the dissociation of QRS complex and T-wave direction in the ECG. This conclusion is further supported by the absence of an effect of AS on the magnitude of ICaL (T. Volk & H. Ehmke, unpublished observation), and the regional distribution of IK1. The selective reduction of IK in midmyocardial and endocardial myocytes may counteract the selective prolongation of APD in epicardial and midmyocardial myocytes. However, given the relatively small absolute changes in current densities (ca 2 pA pF−1 at Vpip= 40 mV), the reduction of IK1 and IK appears to be of only minor influence.
The absence of kinetic differences between Ito1 recorded from midmyocardial and epicardial myocytes of sham-operated and AS animals suggests that a reduction in channel density is the likely cause for the decrease in Ito1 in these layers. This is further supported by results obtained by Tomita et al. (1994), who could not detect differences in single channel properties of Ito1 between myocytes of control and hypertrophied hearts. In endocardial myocytes of AS rats, however, the short time constant of the recovery from inactivation was decreased, and accounted for a larger fraction of total recovery, thus reducing differences in recovery of Ito1 within the ventricular wall. It has been suggested that in ferret endocardial myocytes the Kv1.4 gene may account for the Ito1 component displaying the long recovery, whereas the component with a short recovery from inactivation may be encoded by the Kv4.2 gene (Brahmajothi et al. 1999). Accordingly, an explanation for the reduction of the short time constant of recovery in endocardial myocytes could be that AS specifically reduces the expression of Kv1.4. Further experiments addressing the effect of hypertrophy on the regional distribution of Kv channel subunits are needed.
Possible significance of regional effects of hypertrophy
Since APD has a strong influence on Ca2+ influx and cardiac contractility (Wood et al. 1969), a decrease in Ito1 and an accompanying prolongation of the AP may increase Ca2+ influx and contractility. Consistent with an effect of changes in Ito1 on Ca2+ influx, we could recently show that a 30 % reduction of Ito1 more than doubles Ca2+ influx in epicardial myocytes (Volk et al. 1999). In normal hearts, Ca2+ influx (Volk et al. 1999) and contractility (Clark et al. 1993) recorded from endocardial myocytes are more than twice as high as those recorded from epicardial myocytes. It appears that during hypertrophy the regional reduction of Ito1 in epicardial and midmyocardial myocytes may serve to increase and thus match the contractility of epicardial to that of endocardial layers.
Acknowledgments
We are most grateful to Rudolf Dussel and Anita Kühner for expert technical assistance. This work was supported by the Deutsche Forschungsgemeinschaft (Graduiertenkolleg ‘Experimentelle Nieren- und Kreislaufforschung’).
References
- Agus ZS, Dukes ID, Morad M. Divalent cations modulate the transient outward current in rat ventricular myocytes. American Journal of Physiology. 1991;261:C310–318. doi: 10.1152/ajpcell.1991.261.2.C310. [DOI] [PubMed] [Google Scholar]
- Antzelevitch C, Shimizu W, Yan GX, Sicouri S, Weissenburger J, Nesterenko VV, Burashnikov A, Di Diego J, Saffitz J, Thomas GP. The M cell: its contribution to the ECG and to normal and abnormal electrical function of the heart. Journal of Cardiovascular Electrophysiology. 1999;10:1124–1152. doi: 10.1111/j.1540-8167.1999.tb00287.x. [DOI] [PubMed] [Google Scholar]
- Apkon M, Nerbonne JM. Characterization of two distinct depolarization-activated K+ currents in isolated adult rat ventricular myocytes. Journal of General Physiology. 1991;97:973–1011. doi: 10.1085/jgp.97.5.973. [DOI] [PMC free article] [PubMed] [Google Scholar]
- Bazett HC. An analysis of the time relationships of the electrocardiogram. Heart. 1920;7:353. [Google Scholar]
- Brahmajothi MV, Campbell DL, Rasmusson RL, Morales MJ, Trimmer JS, Nerbonne JM, Strauss HC. Distinct transient outward potassium current (Ito) phenotypes and distribution of fast-inactivating potassium channel α subunits in ferret left ventricular myocytes. Journal of General Physiology. 1999;113:581–600. doi: 10.1085/jgp.113.4.581. [DOI] [PMC free article] [PubMed] [Google Scholar]
- Bryant SM, Shipsey SJ, Hart G. Normal regional distribution of membrane current density in rat left ventricle is altered in catecholamine-induced hypertrophy. Cardiovascular Research. 1999;42:391–401. doi: 10.1016/s0008-6363(99)00033-4. [DOI] [PubMed] [Google Scholar]
- Cerbai E, Barbier M, Li Q, Mugelli A. Ionic basis of action potential prolongation of hypertrophied cardiac myocytes isolated from hypertensive rats of different ages. Cardiovascular Research. 1994;28:1180–1187. doi: 10.1093/cvr/28.8.1180. [DOI] [PubMed] [Google Scholar]
- Clark RB, Bouchard RA, Salinas SE, Sanchez CJ, Giles WR. Heterogeneity of action potential waveforms and potassium currents in rat ventricle. Cardiovascular Research. 1993;27:1795–1799. doi: 10.1093/cvr/27.10.1795. [DOI] [PubMed] [Google Scholar]
- Cohen I, Giles W, Noble D. Cellular basis for the T-wave of the electrocardiogram. Nature. 1976;262:657–661. doi: 10.1038/262657a0. [DOI] [PubMed] [Google Scholar]
- Coulombe A, Momtaz A, Richier P, Swynghedauw B, Coraboeuf E. Reduction of calcium-independent transient outward potassium current density in DOCA salt hypertrophied rat ventricular myocytes. Pflügers Archiv. 1994;427:47–55. doi: 10.1007/BF00585941. [DOI] [PubMed] [Google Scholar]
- Ehmke H, Moser L, Wiesner RJ. Two independent pathways, mechanical stretch and angiotensin II, lead to cardiac hypertrophy in rats. Pflügers Archiv. 1997;433:R15. (abstract) [Google Scholar]
- Fedida D, Giles WR. Regional variations in action potentials and transient outward current in myocytes isolated from rabbit left ventricle. The Journal of Physiology. 1991;442:191–209. doi: 10.1113/jphysiol.1991.sp018789. [DOI] [PMC free article] [PubMed] [Google Scholar]
- Franz MR, Bargheer K, Raffenbeul W, Haverich A, Lichtlen PR. Monophasic action potential mapping in human subjects with normal electrocardiograms: direct evidence for the genesis of the T-wave. Circulation. 1987;75:379–386. doi: 10.1161/01.cir.75.2.379. [DOI] [PubMed] [Google Scholar]
- Furukawa T, Kimura S, Furukawa N, Bassett AL, Myerburg RJ. Potassium rectifier currents differ in myocytes of endocardial and epicardial origin. Circulation Research. 1992;70:91–103. doi: 10.1161/01.res.70.1.91. [DOI] [PubMed] [Google Scholar]
- Gómez AM, Bénitah JP, Henzel D, Vinet A, Lorente P, Delgado C. Modulation of electrical heterogeneity by compensated hypertrophy in rat left ventricle. American Journal of Physiology. 1997;272:H1078–1086. doi: 10.1152/ajpheart.1997.272.3.H1078. [DOI] [PubMed] [Google Scholar]
- Gotoh Y, Imaizumi Y, Watanabe M, Shibata EF, Clark RB, Giles WR. Inhibition of transient outward K+ current by DHP Ca2+ antagonists and agonists in rabbit cardiac myocytes. American Journal of Physiology. 1991;260:H1737–1742. doi: 10.1152/ajpheart.1991.260.5.H1737. [DOI] [PubMed] [Google Scholar]
- Hamill OP, Marty A, Neher E, Sakmann B, Sigworth FJ. Improved patch-clamp techniques for high-resolution current recording from cells and cell-free membrane patches. Pflügers Archiv. 1981;391:85–100. doi: 10.1007/BF00656997. [DOI] [PubMed] [Google Scholar]
- Himmel HM, Wettwer E, Li Q, Ravens U. Four different components contribute to outward current in rat ventricular myocytes. American Journal of Physiology. 1999;277:H107–118. doi: 10.1152/ajpheart.1999.277.1.H107. [DOI] [PubMed] [Google Scholar]
- Isenberg G, Klockner U. Calcium tolerant ventricular myocytes prepared by preincubation in a ‘KB medium’. Pflügers Archiv. 1982;395:6–18. doi: 10.1007/BF00584963. [DOI] [PubMed] [Google Scholar]
- Lefevre IA, Coulombe A, Coraboeuf E. The calcium antagonist D600 inhibits calcium-independent transient outward current in isolated rat ventricular myocytes. The Journal of Physiology. 1991;432:65–80. doi: 10.1113/jphysiol.1991.sp018376. [DOI] [PMC free article] [PubMed] [Google Scholar]
- Litovsky SH, Antzelevitch C. Transient outward current prominent in canine ventricular epicardium but not endocardium. Circulation Research. 1988;62:116–126. doi: 10.1161/01.res.62.1.116. [DOI] [PubMed] [Google Scholar]
- Liu DW, Antzelevitch C. Characteristics of the delayed rectifier current (IKr and IKs) in canine ventricular epicardial, midmyocardial, and endocardial myocytes. A weaker IKs contributes to the longer action potential of the M cell. Circulation Research. 1995;76:351–365. doi: 10.1161/01.res.76.3.351. [DOI] [PubMed] [Google Scholar]
- Liu DW, Gintant GA, Antzelevitch C. Ionic bases for electrophysiological distinctions among epicardial, midmyocardial, and endocardial myocytes from the free wall of the canine left ventricle. Circulation Research. 1993;72:671–687. doi: 10.1161/01.res.72.3.671. [DOI] [PubMed] [Google Scholar]
- Mészáros J, Ryder KO, Hart G. Transient outward current in catecholamine-induced cardiac hypertrophy in the rat. American Journal of Physiology. 1996;271:H2360–2367. doi: 10.1152/ajpheart.1996.271.6.H2360. [DOI] [PubMed] [Google Scholar]
- Näbauer M, Beuckelmann DJ, Überfuhr P, Steinbeck G. Regional differences in current density and rate-dependent properties of the transient outward current in subepicardial and subendocardial myocytes of human left ventricle. Circulation. 1996;93:168–177. doi: 10.1161/01.cir.93.1.168. [DOI] [PubMed] [Google Scholar]
- Sanguinetti MC, Jurkiewicz NK. Two components of cardiac delayed rectifier K+ current. Differential sensitivity to block by class III antiarrhythmic agents. Journal of General Physiology. 1990;96:195–215. doi: 10.1085/jgp.96.1.195. [DOI] [PMC free article] [PubMed] [Google Scholar]
- Shibata EF, Drury T, Refsum H, Aldrete V, Giles W. Contributions of a transient outward current to repolarization in human atrium. American Journal of Physiology. 1989;257:H1773–1781. doi: 10.1152/ajpheart.1989.257.6.H1773. [DOI] [PubMed] [Google Scholar]
- Shimoni Y, Severson D, Giles W. Thyroid status and diabetes modulate regional differences in potassium currents in rat ventricle. The Journal of Physiology. 1995;488:673–688. doi: 10.1113/jphysiol.1995.sp020999. [DOI] [PMC free article] [PubMed] [Google Scholar]
- Shipsey SJ, Bryant SM, Hart G. Effects of hypertrophy on regional action potential characteristics in the rat left ventricle: a cellular basis for T-wave inversion. Circulation. 1997;96:2061–2068. doi: 10.1161/01.cir.96.6.2061. [DOI] [PubMed] [Google Scholar]
- Sicouri S, Antzelevitch C. A subpopulation of cells with unique electrophysiological properties in the deep subepicardium of the canine ventricle. The M cell. Circulation Research. 1991;68:1729–1741. doi: 10.1161/01.res.68.6.1729. [DOI] [PubMed] [Google Scholar]
- Solberg LE, Singer DH, Ten-Eick RE, Duffin-Eg J. Glass microelectrode studies on intramural papillary muscle cells. Description of preparation and studies on normal dog papillary muscle. Circulation Research. 1974;34:783–797. doi: 10.1161/01.res.34.6.783. [DOI] [PubMed] [Google Scholar]
- Tomita F, Bassett AL, Myerburg RJ, Kimura S. Diminished transient outward currents in rat hypertrophied ventricular myocytes. Circulation Research. 1994;75:296–303. doi: 10.1161/01.res.75.2.296. [DOI] [PubMed] [Google Scholar]
- Volk T, Nguyen THD, Schultz JH, Ehmke H. Relationship between transient outward K+ current and Ca2+ influx in rat cardiac myocytes of endo- and epicardial origin. The Journal of Physiology. 1999;519:841–850. doi: 10.1111/j.1469-7793.1999.0841n.x. [DOI] [PMC free article] [PubMed] [Google Scholar]
- Weinberg EO, Lee MA, Weigner M, Lindpaintner K, Bishop SP, Benedict CR, Ho KK, Douglas PS, Chafizadeh E, Lorell BH. Angiotensin AT1 receptor inhibition. Effects on hypertrophic remodeling and ACE expression in rats with pressure-overload hypertrophy due to ascending aortic stenosis. Circulation. 1997;95:1592–1600. doi: 10.1161/01.cir.95.6.1592. [DOI] [PubMed] [Google Scholar]
- Wettwer E, Amos G, Gath J, Zerkowski HR, Reidemeister JC, Ravens U. Transient outward current in human and rat ventricular myocytes. Cardiovascular Research. 1993;27:1662–1669. doi: 10.1093/cvr/27.9.1662. [DOI] [PubMed] [Google Scholar]
- Wettwer E, Amos GJ, Posival H, Ravens U. Transient outward current in human ventricular myocytes of subepicardial and subendocardial origin. Circulation Research. 1994;75:473–482. doi: 10.1161/01.res.75.3.473. [DOI] [PubMed] [Google Scholar]
- Wickenden AD, Kaprielian R, Kassiri Z, Tsoporis JN, Tsushima R, Fishman GI, Backx PH. The role of action potential prolongation and altered intracellular calcium handling in the pathogenesis of heart failure. Cardiovascular Research. 1998;37:312–323. doi: 10.1016/s0008-6363(97)00256-3. [DOI] [PubMed] [Google Scholar]
- Wiesner RJ, Aschenbrenner V, Rüegg JC, Zak R. Coordination of nuclear and mitochondrial gene expression during the development of cardiac hypertrophy in rats. American Journal of Physiology. 1994;267:C229–235. doi: 10.1152/ajpcell.1994.267.1.C229. [DOI] [PubMed] [Google Scholar]
- Wiesner RJ, Ehmke H, Faulhaber J, Zak R, Rüegg JC. Dissociation of left ventricular hypertrophy, β-myosin heavy chain gene expression, and myosin isoform switch in rats after ascending aortic stenosis. Circulation. 1997;95:1253–1259. doi: 10.1161/01.cir.95.5.1253. [DOI] [PubMed] [Google Scholar]
- Wood EH, Heppner RL, Weidmann S. Inotropic effects of electric currents. I. Positive and negative effects of constant electric currents or current pulses applied during cardiac action potentials. II. Hypotheses: calcium movements, excitation- contraction coupling and inotropic effects. Circulation Research. 1969;24:409–445. doi: 10.1161/01.res.24.3.409. [DOI] [PubMed] [Google Scholar]
- Xu XP, Best PM. Decreased transient outward K+ current in ventricular myocytes from acromegalic rats. American Journal of Physiology. 1991;260:H935–942. doi: 10.1152/ajpheart.1991.260.3.H935. [DOI] [PubMed] [Google Scholar]
- Zygmunt AC, Gibbons WR. Properties of the calcium-activated chloride current in heart. Journal of General Physiology. 1992;99:391–414. doi: 10.1085/jgp.99.3.391. [DOI] [PMC free article] [PubMed] [Google Scholar]