

Abstract
Isometric tension, stiffness and the cross-bridge kinetics in rabbit soleus slow-twitch fibres (STFs) were studied in the temperature range 5–37°C by sinusoidal analysis.
The effects of MgATP and phosphate (Pi) on the cross-bridge kinetics were studied, and the temperature dependence of the kinetic constants of elementary steps of the cross-bridge cycle was deduced in the range 20–37°C.
The MgATP association constant (K1a) decreased when temperature was increased. The rate constants of the ATP-isomerization step (k1b and k−1b) and the cross-bridge detachment step (k2, and k−2) had Q10 values of 3–4, and hence their equilibrium constants (K1b and K2) changed little with temperature.
Q10 of the force generation step (k4) was the largest at 6.7; its reversal step (k−4) had a Q10 of 2.5, and hence its equilibrium constant (K4) increased significantly with temperature. The Pi association constant (K5) changed little with temperature.
The elementary steps of the cross-bridge cycle are more temperature sensitive in soleus STFs than in psoas, which are fast-twitch fibres. This is in accord with a higher temperature sensitivity of the apparent rate constants in STFs.
The temperature dependence of the equilibrium constant of the force generation step (K4) was fitted to the modified Van't Hoff equation to deduce standard enthalpy change (ΔH°; 70 ± 20 kJ mol−1), standard entropy change (ΔS°; 250 ± 70 J mol−1 K−1), and heat capacity change (ΔCp; −12 ± 5 kJ mol−1 K−1). These results indicate that the force generation step is an entropy driven, endothermic reaction that accompanies a burial of large surface area. These observations are consistent with the hypothesis that hydrophobic interaction between residues of actin and myosin and between residues of the myosin head underlies the mechanism of force generation.
An increase of isometric tension with temperature is accounted for by the increased number of cross-bridges in tension generating states. Stiffness also increased with temperature, but to a lesser degree.
It has been known for some time that tension is maintained at lower energy cost in slow-twitch muscle fibres (STFs) than in fast-twitch muscle fibres (FTFs) when contracting under isometric conditions (Crow & Kushmerick, 1982; Kushmerick et al. 1992; Barclay et al. 1993; Potma et al. 1995). However, STFs work less efficiently than FTFs when shortening with a light load (Curtin & Woledge, 1978; Rome et al. 1988). This functional difference is based on a different distribution of protein isoforms. While actin is common in both fibre types, most contractile proteins in FTFs are of the fast-twitch type, and most contractile proteins in STFs are of the slow-twitch type. It has been generally hypothesized that these molecular differences are the primary cause of a difference in function. One method of characterizing the function is to study elementary steps of the cross-bridge cycle, because a difference in protein isoforms is expected to contribute to a difference in the rate constants of elementary steps. A difference in elementary steps in turn would contribute to a difference in performance of the muscle fibres. Consequently, we decided to correlate fibres of different protein isoforms with a difference in elementary steps of the cross-bridge cycle. In our previous studies (Wang & Kawai, 1996, 1997), we characterized the elementary steps of STFs at 20°C and compared the results with those from FTFs. Ideally, these studies need to be extended to physiological temperature, so that the knowledge obtained becomes more relevant to the contractile mechanisms of mammalian muscles and their diseases.
The temperature study yields yet additional information. It is possible to obtain insights into the molecular mechanisms of contraction from the temperature sensitivity of elementary steps of the cross-bridge cycle. For instance, from a temperature study in the range 5-30°C in rabit psoas (fast-twitch) fibres, Zhao & Kawai (1994) and Murphy et al. (1996) deduced thermodynamic parameters including the enthalpy, entropy and heat capacity changes, and concluded that the molecular force involved in force generation is based on the hydrophobic interaction between amino acid residues of actin and myosin. Similarly, information has been derived from temperature studies on psoas fibres in the low temperature range (Goldman et al. 1987; Ranatunga, 1984, 1989, 1996). However, attempts to study the cross-bridge kinetics at temperatures higher than 30°C have not been satisfactory, for FTFs become less stable at higher temperatures and the cross-bridge kinetics become faster, and hence more difficult to observe. STFs have the advantage over FTFs because they are more stable, particularly at high temperatures, and because they have elementary steps that are 10-30 times slower than those of FTFs (Wang & Kawai, 1996, 1997). With STFs that are more resistant to physical damage and slower enzymatic reactions, we can study the effect of temperature on the elementary steps with better time resolution.
The present study was aimed at finding a difference in thermodynamic parameters between STFs and FTFs, and to correlate the difference to a known structural (molecular) difference. We studied the effects of MgATP and phosphate (Pi) on the exponential processes of tension time course in response to sinusoidal length changes at temperatures ranging from 5 to 37°C. This is a logical extension of our previous work on cross-bridge kinetics of STFs (Wang & Kawai, 1996, 1997) to the physiological temperature range. Our results indicate that (1) the apparent rate constants and the rate constants of elementary steps of the cross-bridge cycle are more temperature sensitive in soleus STFs than in psoas; and (2) the force generation step is the most temperature sensitive step and it accompanies large enthalpy, entropy and heat capacity changes.
METHODS
Chemicals and solutions
Chemicals and solutions were prepared as described in Wang & Kawai (1996, 1997). In brief, the relaxing solution contained (mm): 5.03 EGTA, 0.97 CaEGTA (pCa 7.0), 2 MgATP, 5 free ATP, 55 potassium propionate (Kprop), 61 sodium propionate (NaProp), 10 Mops and 10 NaN3. The control activating solution contained (mm): 6 CaEGTA, 0.174 CaProp2 (pCa 4.40), 5.76 MgATP, 1.36 free ATP, 15 creatine phosphate (CP), 8 phosphate (Pi), 53 KProp, 1 NaProp, 10 Mops and 10 NaN3. The rigor solution contained (mm): 8 Pi, 76 NaProp, 103 KProp and 10 Mops. The WS solution was used to remove EGTA and MgATP before calcium activation in the MgATP study, and it contained (mm): 0.84 free ATP, 8 phosphate (Pi), 85.6 KProp, 15 NaProp, 15 CP, 10 Mops and 0.16 mg ml−1 creatine kinase (CK; Boehringer Mannheim GmbH, Germany; 1 mg = 500 U). WP solution was used to remove EGTA and Pi before calcium activation in a Pi study, and it contained (mm): 5.82 MgATP, 1.17 free ATP, 90 KProp, 1 NaProp, 15 CP, 10 Mops and 0.16 mg ml−1 CK. The CK level of all activating solutions was 0.16 mg ml−1 for a temperature of 20°C or less, and it was elevated to 0.32 mg ml−1 for studies carried out at 25°C, to 0.48 mg ml−1 for 30°C, to 0.64 mg ml−1 for 34°C and to 0.8 mg ml−1 for 37°C. The amount of CK we used is sufficient, because the activity of CK also increases with temperature with a Q10 of about 2.2 (Kuby et al. 1954). In all solutions used for experiments, the ionic strength was adjusted to 180 mm with NaProp/KProp, because this is close to physiological ionic strength (Godt & Maughan, 1990), except for the relaxing and rigor solutions that had an ionic strength of 200 mm. The pH of all the solutions was adjusted to 7.00 ± 0.01; the pH of the activating solutions did not change with temperature. EGTA, CaEGTA and Pi were added as neutral potassium salts (their approximate chemical formulae are K2H2EGTA, K2CaEGTA and K1.5H1.5PO4, respectively); MgATP and CP were added as neutral sodium salts (Na2MgATP and Na2CP); free ATP was added as a neutral sodium-potassium salt (approximately Na2K1.7H0.3ATP). Individual concentrations of multivalent ionic species were calculated using our computer program, which assumed multiple equilibria with the following apparent association constants (log values at pH 7.00): CaEGTA 6.28, MgEGTA 1.61, CaATP 3.70, MgATP 4.00, CaCP 1.15 and MgCP 1.30. These values were not corrected for the temperature change, because of a paucity of reliable data obtained under the same condition, and because the temperature may not have a large effect on these association constants. The calculated pCa of all activating solutions was 4.40, and [Mg2+] was 0.5 mm.
Fibre preparations and experimental procedure
Rabbit soleus single slow-twitch fibres (length: 2.4-4.7 mm; diameter: 72-105 μm) were obtained as described in our earlier works (Wang & Kawai, 1996, 1997). The use of rabbits conformed with the current ‘Guide for the Care and Use of Laboratory Animals’ (NIH publication DHSS/USPHS), and was approved by the Institutional Animal Care and Use Committee. Rabbits were killed by intravenous injection of sodium pentobarbital at 150 mg kg−1 in the ear vein. Both ends of fibre preparations were doubly knotted and connected to fish hook-shaped clamps of the length driver and force transducer at 20°C in the relaxing solution. The force transducer was based on an AE801 gauge element (Senso Nor a.s, Horten, Norway). According to the manufacturer's specification, the element was 4.5 % more sensitive at 5°C, and 2.3 % less sensitive at 37°C compared to the sensitivity at 20°C. However, the temperature variation in the element was approximately between 15 and 30°C because of the location of the element, and hence the maximum sensitivity variation was in the range +2.3 to -1.2 % in the experiments reported here. Because this is a small variation, we did not attempt to correct for it. The muscle length (L0) was determined as described in Wang et al. (1999) at the sarcomere length 2.5 μm, at which all experiments were performed. This method eliminates the effect of end compliance when present. The baseline record of the complex modulus was collected in the relaxing solution. This was replaced twice by wash solution (WS or WP) to remove EGTA and to add CP and CK before activation. The wash solution was replaced with an activating solution (pCa 4.40). When a steady tension developed, an experimental record of the complex modulus was collected. The fibre was then relaxed with two solution changes. Temperature was changed to the desired experimental temperature at this stage. In the experiments that studied the MgATP or Pi effect, the above sequence was repeated for solutions that contained different concentrations of MgATP or Pi. At the end of each series, temperature was brought back to 20°C, and isometric tension with the control activating solution was tested for reproducibility. Rigor was induced by replacing the control activating solution with the rigor solution (Rig) three times. When the full rigor state developed in about 1 min, the complex modulus data of the rigor state were collected. A representative experimental protocol is shown in Fig. 1.
Figure 1. A slow pen trace of length (L) and force (F) time courses demonstrating the experimental protocol.
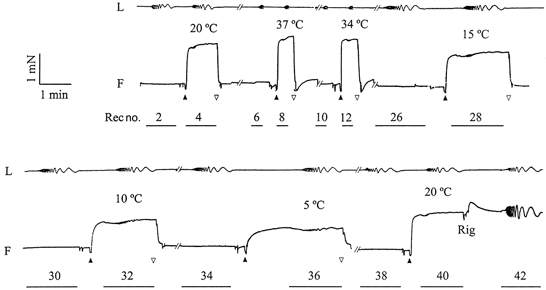
A horizontal bar below the force time course indicates where a computer record was taken and is shown with the record number. The computer record is reflected by length oscillation (0.25 %L0 peak to peak in all frequencies). Both L and F signals were filtered by 3 Hz low-pass filters before being traced by pens, and hence the amplitude at the higher frequency range appears diminished. A single fibre (rabbit soleus STF) was brought to 20°C, a computer record (no. 2) was taken during relaxation, and the fibre was washed twice with the wash solution and activated by the control activating solution (▴). Another computer record (no. 4) was taken when isometric tension reached a steady plateau. The fibre was then relaxed with the relaxing solution (▿), followed by another volume of the relaxing solution when tension returned to the resting level. This sequence was repeated for different temperatures (indicated). The temperature change took place where the trace is truncated by //, and it required 2-5 min. Three additional activations at 30, 25 and 20°C were performed between record numbers 12 and 26, but these are not shown to avoid lengthy time course records. At the end, the temperature was brought back to 20°C, and the fibre was activated again to test for the reproducibility of the data. The average tension recovery over 7 similar experiments was 102 ± 3 % (±s.e.m.). Mean tension of the control activation at 20°C was 171 ± 7 kN m−2 (n= 7). After the last control activation, the solution was replaced with the rigor solution (Rig) three times, and the complex modulus data of the rigor state were collected (Rec no. 42). At higher temperatures, lower frequencies were not used for length oscillation (see Fig. 3), and hence computer records were shorter to minimize the duration of activation.
The complex modulus Y(f) is defined as the ratio of the stress change to the strain change, and it is a function of frequency (f). Y(f) is fitted to an equation consisting of four terms, each one representing an exponential process (Wang & Kawai, 1996, 1997):
| (1) |
| (2) |
where i=√-1. Each term is called an exponential process, because its time domain expression takes the form of an exponential function. The real part of Y(f) is called the elastic modulus, the imaginary part is the viscous modulus, the absolute value of Y(f) is the dynamic modulus, and the angle defined by Y(f) on the complex plane is the phase shift. At lower temperatures, the complex modulus data were collected in frequencies ranging from 0.04 to 250 Hz, which corresponds to 0.6 ms to 4 s in time domain analysis. At higher temperatures, low frequency points were omitted to reduce the duration of the Ca2+ activation. The amplitude of the length oscillation was fixed to 0.125 %L0 at all frequencies. This length oscillation corresponds to 1.6 nm per half sarcomere. We denote the characteristic frequencies of the respective processes by a, b, c and d, and their magnitudes by A, B, C and D. H is the modulus extrapolated to the zero frequency, and it remained as a small positive value compared to Y∞ as reported (Kawai & Brandt, 1980) in all experimental conditions. The characteristic frequencies multiplied by 2π are the apparent (= observed) rate constants. Y∞ defined in eqn (2) is the complex modulus extrapolated to the infinite frequency, often referred to as ‘stiffness’. Mathematical transformation demonstrates that Y∞ corresponds to phase 1 of step analysis, process D corresponds to the fast component of phase 2, process C to the slow component of phase 2, process B to phase 3, and process A to phase 4 (Kawai & Brandt, 1980). The phases of step analysis were previously defined by Huxley & Simmons (1971). Details of the sinusoidal analysis method were published in Kawai & Brandt (1980).
Cross-bridge scheme
The rate constant results were analysed based on a cross-bridge scheme (Scheme 1), which was used for rabbit psoas FTFs (Kawai & Halvorson, 1991; Zhao & Kawai, 1993), soleus STFs (Wang & Kawai, 1996, 1997), and ferret myocardium (Kawai et al. 1993). This scheme is consistent with the effects of MgATP, MgADP and Pi on exponential processes B, C and D. This scheme has a close resemblance to that derived from solution studies of extracted contractile proteins (Taylor, 1979), except that the Pi release step is reversible in muscle fibres.
Scheme 1.
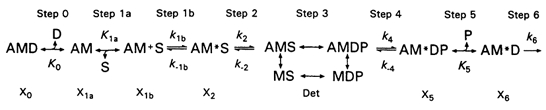
In Scheme 1, S indicates MgATP, D indicates MgADP and P indicates phosphate (Pi). In step 1a, substrate MgATP binds to the rigor-like cross-bridge state AM (actomyosin) to form a collision complex AM+S, and in step 1b, AM+S isomerizes to form the AM*S state. Cross-bridges then detach at step 2 to form the Det state, which includes weakly attached states (AMS, AMDP) and truly detached states (MS, MDP). The transition between AM+S and AM*S states (step 1b) and the transition between AM*S and Det states (step 2) can be probed by studying the effect of MgATP on the apparent rate constants 2πd and 2πc, respectively. These studies also yield the MgATP binding constant K1a to the AM state. ATP cleavage occurs in step 3. Once the thin filament is activated by Ca2+ binding to troponin C (TnC), weakly attached AMDP state isomerizes to form the strongly attached AM*DP state in step 4. It is at this step that force is generated (Fortune et al. 1991; Kawai & Halvorson, 1991; Dantzig et al. 1992; Wang & Kawai, 1997). The force generation is followed by Pi release (step 5) to form the AM*D state. The force generation and the subsequent Pi release steps can be probed by studying the effect of Pi on the apparent rate constant 2πb. b, c and d are deduced by fitting eqn (1) to the complex modulus data. AM*D slowly isomerizes to the AMD state, which limits the ATP hydrolysis rate.
RESULTS
Because about 89 % of the rabbit soleus fibres are slow-twitch type I fibres (STFs) and the remaining 11 % are fast-twitch type IIa fibres (FTFs) (Wang & Kawai, 1996), we studied only fibres which showed a slow-twitch response. Since type I fibres are 10 times slower than type IIa fibres, and the frequency data and the isoforms are perfectly correlated (Kawai & Schachat, 1984), identification of type I fibres can be readily made (Wang & Kawai, 1996).
Temperature effect on tension and stiffness
Figure 1 is a slow pen trace record demonstrating the effect of temperature from 5 to 37°C when the rabbit soleus STF was activated in the control activating solution (pCa 4.40). After nine activations (each lasting for 0.4-3 min) the tension recovery was superb in this soleus fibre and reproduced 98 % of the initial tension (Fig. 1, Rec no. 40 vs. Rec no. 4). Six additional experiments were performed, in which temperature was increased in half of the experiments and decreased in the other half. Tension of the control activation (Tc) at 20°C was 171 ± 7 kN m−2 (mean ±s.e.m., n= 7), and the recovery of the tension of the last control activation was 102 ± 3 % compared to the first control activation. The maximum calcium activated tension, stiffness (Y∞), and the tension to stiffness ratio in the control activating solution as functions of the temperature are shown in Fig. 2. Isometric tension increased with temperature in the range 5-30°C, and saturated in the range 30-37°C. Stiffness increased with temperature in the range 5-20°C and saturated in the range 20–37°C. The tension to stiffness ratio increased from 0.90 %L0 to 1.35 %L0 with temperature in the range 5-30°C, and saturated when temperature was further increased from 30 to 37°C.
Figure 2. The effect of temperature on isometric tension and stiffness.
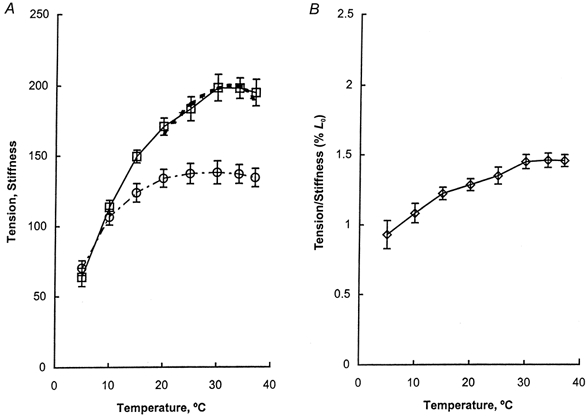
A, isometric tension (□) and stiffness Y∞ (○) are plotted against temperature. B, the tension-to-stiffness ratio (T : Y∞) is plotted against temperature. Isometric tension was obtained as in Fig. 1. Stiffness was calculated from eqn (2) with parameters deduced from fitting eqn (1) to the complex modulus data. Stiffness was then averaged for 7 experiments and plotted with s.e.m. error bars. In A, the dotted line overlapping the tension record in the range 20–37 °C represents the theoretical projection based on eqn (13). The units of tension are kN m−2, and the units of stiffness are 100 kN m−2.
Temperature effect on the complex modulus and the apparent rate constants
Figure 3 demonstrates the complex modulus data shown in the frequency plots (in A, B, D and E) and in the Nyquist plots (in C and F) during the activation with the control solution and at varying temperatures. The data from 5 to 15°C are shown in Fig. 3A-C, and the data from 20 to 37°C are shown in Fig. 3D-F. A close examination of Fig. 3F demonstrates that the Nyquist plot in the temperature range 20–37°C is typical of skeletal muscle fibres (Kawai & Schachat, 1984; Zhao & Kawai, 1993; Wang & Kawai, 1996) as represented by a work loop, but the Nyquist plots deviate from the typical shape at lower temperatures as shown in Fig. 3C. Figure 3A, B, D and E demonstrate that both the dynamic modulus vs. frequency plot and the phase shift vs. frequency plot shift to the right as the temperature is elevated, indicating that the cross-bridge kinetics became faster when temperature was increased. Equation (1) was then fitted to the data in Fig. 3 (15–37°C) to deduce the parameters of the exponential processes. Note that eqn (1) could not be fitted to some data at 15°C, and to much fewer data at 5-10°C, and hence these data could not be used for further analysis. This difficulty arose because at 5-10°C the centre of the arc that represents processes C and D is displaced below the abscissa (the arc is flattened) in the Nyquist plot (Fig. 3C) indicating the presence of distributed rate constants, and because process B is diminished or absent (Fig. 3C) at 5-10°C. These problems caused unreliable estimation of the rate constants. The theoretical projection for the data corresponding to ≥ 20°C is given in Fig. 3G, H and I.
Figure 3. Plots of complex modulus of soleus STFs.
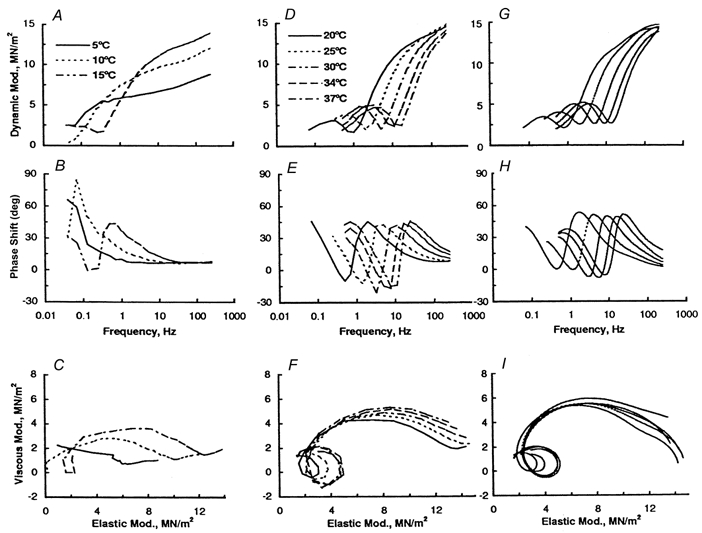
The data were obtained during control activation as shown in Fig. 1. The data obtained from 5 to 15°C are shown in A-C, and the data from 20 to 37 °C are shown in D-F. Equation (1) was fitted to the data in D-F, and a theoretical projection is given in G-I. The dynamic modulus vs. frequency plot is shown in A, D and G; the phase shift vs. frequency plot is shown in B, E and H; and the viscous modulus vs. elastic modulus plot (Nyquist plot) is shown in C, F and I. The phase shift is positive on phase advance (tension change leads length change), and negative on phase delay (tension change lags behind length change). Each curve represents the average of 7 experiments. Data were obtained from the experiments shown in Fig. 2.
The effect of temperature on four apparent rate constants is plotted in Fig. 4 for ≥ 15°C. This figure demonstrates that all the apparent rate constants, 2πa, 2πb, 2πc and 2πd, increased with temperature. The Q10 values of these rate constants in the range 20-30°C are listed in Table 1 and compared with the data obtained from rabbit psoas fibres. This table demonstrates that the Q10 for 2πb is the highest with a value of 7.4, followed by 2πa (5.7), 2πc (3.7) and 2πd (2.1), and they respectively compare to 3.4, 2.5, 1.9 and 0.9 in psoas fibres (Zhao & Kawai, 1994) in the same temperature range. Therefore, it can be concluded that the apparent rate constants in soleus STFs are more temperature sensitive than in psoas (FTFs). The apparent rate constant 2πa was not used for further analysis, because it may not be limited by an elementary step (Wang & Kawai, 1997).
Figure 4. Four apparent rate constants plotted against temperature.

The data were obtained from individual experiments similar to that shown in Fig. 3. The rate constants were then averaged for 7 experiments, except for 15°C where the data were from 4 experiments, and shown with s.e.m. error bars.
Table 1.
Q10 of the apparent rate constants
| Q10 | ||
|---|---|---|
| Rate constant | Soleus STFs | Psoas FTFs |
| 2πa | 5.66 ± 0.27 | 3.37 ± 0.21 |
| 2πb | 7.36 ± 0.15 | 2.51 ± 0.03 |
| 2πc | 3.65 ± 0.09 | 1.90 ± 0.03 |
| 2πd | 2.10 ± 0.06 | 0.89 ± 0.03 |
Data are means ± s.e.m. n= 8 for soleus and n= 9 for psoas. Temperature range 20–30°C. The psoas data were taken from Zhao & Kawai (1994) and reanalysed.
The MgATP effect on exponential processes C and D at five temperatures
To examine the temperature sensitivity of the elementary steps surrounding the substrate binding, the effect of MgATP on exponential processes C and D at different temperatures was studied in the range 0.1-5 mm. In Fig. 5A, the apparent rate constant 2πd is plotted against MgATP concentration at temperatures 20, 25, 30, 34 and 37°C. These plots reveal that the MgATP dependence of 2πd is hyperbolic: 2πd increases at low millimolar concentrations, and it approaches saturation by 2-5 mm. Such MgATP dependence can be explained by eqn (3):
| (3) |
where S is the MgATP2- (substrate) concentration, K1a is the association constant of MgATP to cross-bridges, k1b is the rate constant of the ATP-isomerization step, k−1b is the rate constant of its backward reaction, and K1b (=k1b/k−1b) is its equilibrium constant.
Figure 5. Results of the MgATP study.
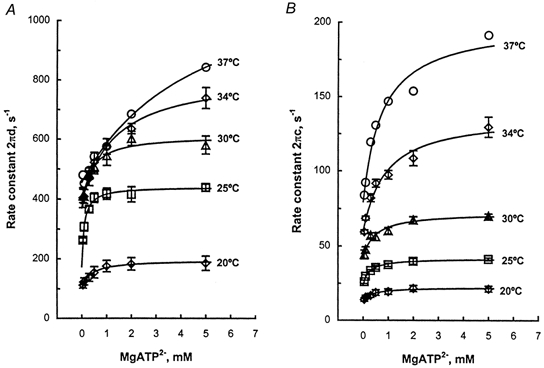
A, the apparent rate constant 2πd is plotted against MgATP concentration at five temperatures. B, the apparent rate constant 2πc is plotted against MgATP concentration at five temperatures. For these experiments, a fibre was mounted on the apparatus, the control activation was performed at 20°C, and the temperature was changed to the desired experimental temperature. This was followed by a series of activation and relaxation cycles with different MgATP concentrations (0.1, 0.2, 0.5, 1, 2 and 5 mm) in the increasing or decreasing order. At the end, the temperature was brought back to 20°C, the control activation was repeated, and this was followed by rigor induction. The fibre was then discarded. This procedure was repeated for several STFs to examine the reproducibility of the data. The data plotted are the means of 10 (20°C), 7 (25°C), 7 (30°C), 7 (34°C) and 1 (37°C) fibres with s.e.m. error bars. The continuous lines are based on eqns (3) and (4) and the best fit parameters.
In Fig. 5B, the apparent rate constant 2πc is similarly plotted. These plots reveal that the MgATP dependence of 2πc is also hyperbolic: 2πc increases at low millimolar concentrations, and approaches saturation by 2-5 mm. Such MgATP dependence can be explained by eqn (4):
| (4) |
where k2 is the rate constant of the cross-bridge detachment step 2, k−2 is the rate constant of its reversal step, and K2=k2/k−2 is the equilibrium constant. Equations (3) and (4) were derived based on a four-state model consisting of AM, AM+S, AM*S, and Det states (Scheme 1), and formulated in our earlier publications (Zhao & Kawai, 1993). Equations (3) and (4) were fitted simultaneously to the data in Fig. 5 to deduce the MgATP association constant, the rate constants and the equilibrium constants. These constants are collectively called ‘kinetic constants’, and are indicated in Scheme 1. The theoretical projections based on eqns (3) and (4) with best fit parameters are shown by the continuous lines in Fig. 5A and B. The above experiments were carried out in the presence of CP and CK, and hence the ADP concentration is maintained at less than 20 μm (Meyer et al. 1985), so that the effect of MgADP can be ignored in eqns (3) and (4).
The kinetic constants were deduced from these fittings and plotted in Fig. 6 as functions of 1000/T, where T is the absolute temperature expressed in kelvins. The Celsius temperature (°C) is also shown at the top of the figure. As seen in Fig. 6, the MgATP binding constant K1a decreased when the temperature was ≥ 25°C, indicating that MgATP binding becomes weaker at higher temperatures, i.e. this binding reaction is exothermic (ΔH° < 0). The average K1a at 20°C was slightly smaller than that at 25°C, but their difference is insignificant. It is also interesting to point out that the MgATP association constant is larger in STFs than in FTFs at all temperatures studied (compare Fig. 6A with Fig. 5A of Zhao & Kawai, 1994). The rate constant of the ATP-isomerization step (k1b) and that of its reversal step (k−1b) increased with a similar Q10 (Table 2), and thus the equilibrium constant of this reaction did not change much with temperature (Fig. 6B). Likewise, the rate constant of the cross-bridge detachment step (k2) and its reversal step (k−2) increased with temperature with a similar Q10 (Table 2), and thus the equilibrium constant K2 did not change much with temperature (Fig. 6B).
Figure 6. The temperature dependence of the kinetic constants of steps 1a-2.
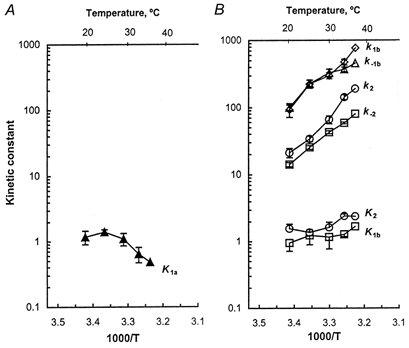
A, the MgATP association constant (K1a) is plotted against temperature. B, the rate and equilibrium constants of the ATP-isomerization step 1b and those of the cross-bridge detachment step 2 are plotted against temperature. The data were based on the MgATP study on 2πc and 2πd and averaged for 7-10 experiments, except that there was only one experiment at 37°C. The units of the association constant K1a are mm−1; the units of the rate constants k1b, k−1b, k2 and k−2 are s−1; the equilibrium constants K1b and K2 are unitless. The data are means with s.e.m. error bars.
Table 2.
Temperature sensitivity of the rate constants of elementary steps
| Soleus slow-twitch fibres | Psoas (fast-twitch fibres) | |||||||
|---|---|---|---|---|---|---|---|---|
| Rate constant | Q10 | Ea (kJ mol−1) | log10F | n | Q10 | Ea (kJ mol−1) | log10F | n |
| k1b | 4.2 ± 0.5 | 106 ± 38 | 20.7 ± 1.3 | 22 | — | — | — | — |
| k−1b | 3.2 ± 0.3 | 86 ± 23 | 17.3 ± 4.1 | 22 | — | — | — | — |
| k2 | 3.2 ± 0.3 | 86 ± 23 | 16.5 ± 4.0 | 22 | 1.8 ± 0.2 | 42 ± 14 | 9.8 ± 2.4 | 22 |
| k−2 | 3.1 ± 0.2 | 83 ± 11 | 15.9 ± 2.0 | 22 | 2.7 ± 0.1 | 73 ± 9 | 15.2 ± 1.5 | 22 |
| k4 | 6.7 ± 0.3 | 140 ± 21 | 25.7 ± 3.7 | 24 | 3.3 ± 0.1 | 89 ± 7 | 18.0 ± 1.2 | 24 |
| k−4 | 2.5 ± 0.3 | 69 ± 21 | 13.0 ± 0.5 | 24 | 1.5 ± 0.2 | 28 ± 16 | 6.9 ± 2.9 | 24 |
The log form of eqn (7) was fitted to the rate constant data to deduce activation energy (Ea) and log F, where F is the frequency factor in s−1. The temperature range used is 20–30°C. The data are best fit values ± 95% confidence limits, and the number of fibres (data points) used is indicated by n. The psoas data were taken from Zhao & Kawai (1994), and reanalysed for the same temperature range.
the phosphate (pi) effect on exponential process B at five temperatures
To characterize the temperature dependence of the force generation step 4 and Pi release step 5, the effect of Pi on process B was studied at five temperatures. Isometric tension declined as the Pi concentration was increased from 0 to 30 mm as reported in Wang & Kawai (1997) for 20°C, and this trend did not change as the temperature was varied. Stiffness followed the same pattern as isometric tension. In Fig. 7 the apparent rate constant 2πb is plotted against the Pi concentration at temperatures 20, 25, 30, 34 and 37°C. These plots reveal that the Pi dependence is hyperbolic: 2πb increases in the range of 0-8 mm Pi, and it approaches saturation at higher Pi concentrations. Such Pi dependence can be explained by eqn (5):
| (5) |
where
| (6) |
and P represents the Pi concentration. Equation (5) was derived based on a three-state model consisting of AMDP, AM*DP, and AM*D and a rapid equilibrium to the left of the AMDP state as previously described (Kawai & Halvorson, 1991; Dantzig et al. 1992). In Fig. 7 the continuous lines represent theoretical projections based on eqn (5). σ was calculated by eqn (6) with K1a, K1b and K2 obtained from the MgATP study and S= 5 mm. σ remained in the range 0.44 and 0.57, and it did not change much with temperature. The kinetic constants of the elementary steps are plotted in Fig. 8 as functions of 1000/T. As seen in this figure the rate constant of the force generation step (k4) increased steeply with temperature. It can also be seen that the rate constant of its reversal step (k−4) increased with temperature, but to a lesser extent than k4. Consequently the equilibrium constant K4 increased significantly with temperature (Fig. 8). The Pi association constant (K5) did not change much with temperature (Table 2). Q10 for k4 was 6.7, and Q10 for k−4 was 2.5 in the range 20-30°C. The corresponding Q10 values for rabbit psoas were 3.3 and 1.5, respectively (Table 2). From these results we conclude that the force generation step and its reversal step are more temperature sensitive in soleus STFs than in psoas FTFs.
Figure 7. The apparent rate constant 2πb is plotted against Pi concentration at five temperatures.
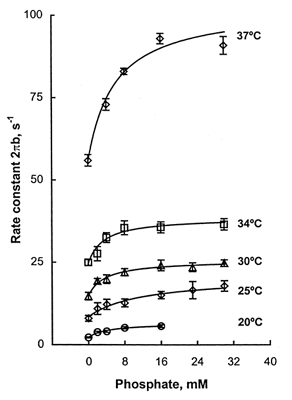
For these experiments, a fibre was mounted on the apparatus, the control activation was performed at 20°C, and the temperature was changed to the desired experimental temperature. This was followed by a series of activation and relaxation cycles with different Pi concentrations (0, 2, 4, 8, 16, 23 and 30 mm) in increasing or decreasing order. At the end, the temperature was brought back to 20°C, the control activation was repeated, and this was followed by rigor induction. The fibre was then discarded. This procedure was repeated for several STFs. The data are means with s.e.m. error bars. The number of fibres used was 10 (20°C), 7 (25°C), 7 (30°C), 7 (34°C) and 8 (37°C), except there were only 4 experiments for 30 mm Pi at 37°C. The continuous curves are based on eqn (5) and the best fit parameters.
Figure 8. The temperature sensitivity of the kinetic constants of steps 4 and 5.
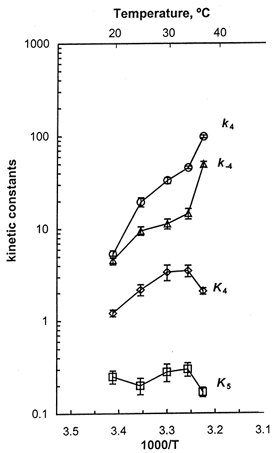
The data were based on the Pi study on 2πb, and are means of 7-10 experiments with s.e.m. error bars. The units of k4 and k−4 are s−1, K4 is unitless, and the units of K5 are mm−1.
Further analysis of the temperature effect
Once the rate and equilibrium constants are obtained, one can calculate the activation energy, the standard enthalpy change, and the standard entropy change of each reaction step. The activation energy (Ea) and the frequency factor (F) were calculated based on the Arrhenius equation (eqn (7)), and listed in Table 2:
| (7) |
where k is the rate constant of an elementary step, R is the gas constant, and T is absolute temperature. The activation energy was largest (140 kJ mol−1) for the force generation step; it was 80-110 kJ mol−1 for ATP isomerization and cross-bridge detachment steps; and it was smallest (69 kJ mol−1) for the reversal of the force generation step. The activation energy of each elementary step of soleus slow-twitch fibres is 1.1-2.5 times larger than that of psoas FTFs (Table 2).
The standard enthalpy change (ΔH°), the standard entropy change (ΔS°), and the standard free energy change (ΔG°) were calculated by the Van't Hoff equation:
| (8) |
| (9) |
where K is an equilibrium constant. Equation (8) was fitted to the equilibrium constant data in Fig. 6 and 8, and ΔH° and ΔS° were deduced and listed in Table 3. This table shows that ΔH° and ΔS° are by far the largest and are positive in step 4 (force generation step), followed by step 2b (ATP-isomerization step), but ΔH° and ΔS° are close to 0 for the Pi binding and cross-bridge detachment steps. ΔH° is a negative number for the ATP binding step.
Table 3.
Equilibrium constants and their standard enthalpy and entropy changes in soleus STFs
| Equilibrium constant | Value at 25°C | Q10 | ΔH° (kJ mol−1) | ΔS° (J mol−1 K−1) |
|---|---|---|---|---|
| K1a | 1.41 ± 0.13 mM−1 (7) | 0.4 | −77 | −255 |
| K1b | 1.24 ± 0.34 (7) | 1.3 | 20 | 65 |
| K2 | 1.37 ± 0.15 (7) | 1.0 | 3 | 14 |
| K4 | 2.2 ± 0.3 (7) | 2.6 | 71 | 244 |
| K5 | 0.20 ± 0.04 mM−1 (7) | 1.0 | 3 | −4 |
Equation (8) was fitted to the equilibrium constant data in Figs 6 and 8 to deduce ΔH° and ΔS° in the range 20–30°C, except for K1a for which they were calculated in the range 25–34°C. Q10 was on eqn (7). The results were based on 7–11 fibres at each temperature.
Because the large positive ΔH° and ΔS° values imply a formation of hydrophobic interaction (Frank & Evans, 1945; Privalov & Gill, 1988), which accompanies burial of a large surface area, we used the modified Van't Hoff equation (Murphy et al. 1996) and fitted it to K4:
| (10) |
where ΔCp is the heat capacity change, and Tr is an arbitrary reference temperature which we chose as 25°C. The derivation of eqn (10) is based on the first-order Taylor expansion of ΔH° and ΔS° around Tr:
| (11) |
| (12) |
i.e. ΔH° is a linear function of the temperature, ΔS° is a linear function of lnT, and ΔCp is their common coefficient. ΔHr° and ΔSr° are respective values of ΔH° and ΔS° at temperature Tr. Figure 9 is a plot of K4 against 1000/T, and the continuous line represents the theoretical projection based on eqn (10). From the fitting, we found ΔH° to be 72 ± 20 kJ mol−1, ΔS° to be 247 ± 66 kJ mol−1 K−1 and ΔCp to be -12.4 ± 5.0 kJ mol−1 K−1 (Table 4). ΔCp does not depend on the choice of Tr, but ΔH° and ΔS° change with temperature (eqns (11) and (12)). The data are best fit values ± 95 % confidence limits based on Student's t test. Thus, the force generation step 4 is an endothermic reaction (ΔH° > 0), and it has a large entropy increase. These numbers are comparable to those obtained from rabbit psoas calculated for the same Tr (Table 4). ΔCp for the soleus is negative and twice as large as that for the psoas, but the confidence limit is much larger for the soleus than the psoas, and hence ΔCp of soleus and psoas may not be different. The larger confidence limit was caused by a larger scatter of the data in soleus fibres. A large negative ΔCp would imply burial of a large surface area.
Figure 9. Fitting of modified Van't Hoff eqn (10) to the equilibrium constant K4.
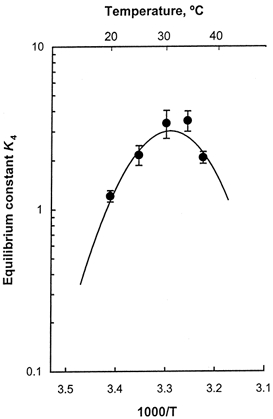
The continuous line represents the theoretical curve with best fit parameters. The data are the same as K4 in Fig. 8.
Table 4.
Thermodynamic parameters of the equilibrium constants of the force generation step in soleus STFs and psoas
| Fibre type | ΔHr° (kJ mol−1) | ΔSr° (J mol−1 K−1) | ΔCp (kJ mol−1 K−1) | n |
|---|---|---|---|---|
| Soleus STFs | 72 ± 20 | 247 ± 66 | −12.4 ± 5.0 | 39 |
| Psoas (FTFs) | 60 ± 12 | 211 ± 42 | −6.4 ± 1.5 | 55 |
ΔHr°, standard enthalpy change at 25°C; ΔSr°, standard entropy change at 25°C; ΔCp, heat capacity change. Equation (10) was fitted to the equilibrium constant data (K4) to deduce ΔHr°, ΔSr° and ΔCp by taking 25°C as the reference temperature (Tr= 25°C). Data are best fit values ± 95% confidence limits. While ΔCp is a constant of temperature, ΔG°, ΔH° and ΔS° change with temperature according to eqns (8)–(11). The psoas data were taken from Zhao & Kawai (1994) and reanalysed for the same Tr. Thirty-nine fibres were used for soleus experiments, and 55 fibres were used for psoas experiments.
Prediction of isometric tension as a function of temperature
To examine whether the change in the kinetic constants can explain the temperature effect on isometric tension, we deduced the steady-state probability of each cross-bridge state at different temperatures based on the equilibrium constants obtained (Fig. 6 and 8) and eqns (20)-(27) of Kawai & Zhao (1993). The calculation was based on the standard control activating condition (5 mm MgATP, 8 mm Pi). According to this calculation the fraction of all attached cross-bridges (X1a+ X1b+ X2+ X5+ X6) is 76 % (20°C), 83 % (25°C), 86 % (30°C), 85 % (34°C) and 81 % (37°C). Theoretical tension is then calculated based on eqn (13) assuming that isometric tension can be modelled as a linear combination of the probabilities of cross-bridge states (Kawai & Zhao, 1993):
| (13) |
where the linear coefficient Ti is the value of tension if 100 % of the cross-bridges are in state Xi. The Ti values of soleus STFs were empirically determined (Wang & Kawai, 1997) and are: T1a=T1b= 1.12Tc, T2= 0.81Tc and T5=T6= 1.29Tc, where Tc is isometric tension in the control activating condition. Tc is taken as a constant measured at 20°C, but the equations for Ti do not imply that Ti is a function of temperature. The theoretical tension values based on eqn (13) are entered in Fig. 2A as a dotted line along with isometric tension, assuming that Ti does not change with temperature. As seen in this figure, the theoretical tension matches well with the experimental data, which is consistent with the idea that the number of tension generating cross-bridges increases with temperature, but tension per cross-bridge state remains unchanged.
Adequacy of the ATP regenerating system
To test whether the ATP regenerating system used in the current report is adequate, we studied the effect of CK and CP on 2πb and 2πc at three temperatures, 20, 30 and 37°C. Experiments were carried out at 1 mm MgATP2-, at which 2πc (or 2πb) is most sensitive to a change in the MgATP2- concentration (Fig. 5). 2πc (or 2πb) would decrease if the MgATP2- concentration was decreased, or if the MgADP− concentration was increased (Zhao & Kawai, 1993; Wang & Kawai, 1996). The effect of CK was tested by doubling its level, and the effect of CP was tested by increasing its concentration from 15 mm (standard) to 25 mm. Then the ratio of 2πc (or 2πb) after:before the increase was calculated and summarized in Table 5. If the ATP regenerating system were not adequate, the ratio would become > 1. The fact that the ratio remained < 1 (Table 5) demonstrates that the regenerating system was adequate in our experimental conditions.
Table 5.
Test for adequacy of the ATP-regenerating system
| Test for creatine kinase (CK) | Test for creatine phosphate (CP) | |||||
|---|---|---|---|---|---|---|
| T (°C) | CK (per ml) | Ratio of 2πc | Ratio of 2πb | CP | Ratio of 2πc | Ratio of 2πb |
| 20 | 0.32 mg/0.16 mg | 1.01 ± 0.08 (6) | 0.93 ± 0.23 (4) | 25 mM/15 mM | 1.02 ± 0.06 (6) | 1.01 ± 0.08 (5) |
| 30 | 0.96 mg/0.48 mg | 0.94 ± 0.05 (9) | 0.94 ± 0.11 (9) | 25 mM/15 mM | 0.95 ± 0.06 (9) | 1.00 ± 0.10 (8) |
| 37 | 1.6 mg/0.8 mg | 0.95 ± 0.13 (7) | 0.88 ± 0.15 (7) | 25 mM/15 mM | 0.97 ± 0.07 (7) | 0.98 ± 0.11 (6) |
These experiments were performed by comparing the apparent rate constant 2πc (or 2πb) before and after the creatine kinase (CK) concentration was doubled (2 ×), or creatine phosphate (CP) concentration was increased from 15 mM to 25 mM (1.7 ×). Experiments were carried out in the order (standard) ± 2 ± CK ± 1.7 ± CP ± (standard). 2πc (or 2πb) was deduced at each condition and 2πc (or 2πb) at 2 ± CK (or 1.7 ± CP) was divided by 2πc (or 2πb) of the standard to calculate the ratio. The ratio was then averaged for the number of preparations in parentheses, and shown with the standard deviation. If the ATP regenerating system is not adequate, the ratio becomes > 1. The fact that the ratio remained ± 1 indicates that the ATP regenerating system was adequate at all conditions tested. The standard deviation was larger for 2πb than for 2πc, because B < C (magnitudes), and hence the estimate of c was more accurate than that of b. The solution composition was (mM): 15 Na2CP, 6 K2CaEGTA, 0.02 CaProp2, 1.44 Na2MgATP, 0.36 MgProp2, 8 K1.5PO4, 10 NaN3, 32 NaProp, 45 KProp and 10 Mops; or 25 Na2CP, 6 K2CaEGTA, 0.02 CaProp2, 1.43 Na2MgATP, 0.42 MgProp2, 8 K1.5Pi, 10 NaN3, 12 NaProp, 35 KProp and 10 Mops. Ionic strength of both solutions was 180 mM, pCa 4.40, MgATP2– was 1.00 mM, Mg2+ was 0.50 mM, and pH was adjusted to 7.00.
DISCUSSION
Difference between STFs and FTFs at the molecular level
One purpose of the present study was to correlate the functional difference between STFs and FTFs with the known structural (molecular) difference. Therefore, it is necessary to discuss the difference between STFs and FTFs at the molecular level. Although the two muscle types use the same class of contractile proteins, their difference lies in protein isoforms. In fact, the mechanism of the high adaptability of a specialized muscle function is the result of a cell's ability to generate isoforms. Myosin and the thin filament proteins tropomyosin (Tm), TnT, TnI, and TnC are present in different isoforms in different fibre types, although actin is common. FTFs consist of a fast myosin heavy chain (MHC), three fast myosin light chains (MLCs), α- and β-Tm, and fast TnI, TnT and TnC. STFs consist of a slow MHC, two slow MLCs, β-, γ- and δ-Tm, and slow TnI, TnT and TnC. Myosin ATPase activity is largely determined by MHC isoforms (Pette & Staron, 1990; Moss et al. 1995; Schiaffino & Reggiani, 1996; Weiss et al. 1999), and hence it is likely that a difference in MHC is the major factor in contributing to the difference in the rate constant of an elementary step. A close examination of the amino acid sequence of MHCs of mammalian striated muscles reveals that the primary sequence is highly conserved among MHC isoforms. However, several regions are significantly different. These include limited regions of the myosin head, the α-helix in the neck region, the hinge between S2 and LMM, and the C-terminal of the MHC (McNally et al. 1989; Moore et al. 1992; Schiaffino & Reggiani, 1996; Weiss et al. 1999). Of particular interest are the two surface loops near the ATP-binding site (loop 1) and actin-binding site (loop 2) in the myosin head. These loops vary in length and amino acid sequence. This variation may determine the ATPase activity and the sliding velocity of the thin filament in vitro, and the maximum velocity of shortening in vivo (Spudich, 1994; Schiaffino & Reggiani, 1996; Weiss et al. 1999). One site with large variability is the junction between the 50 and 20 kDa domains (loop 2) in the myosin head. This site is located at the actin-myosin interface (Rayment et al. 1993a,b), and may contribute to a different ATPase activity (Uyeda et al. 1994).
Tension and stiffness
Isometric tension in the control activating solution of soleus STFs increased when temperature was raised from 5 to 30°C, and plateaued over a further rise to 37°C (Fig. 2A). This observation is consistent with that of Ranatunga (1996) on rabbit psoas and soleus fibres. Stiffness increased similarly to tension but to a lesser extent, and the tension-to-stiffness ratio increased in the low temperature range and saturated in the high temperature range (Fig. 2). These results are generally consistent with previous reports on mammalian muscle fibres (Ranatunga & Wylie, 1983; Stephenson & Williams, 1985; Goldman et al. 1987; Zhao & Kawai, 1994; Ranatunga, 1996; Galler & Hilber, 1998), frog tibialis anterior fibres (Ford et al. 1977) and toad muscles (Stephenson & Williams, 1985). The plateau at the high temperature range in the tension or stiffness plot is not caused by rigor cross-bridges, because the parameter H (eqn (1)) did not increase in the high temperature range. H would increase if non-cycling cross-bridges were formed.
Complex modulus and exponential processes
Figure 3C demonstrates that at lower temperatures such as 5 and 10°C, the Nyquist plot of soleus fibres activated with saturating Ca2+ does not exhibit the work loop as seen at higher temperatures (Fig. 3F; Kawai & Schachat, 1984; Wang & Kawai, 1996). This observation may mean that muscle contracts somewhat differently at lower temperatures.
Figure 4 shows that all the apparent rate constants significantly increased with an increase in temperature, which demonstrates that the rate constants are from typical enzyme reactions. The results are similar to those on rabbit psoas fibres (Zhao & Kawai, 1994), except that a higher temperature sensitivity was observed in soleus STFs than in psoas (Table 1). This result is consistent with a higher temperature sensitivity of the maximum shortening velocity in STFs than in FTFs (Ranatunga, 1984). It is possible that the slower cross-bridge kinetics and higher temperature sensitivity of the apparent rate constants may be correlated to a difference in loop 2 of the MHC of type I and type IIb fibres (Murphy & Spudich, 1999; Weiss et al. 1999).
One advantage in studying soleus STFs is that we can obtain the cross-bridge kinetics at physiological temperature. We found that the cross-bridge Scheme 1 derived at 20°C is well suited to describe the cross-bridge kinetics at the physiological temperature. A comparison of the kinetic constants of soleus STFs at 37°C (Fig. 4, 6 and 8) with those from psoas (Zhao & Kawai, 1994) demonstrates that the cross-bridge kinetics of STFs at the physiological temperature are close to the cross-bridge kinetics of psoas at 15-20°C. One such example is a presence of the work loop in the Nyquist plot in soleus STFs (Fig. 3F) as in psoas fibres.
Nucleotide binding step
It is interesting to point out that the MgATP2- association constant is 2-3 times larger in STFs than in FTFs in the temperature range 20-30°C (compare Fig. 6A with Fig. 5A of Zhao & Kawai, 1994). We infer from this observation that the structure of the nucleotide binding site or its microenvironment is different in the two fibre types. The nucleotide binding site forms a pocket in the N-terminal 25 kDa domain of the myosin head (Rayment et al. 1993b). The pocket is nearly perfectly conserved between type I (rabbit soleus STFs) and type IIb (rabbit psoas) myosin, and hence it may not be the pocket structure that determines the difference in the binding affinity. In terms of the microenvironment, it is known that loop 1 comes close to the pocket (Rayment et al. 1993b), and in fact, there is a significant difference in loop 1 between the two myosin isoforms (Weiss et al. 1999). In particular, the net charge of loop 1 is +2 and more positive in STF myosin (3 K+, 1 R+, 2 E−) than in FTF myosin (4 K+, 3 D−) with the net charge of +1, and thereby STF myosin should attract negatively charged substrate (MgATP2-) twice as much as FTF myosin. This mechanism would result in a higher MgATP association constant in STFs than in FTFs as observed. In fact, it has been suggested that the different length and/or the flexibility of loop 1 may cause the different nucleotide binding affinity and the ATP cleavage rate (Kelly et al. 1993; Rovner et al. 1997; Sweeney et al. 1998; Weiss et al. 1999). The higher nucleotide affinity may also be correlated with the fact that loop 1 is less flexible in ST myosin than in FT myosin (Weiss et al. 1999).
Figure 6A demonstrates that the MgATP2- binding affinity (K1a) for cross-bridges becomes weaker with an increase in temperature (exothermic), as has been the case in FTFs (Zhao & Kawai, 1994). The decrease in K1a may be correlated with the increased isometric tension. Such correlation was demonstrated in a variety of conditions that change isometric tension: 2,3-butanedione monoxime (BDM), [5-(1-(3,4-dimethoxybenzoyl)-1,2,3,4-tetrahydro-6-chinolyl)-6-methyl-3,6-dihydro-2H-1,3,4-thiadiazin-2-one]-53998 (EMD), TnC extraction and temperature change as summarized in Zhao et al. (1996). If the position of loop 1 is coupled with the amount of tension in the myosin head, this mechanism would cause a change in the MgATP2- binding constant.
The rate constants of both cross-bridge detachment step 2 (k2) and its reversal step (k−2) increase similarly with temperature (Fig. 6B). Therefore, the equilibrium constant of the cross-bridge detachment step (K2) does not change much with temperature. This finding is similar to that obtained in psoas (Zhao & Kawai, 1994). As seen in Table 2, the rate constants k2 and k−2 are more temperature sensitive in soleus than in psoas. This finding is in accord with the observation that the apparent rate constant 2πc is more temperature sensitive in soleus STFs than in psoas fibres (Table 1).
Force generation step
Step 4 is the most temperature sensitive step among the elementary steps in the cross-bridge cycle (Table 2 and Fig. 8), represented by a high Q10 (6.7) and a large activation energy (140 kJ mol−1) that corresponds to 2-2.5 times the free energy liberated by ATP hydrolysis. This finding is consistent with our earlier studies on rabbit psoas (Zhao & Kawai, 1994). Step 4 corresponds to the force generation step in muscle fibres (Kawai & Halvorson, 1991; Fortune et al. 1991; Dantzig et al. 1992; Kawai & Zhao, 1993; Wang & Kawai, 1997). The equilibrium constant (K4) of this step increases with temperature in the range 20-30°C, saturates in the range 30-34°C, and decreases for further increases in temperature to 37°C (Fig. 8). The presence of the peak in K4 is predicted by the modified Van't Hoff equation (eqn (10)) and is shown by the continuous line in Fig. 9. The force generation step has a high ΔH° indicating that this step is an endothermic reaction and absorbs 72 ± 20 kJ mol−1 of heat at 25°C (Table 4). This observation is consistent with a large force increase with a temperature increase in the range 5-30°C in rabbit soleus fibres (Fig. 2A) and in rabbit psoas fibres (Goldman et al. 1987; Bershitsky & Tsaturyan, 1992; Zhao & Kawai, 1994; Ranatunga, 1996). This is also consistent with solution studies of extracted proteins demonstrating that the actin-myosin binding is an endothermic reaction (Highsmith, 1977). In soleus STFs the force generation step accompanies a large entropy increase corresponding to 247 ± 66 J mol−1 K−1 at 25°C (Table 4). Therefore, it can be concluded that the force generation step is an entropy-driven reaction. This is consistent with the conclusion obtained in psoas fibres (Table 4).
Our previous studies on psoas that demonstrated large positive ΔH° and ΔS°, and large negative ΔCp of the force generation step led us to conclude that the hydrophobic interaction between actin and myosin underlies force generation (Murphy et al. 1996). We found that this mechanism is also true in soleus STFs (Table 4). Water molecules are structured around hydrophobic amino acid residues, and this water structure is removed on the formation of the hydrophobic interaction, which accounts for a large reduction of the heat capacity change (ΔCp). Based on the crystallographic structure of myosin and actin it was proposed that force is generated as a result of the stereospecific interaction occurring on myosin as a helix (G516-F542)-loop (P543-T546)-helix (D547-H558) motif, which comes close to actin residues A144-T148 and I341-Q354 (Rayment et al. 1993a; Rayment, 1996). The stereospecific interaction is primarily hydrophobic, and residues P529, M530, I535, M541, F542, P543 of myosin, and residues A144, I341, I345, L349, F352 of actin are involved (Rayment et al. 1993a). Mutational studies were carried out to examine the structure-function relationship of these hydrophobic residues. Miller et al. (1996) demonstrated the importance of I341 of actin in myosin binding, actin-activated S1 ATPase, and actin filament sliding in the in vitro motility assay. Additional hydrophobic interaction between segment R405-K415 of myosin and segment P332-E334 of actin is also suggested (Rayment et al. 1993b). It is interesting to note that these hydrophobic residues are conserved between type I and type IIb fibres (Weiss et al. 1999), and that the ΔH° and the ΔS° values associated with the force generation step in the two fibre types are similar (Table 4). The formation of these hydrophobic interactions probably corresponds to step 4, because a large enthalpy increase, a large entropy increase, and a large heat capacity decrease are observed with this step.
An additional mechanism to account for the large change in ΔH°, ΔS° and ΔCp is that the myosin cleft may close with force generation. Based on the thermodynamic parameters in rabbit psoas fibres, Murphy et al. (1996) calculated the burial of surface area to be 80 nm2, which is larger than the presumed actin-myosin interface, and hence other surface area must be involved. A closure of the cleft between the upper and lower 50 kDa domains is a likely candidate for the burial of a large surface area represented by a large negative ΔCp. Another candidate that cannot be ruled out is the conformational change in actin.
As discussed, the equilibrium constant of step 4 (K4) increases with temperature up to 30°C. This will result in a significant increase in the number of cross-bridges in AM*DP and AM*D states. Because both AM*DP and AM*D states bear tension, tension will increase as a result of the temperature increase. The good fit of the theoretical curve (Fig. 2A) to the isometric tension data is consistent with the mechanism that more tension-generating cross-bridges are formed at higher temperature, and that the tension per cross-bridge remains the same when temperature is changed. This mechanism is consistent with earlier studies carried out on rabbit psoas fibres (Zhao & Kawai, 1994) and on single molecules (Kawai et al. 2000; Kawaguchi & Ishiwata, 2000). As seen in Table 2, both the force generation step (k4) and its reversal step (k−4) in soleus STFs are more temperature sensitive than those in psoas. This finding is in accord with the observation that 2πb is more temperature sensitive in soleus than in psoas (Table 1).
Unlike the nucleotide binding step, which is sensitive to temperature, the Pi binding step (K5) is not very sensitive to temperature (Fig. 8). These observations are similar to our earlier observations which showed that K5 was little affected by osmotic compression (Zhao & Kawai 1993), BDM treatment, EMD treatment, or TnC extraction (Zhao et al. 1996, and see reference therein), whereas the nucleotide binding step was significantly affected by them. These results indicate that the Pi release channel of myosin is controlled differently from the nucleotide binding site. This mechanism is consistent with the hypothesis that myosin is a ‘back door’ enzyme in which Pi is released from the opposite side of the ATP binding site (Yount et al. 1995).
Acknowledgments
We are grateful to Drs Kuda W. Ranatunga and Stefan Galler for their critical reading of the manuscript and useful suggestions. We would like to thank Ms Meghan L. Stevenson for her excellent technical assistance, and Dr Wei Ding for his help with computer graphics. This work was supported by grants IBN 93-18120, IBN 96-03858 and IBN 98-14441 from the National Science Foundation, and the Grant-in-Aid 99-50437N from the American Heart Association National Center. G.W. would like to dedicate this paper to Hui Yu and Zoe Q. Wang.
References
- Barclay CJ, Constable JK, Gibbs CL. Energetics of fast- and slow-twitch muscles of the mouse. Journal of Physiology. 1993;472:61–80. doi: 10.1113/jphysiol.1993.sp019937. [DOI] [PMC free article] [PubMed] [Google Scholar]
- Bershitsky SY, Tsaturyan AK. Tension responses to joule temperature jump in skinned rabbit muscle fibres. Journal of Physiology. 1992;447:425–448. doi: 10.1113/jphysiol.1992.sp019010. [DOI] [PMC free article] [PubMed] [Google Scholar]
- Crow MT, Kushmerick MJ. Chemical energetics of slow- and fast-twitch muscles of the mouse. Journal of General Physiology. 1982;79:147–166. doi: 10.1085/jgp.79.1.147. [DOI] [PMC free article] [PubMed] [Google Scholar]
- Curtin NA, Woledge RC. Energy changes and muscular contraction. Physiological Review. 1978;58:690–761. doi: 10.1152/physrev.1978.58.3.690. [DOI] [PubMed] [Google Scholar]
- Dantzig J, Goldman Y, Millar NC, Lacktis J, Homsher E. Reversal of the cross-bridge force-generation transition by the photogeneration of phosphate in rabbit psoas muscle fibers. Journal of Physiology. 1992;451:247–278. doi: 10.1113/jphysiol.1992.sp019163. [DOI] [PMC free article] [PubMed] [Google Scholar]
- Ford LE, Huxley AF, Simmons RM. Tension responses to sudden length change in stimulated frog muscle fibres near slack length. Journal of Physiology. 1977;269:441–515. doi: 10.1113/jphysiol.1977.sp011911. [DOI] [PMC free article] [PubMed] [Google Scholar]
- Fortune NS, Geeves MA, Ranatunga KW. Tension responses to rapid pressure release in glycerinated rabbit muscle fibers. Proceedings of National Academy of Sciences of the USA. 1991;88:7323–7327. doi: 10.1073/pnas.88.16.7323. [DOI] [PMC free article] [PubMed] [Google Scholar]
- Frank HS, Evans MW. Free volume and entropy in condensed system. III. Entropy on binary liquid mixtures; partial molar entropy in dilute solutions; structure and thermodynamics in aqueous electrolytes. Journal of Chemistry and Physics. 1945;13:507–532. [Google Scholar]
- Galler S, Hilber K. Tensions/stiffness ratio of skinned rat skeletal muscle fibre types at various temperatures. Acta Physiologica Scandinavica. 1998;162:119–126. doi: 10.1046/j.1365-201X.1998.0272f.x. [DOI] [PubMed] [Google Scholar]
- Goldman YE, McCray JA, Ranatunga KW. Transient tension changes initiated by laser temperature jumps in rabbit psoas muscle fibres. Journal of Physiology. 1987;392:71–95. doi: 10.1113/jphysiol.1987.sp016770. [DOI] [PMC free article] [PubMed] [Google Scholar]
- Highsmith S. The effects of temperature and salts on myosin subfragment-1 and F-actin association. Archives of Biochemistry and Biophysics. 1977;180:404–408. doi: 10.1016/0003-9861(77)90054-6. [DOI] [PubMed] [Google Scholar]
- Huxley AF, Simmons RM. Proposed mechanism of force generation in striated muscle. Nature. 1971;233:533–538. doi: 10.1038/233533a0. [DOI] [PubMed] [Google Scholar]
- Kawai M, Brandt PW. Sinusoidal analysis: a high resolution method for correlating biochemical reactions with physiological processes in activated skeletal muscles of rabbit, frog and crayfish. Journal of Muscle Research and Cell Motility. 1980;1:279–303. doi: 10.1007/BF00711932. [DOI] [PubMed] [Google Scholar]
- Kawai M, Halvorson HR. Two step mechanism of phosphate release and the mechanism of force generation in chemically skinned fibers of rabbit psoas muscle. Biophysical Journal. 1991;59:329–342. doi: 10.1016/S0006-3495(91)82227-5. [DOI] [PMC free article] [PubMed] [Google Scholar]
- Kawai M, Kawaguchi K, Saito M, Ishiwata S. Temperature change does not affect force between single actin filaments and HMM from rabbit muscles. Biophysical Journal. 2000;78:3112–3119. doi: 10.1016/S0006-3495(00)76848-2. [DOI] [PMC free article] [PubMed] [Google Scholar]
- Kawai M, Saeki Y, Zhao Y. Crossbridge scheme and the kinetic constants of elementary steps deduced from chemically skinned papillary and trabecular muscles of the ferret. Circulation Research. 1993;73:35–50. doi: 10.1161/01.res.73.1.35. [DOI] [PubMed] [Google Scholar]
- Kawai M, Schachat FH. Differences in the transient response of fast and slow skeletal muscle fibers: correlations between complex modulus and myosin light chain. Biophysical Journal. 1984;45:1145–1151. doi: 10.1016/S0006-3495(84)84262-9. [DOI] [PMC free article] [PubMed] [Google Scholar]
- Kawai M, Zhao Y. Cross-bridge scheme and force per cross-bridge state in skinned rabbit psoas muscle fibers. Biophysical Journal. 1993;65:638–651. doi: 10.1016/S0006-3495(93)81109-3. [DOI] [PMC free article] [PubMed] [Google Scholar]
- Kawaguchi K, Ishiwata S. Temperature dependence of force, velocity, and processivity of single kinesin molecules. Biochemical and Biophysical Research Communications. 2000;272:895–899. doi: 10.1006/bbrc.2000.2856. [DOI] [PubMed] [Google Scholar]
- Kelley CA, Takahashi M, Yu JH, Adelstein RS. An insert of seven amino acids confers functional differences between smooth muscle myosins from the intestines and vasculature. Journal of Biological Chemistry. 1993;268:12828–12854. [PubMed] [Google Scholar]
- Kushmerick MJ, Meyer RA, Brown TR. Regulation of oxygen consumption in fast- and slow-twitch muscle. American Journal of Physiology. 1992;263:598–606. doi: 10.1152/ajpcell.1992.263.3.C598. C. [DOI] [PubMed] [Google Scholar]
- McNally EM, Kraft R, Bravo-Zehnder MH. Full-length rat α and β cardiac myosin heavy chain sequences. Journal of Molecular Biology. 1989;120:665–671. doi: 10.1016/0022-2836(89)90141-1. [DOI] [PubMed] [Google Scholar]
- Meyer RA, Brown TR, Kushmerick MJ. Phosphorus nuclear magnetic resonance of fast- and slow-twitch muscle. American Journal of Physiology. 1985;248:279–287. doi: 10.1152/ajpcell.1985.248.3.C279. C. [DOI] [PubMed] [Google Scholar]
- Miller CJ, Doyle TC, Bobkova E, Bostein D, Reisler E. Mutational analysis of the role of hydrophobic residues in the 338–348 helix on actin in actomyosin interactions. Biochemistry. 1996;35:3670–3676. doi: 10.1021/bi952645v. [DOI] [PubMed] [Google Scholar]
- Moore LA, Tidyman WE, Arrizubieta MJ, Bandman E. Gene conversions within the skeletal myosin multigene family. Journal of Molecular Biology. 1992;223:383–387. doi: 10.1016/0022-2836(92)90741-2. [DOI] [PubMed] [Google Scholar]
- Moss RL, Diffee GM, Greaser ML. Contractile properties of skeletal muscle fibers in relation to myofibrillar protein isoforms. Reviews of Physiology, Biochemistry and Pharmacology. 1995;126:1–63. doi: 10.1007/BFb0049775. [DOI] [PubMed] [Google Scholar]
- Murphy CT, Spudich JA. The sequence of the myosin 50–20K loop affects myosin's affinity for actin throughout the actin-myosin ATPase cycle and its maximum ATPase activity. Biochemistry. 1999;38:3785–3792. doi: 10.1021/bi9826815. [DOI] [PubMed] [Google Scholar]
- Murphy KP, Zhao Y, Kawai M. Molecular forces involved in force generation during skeletal muscle contraction. Journal of Experimental Biology. 1996;199:2565–2571. doi: 10.1242/jeb.199.12.2565. [DOI] [PubMed] [Google Scholar]
- Pette D, Staron RS. Cellular and molecular diversities of mammalian skeletal muscle fibers. Reviews of Physiology, Biochemistry and Pharmacology. 1990;116:2–47. doi: 10.1007/3540528806_3. [DOI] [PubMed] [Google Scholar]
- Potma EJ, van Graas IA, Stienen GJM. Influence of inorganic phosphate and pH on ATP utilization in fast and slow skeletal muscle fibers. Biophysical Journal. 1995;69:2580–2589. doi: 10.1016/S0006-3495(95)80129-3. [DOI] [PMC free article] [PubMed] [Google Scholar]
- Privalov PL, Gill SJ. Stability of protein structure and hydrophobic interaction. Advanced Protein Chemistry. 1988;39:191–234. doi: 10.1016/s0065-3233(08)60377-0. [DOI] [PubMed] [Google Scholar]
- Ranatunga KW. The force-velocity relation of rat fast- and slow-twitch muscles examined at different temperatures. Journal of Physiology. 1984;351:517–529. doi: 10.1113/jphysiol.1984.sp015260. [DOI] [PMC free article] [PubMed] [Google Scholar]
- Ranatunga KW. Temperature sensitivity of isometric tension in glycerinated mammalian muscle fibres. In: Marechal G, Carraro U, editors. Muscle and Motility. Andover, UK: Intercept; 1989. pp. 271–276. [Google Scholar]
- Ranatunga KW. Endothermic force generation in fast and slow mammalian (rabbit) muscle fibers. Biophysical Journal. 1996;71:1905–1913. doi: 10.1016/S0006-3495(96)79389-X. [DOI] [PMC free article] [PubMed] [Google Scholar]
- Ranatunga KW, Wylie SR. Temperature-dependent transitions in isometric contractions of rat muscle. Journal of Physiology. 1983;339:87–95. doi: 10.1113/jphysiol.1983.sp014704. [DOI] [PMC free article] [PubMed] [Google Scholar]
- Rayment I. The structural basis of the myosin ATPase activity. Journal of Biological Chemistry. 1996;271:15850–15853. doi: 10.1074/jbc.271.27.15850. [DOI] [PubMed] [Google Scholar]
- Rayment I, Holden HM, Whittaker M, Yohn CB, Lorenz M, Holmes KC, Milligan RA. Structure of the actin-myosin complex and its implications for muscle contraction. Science. 1993a;261:58–65. doi: 10.1126/science.8316858. [DOI] [PubMed] [Google Scholar]
- Rayment I, Rypniewski WR, Schmidt-Bäse K, Smith R, Tomchick DR, Benning MM, Winkelmann DA, Wesenberg G, Holden HM. Three-dimensional structure of myosin subfragment-1: a molecular motor. Science. 1993b;261:50–58. doi: 10.1126/science.8316857. [DOI] [PubMed] [Google Scholar]
- Rome LC, Funke RP, Alexander RM, Lutz G, Aldridge H, Scott F, Freadman M. Why animals have different muscle fibre types. Nature. 1988;335:824–827. doi: 10.1038/335824a0. [DOI] [PubMed] [Google Scholar]
- Rovner AS, Freyzon Y, Trybus KM. An insert in the motor domain determines the functional properties of expressed smooth muscle myosin isoforms. Journal of Muscle Research and Cell Motility. 1997;18:103–110. doi: 10.1023/a:1018689102122. [DOI] [PubMed] [Google Scholar]
- Schiaffino S, Reggiani C. Molecular diversity of myofibrillar proteins: gene regulation and functional significance. Physiological Reviews. 1996;76:371–424. doi: 10.1152/physrev.1996.76.2.371. [DOI] [PubMed] [Google Scholar]
- Spudich JA. How molecular motors work. Nature. 1994;372:515–518. doi: 10.1038/372515a0. [DOI] [PubMed] [Google Scholar]
- Stephenson DG, Williams DA. Temperature-dependent calcium sensitivity changes in skinned muscle fibres of rat and toad. Journal of Physiology. 1985;360:1–12. doi: 10.1113/jphysiol.1985.sp015600. [DOI] [PMC free article] [PubMed] [Google Scholar]
- Sweeney HL, Rosenfeld SS, Brown F, Faust L, Smith J, Xin J, Stein LA, Sellers JR. Kinetic tuning of myosin via a flexible loop adjacent to the nucleotide binding pocket. Journal of Biological Chemistry. 1998;273:6262–6270. doi: 10.1074/jbc.273.11.6262. [DOI] [PubMed] [Google Scholar]
- Taylor EW. Mechanism of actomyosin ATPase and the problem of muscle contraction. CRC Critical Reviews in Biochemistry. 1979;6:103–164. doi: 10.3109/10409237909102562. [DOI] [PubMed] [Google Scholar]
- Uyeda TQ, Ruppel KM, Spudich JA. Enzymatic activities correlate with chimeric substitution at the actin-binding face of myosin. Nature. 1994;368:567–569. doi: 10.1038/368567a0. [DOI] [PubMed] [Google Scholar]
- Wang G, Ding W, Kawai M. Does thin filament compliance diminish the cross-bridge kinetics? A study in rabbit psoas fibers. Biophysical Journal. 1999;76:978–984. doi: 10.1016/S0006-3495(99)77261-9. [DOI] [PMC free article] [PubMed] [Google Scholar]
- Wang G, Kawai M. Effects of MgATP and MgADP on the cross-bridge kinetics of rabbit soleus slow-twitch muscle fibers. Biophysical Journal. 1996;71:1450–1461. doi: 10.1016/S0006-3495(96)79346-3. [DOI] [PMC free article] [PubMed] [Google Scholar]
- Wang G, Kawai M. Force generation and phosphate release steps in skinned rabbit soleus slow-twitch muscle fibers. Biophysical Journal. 1997;73:878–894. doi: 10.1016/S0006-3495(97)78121-9. [DOI] [PMC free article] [PubMed] [Google Scholar]
- Weiss A, Schiaffino S, Leinwand LA. Comparative sequence analysis of the complete human sarcomeric myosin heavy chain family: implications for functional diversity. Journal of Molecular Biology. 1999;290:61–75. doi: 10.1006/jmbi.1999.2865. [DOI] [PubMed] [Google Scholar]
- Yount RG, Lawson D, Rayment I. Is myosin a “back door” enzyme? Biophysical Journal. 1995;68(suppl. 4):44s–47s. [PMC free article] [PubMed] [Google Scholar]
- Zhao Y, Kawai M. The effect of lattice spacing change on cross-bridge kinetics in chemically skinned rabbit psoas muscle fibers. II. Elementary steps affected by the spacing change. Biophysical Journal. 1993;64:197–210. doi: 10.1016/S0006-3495(93)81357-2. [DOI] [PMC free article] [PubMed] [Google Scholar]
- Zhao Y, Kawai M. Kinetics and thermodynamic studies of the cross-bridge cycle in rabbit psoas muscle fibers. Biophysical Journal. 1994;67:1655–1668. doi: 10.1016/S0006-3495(94)80638-1. [DOI] [PMC free article] [PubMed] [Google Scholar]
- Zhao Y, Swamy GPM, Humphries KA, Kawai M. The effect of partial extraction of troponin C on the elementary steps of the cross-bridge cycle in rabbit psoas muscle fibers. Biophysical Journal. 1996;71:2759–2773. doi: 10.1016/S0006-3495(96)79469-9. [DOI] [PMC free article] [PubMed] [Google Scholar]