

Abstract
Factors determining the release probability were examined using whole-cell patch-clamp recording and minimal stimulation (10 impulses, 50 Hz) of individual glutamatergic synapses, containing single release sites, on pyramidal neurones in the CA1 region of hippocampal slices from neonatal rats.
Release probability following the first action potential in the burst (P1) varied among the synapses from 0 to 0.87 (mean ± s.d.; 0.35 ± 0.28, n = 52) and the average release during the burst (burst pool) varied from 0.4 to 4.1 events (1.7 ± 0.85, n = 52). Heterogeneity in P1 did not co-vary with that of the burst pool.
By selecting burst trials during which only one release event occurred, the vesicle release probability (Pves) at a release site could be determined. It was found to vary considerably among the synapses, from 0.04 to 0.94 (0.43 ± 0.28, n = 43). This heterogeneity correlated significantly with that of P1 such that more than half of the variation of P1 could be explained by a variation in Pves.
The average number of vesicles directly available for release at the onset of the burst (the pre-primed pool) was estimated as the cumulative release up to that point in the burst where a second release event did not produce higher initial release probability than that found in trials where only one vesicle was released. The average pre-primed pool varied among the synapses from 0.4 to 2.1 (1.03 ± 0.42, n = 43). It co-varied significantly with that of P1 such that it could explain the remaining variation in P1.
The difference between the burst pool and the pre-primed pool suggests the presence of a fast (< 100 ms), activity-dependent priming of vesicles.
Some synapses (9/52) did not show any initial release (P1 = 0), but release occurred later during the burst (‘low frequency mute synapses’). Their behaviour was explained by an absence of a pre-primed pool.
Pyramidal neurones of the CA1 region are monosynaptically excited from ipsi- and contralateral CA3 pyramidal neurones. Despite the seemingly homogeneous population of pre- and postsynaptic neurones the synapses connecting them exhibit a considerable heterogeneity in their release properties to low frequency afferent activation (Hessler et al. 1993; Rosenmund et al. 1993; Huang & Stevens, 1997; Murthy et al. 1997). Such heterogeneity prompts a variety of questions, such as: when does it arise in development, what is it based on mechanistically, and what is its consequence for high frequency activation of a synapse?
Analysis of the CA3-CA1 synapse has suggested that each synapse exhibits a number of morphologically separate vesicle docking sites that together constitute a single functional release site. The heterogeneity in release probability was found to be well correlated with a variation among synapses in the number of morphologically identified docking sites (Schikorski & Stevens, 1997). Moreover, release probability was correlated with the number of vesicles readily available for release (Dobrunz & Stevens, 1997). These results may be taken to suggest that each docking site holds one release-ready vesicle at a time, and that these sites operate independently to produce the release of at most one vesicle at a time (see also Matveev & Wang, 2000). Heterogeneity in release probability may then reflect a variation in the docking site number among synapses (Dobrunz & Stevens, 1997), rather than in the probability of release of a vesicle at such sites (Pves).
However, as vesicles in other synapses may replenish within half a second of elevated presynaptic activity (Dittman & Regehr, 1998; Wang & Kaczmarek, 1998; Wu & Borst, 1999) the number of vesicles released during 10-20 stimuli at 10-20 Hz (Dobrunz & Stevens, 1997) may not necessarily reflect the number of vesicles actually available for release at rest, i.e. vesicles primed for release before the arrival of a low frequency stimulus (pre-primed vesicles). Moreover, the question of variations in Pves among release sites has not been experimentally addressed. The aim of the present study has been to directly estimate the size of the pre-primed pool as well as the value of Pves in order to decide their contribution to heterogeneity in release probability among the synapses.
To approach these questions experimentally one must examine release from single release sites. In the accompanying paper (Hanse & Gustafsson, 2001) we have demonstrated that this can be achieved using hippocampal slices from the neonatal (postnatal days 1-7) rat. This preparation has allowed us not only to estimate the above parameters but also to observe possible early developmental trends in them.
METHODS
Hippocampal slices were prepared from Wistar rats aged 1-7 postnatal days (P1-P7). The rats were killed by decapitation in accordance with the guidelines of the local ethical committee for animal research. The brains were removed and placed in an ice-cold solution composed of (mM): 124 NaCl, 3.0 KCl, 2 CaCl2, 6 MgCl2, 1.25 NaH2PO4, 26 NaHCO3 and 10 glucose. Transverse hippocampal slices (300 μm) were cut using a vibrating tissue slicer (Campden Instruments), transferred to a holding chamber and stored at 28°C. For recording, slices were individually transferred to a recording chamber where they were perfused (2 ml min−1) at 30-32°C. The extracellular solution contained (mM): 124 NaCl, 3.0 KCl, 4 CaCl2, 4 MgCl2, 1.25 NaH2PO4, 26 NaHCO3, 10 glucose and 0.02 bicuculline methiodide or 0.1 picrotoxin.
Whole-cell patch-clamp recordings were performed from visually identified CA1 pyramidal cells. The pipette solution contained (mM): 95 caesium gluconate, 20 TEACl, 10 NaCl, 5 QX-314, 4 Mg-ATP, 0.4 Na-GTP, 0.2 EGTA and 10 Hepes (pH 7.3, adjusted with CsOH). Some of the experiments were performed in the perforated patch-clamp mode (Hanse & Gustafsson, 2001).
Procedures for whole-cell recording, minimal stimulation tests for axonal excitation and detection of EPSCs are described in the accompanying paper (Hanse & Gustafsson, 2001). Several findings indicated that the minimal stimulation protocol consistently resulted in the activation of a single release site when applied to the neonatal hippocampal slice preparation (see also Hsia et al. 1998), and that this release site, at most, releases one vesicle of glutamate (see also Stevens & Wang, 1995; Dobrunz et al. 1997; Liu et al. 1999). Most importantly, the EPSC amplitude (excluding failures) was found to be independent of release probability during the burst stimulation. This result strongly argues against the possibility that more than one vesicle per action potential was released, as that would have resulted in larger EPSC amplitude at higher release probability.
Analysis was performed using custom software written in Igor Pro (Wavemetrics, Lake Oswego, OR, USA). Unless otherwise indicated, data are presented as means ±s.d. Student’s t test was used to determine statistical significance.
RESULTS
Single synapses on CA1 pyramidal neurones containing single release sites were activated using minimal stimulation in neonatal (P1-P7) rats (Hanse & Gustafsson, 2001). Release characteristics of such single release sites were analysed by evoking synaptic responses by repeated (at 0.2 Hz) 10 impulse, 50 Hz bursts. Any given afferent was stimulated about 70 times (48-144), and at each trial the number of release events and the position of these events in the burst stimulus was noted (Fig. 1). During these stimulation periods release parameters were stationary (Hanse & Gustafsson, 2001).
Figure 1. Different release patterns during burst activation of single synapses.

A and B, release patterns of two different synapses (A and B) in response to repeated (0.2 Hz) 10 impulse, 50 Hz stimulations. Aa and Ba, three consecutive traces in response to the stimulation. Ab and Bb, the release pattern for all consecutive stimulations during the experiment. A black bar indicates a release event. Ac and Bc, the release probability plotted against the position in the stimulus train.
The release pattern of a single synapse during the burst stimulation was characterised by a considerable inter-trial variability, the number of release events per burst trial generally varying between zero and four. This suggests an appreciable moment-to-moment variation in the amount of readily releasable vesicles (Fig. 1) at each release site. When examined for various synapses, the average number of these release events during the burst (burst pool) varied from 0.4 to 4.1 (1.7 ± 0.85, n = 52), indicating a considerable heterogeneity among the synapses also in the average availability of releasable vesicles during such burst activation. In agreement with the heterogeneity in release probability observed at low frequency stimulation later in development (Hessler et al. 1993; Rosenmund et al. 1993; Huang & Stevens, 1997; Murthy et al. 1997), release probability at the first position in the burst (P1) also showed a great variability among the synapses (Fig. 2a), values varying from zero to 0.87. However, the heterogeneity observed in the burst pool did not correlate significantly (r = 0.25, P > 0.05) with the heterogeneity in P1 (Fig. 2B).
Figure 2. Heterogeneity in initial release probability.

A, distribution of release probabilities in the first stimulus position of the burst (P1), n = 52 synapses. B, relation between initial release probability and the average number of release events during the 10 impulse burst (burst pool). Dashed line is the linear regression (r = 0.25; P > 0.05).
The lack of correlation between P1 and burst pool is also illustrated by records of release from the two synapses illustrated in Fig. 1 exemplifying variations in release behaviour among the synapses during the burst activation. For one synapse (Fig. 1a), release occurred with a high probability at the first position in the burst (P1 = 0.75), the probability thereafter dropping to a much lower value (about 0.1) throughout the rest of the burst. For the other synapse illustrated (Fig. 1B) initial release probability was lower (P1 = 0.45) but release probability changed relatively little during the burst. These various release behaviours must reflect a variation among the synapses regarding how vesicles are made available for release, and/or the probability of release of those vesicles. Our aim below is to analyse what decides the variation in initial release probability, i.e. in P1. In this analysis we assume (see Introduction) that each synapse exhibits a number of morphologically separate vesicle docking sites that together constitute a single functional release site, these docking sites independently operating to produce the release of at most one vesicle at a time. A single docking site can only hold one release-ready vesicle at a time, and releases that vesicle with a certain probability (Pves) that has much the same value for all sites within a given release site. The number of docked vesicles that are ready for release (primed) at rest, and thus potentially can be released by single low frequency activation, are considered to constitute a pre-primed pool.
Is the pre-primed pool depleted within a 10 impulse burst?
To answer what determines P1 one must know how many vesicles are ready for release when the first presynaptic action potential in the burst stimulation is evoked, i.e. the size of the pre-primed pool. It might be assumed that priming of new vesicles is relatively slow and that all vesicles released by a 50 Hz stimulation for 200 ms should come from such a pre-primed pool (cf. Dobrunz & Stevens, 1997). However, prolonging the 10 impulse stimulation to a 20, 30 or 40 impulse stimulation (n = 10 synapses) did not lead to any obvious depletion of such a pool. That is, throughout such stimulations release events still occurred at much the same (albeit slowly declining) rate as at the end of the 10 impulse burst. These later release events may then relate to newly primed vesicles, the pre-primed pool being depleted much faster.
We wished to determine whether release events occurring in the later part of a 10 impulse stimulation were caused by vesicles available, or not available, for release when the first action potential in the burst arrived. For each synapse, trials in which there was only one release event, this event occurring in the first half of the 10 impulse burst, were first used. P1 values for these trials were thereafter computed from the relative number of events occurring at stimulus position 1 (0.48 ± 0.05 (mean ±s.e.m.), n = 32 synapses). Trials in which there were two release events during the 10 impulse burst were then selected. If both vesicles released had belonged to the pre-primed pool, P1 would now be expected to be larger (equal to 1 – (1 –Pves)2 if the two vesicles operate at two independent sites with the same Pves), i.e. 0.73 with a Pves of 0.48. The two vesicle-release group was subdivided into two subgroups, one in which both releases occurred at any of the first five positions in the burst, and one in which the second release occurred at any of the last five positions. When two early releases had occurred P1 was found to average 0.74 ± 0.05 (s.e.m.; n = 32) agreeing with a pre-primed pool of two, whereas P1 values from the latter subgroup averaged 0.43 ± 0.07 (s.e.m.; n = 25) suggesting a pre-primed pool of one.
It was only in this subgroup of 25 synapses that there was a sufficient number of release events to obtain reliable estimates of the release probability using two-release trials with one release among the first five and one release among the last five stimuli in the burst. For these 25 synapses, P1 values in the trials where there were one and two release(s) among the first five stimuli were 0.43 ± 0.06 and 0.73 ± 0.05, respectively.
This result would imply that the pre-primed pool is depleted already within the first half of the 10 impulse burst stimulation, and that the subsequent release must come from vesicles not primed at the initiation of the burst.
Determination of pre-primed pool size and Pves
We wished to obtain an estimate of when the pre-primed pool is depleted, and thus of its size as well as the magnitude of Pves for each synapse. That is, to determine for each synapse when in the burst the appearance of release no longer affects the value of P1. We then examined changes in P1 when release events in more and more of the burst positions were considered (i.e. increasing burst length), starting with position 1. This reasoning can be exemplified as follows. Consider a release site with a pre-primed pool of one vesicle. Repeated burst stimulation will result in trials with a single-release event dispersed at various positions in the burst for different trials. P1 is then plotted as a function of burst length. At a burst length of 1, and counting only bursts containing a single-release event, P1 will of course be 1. With each prolongation of the examined burst length, bursts with no first-position release will occur, and P1 will decrease, eventually reaching a value corresponding to Pves when the pool is depleted. Since there will be no further release after the pool is depleted, prolongation of the burst length will not change the ratio between bursts with a single-release event at position 1 and those with a single-release event in later positions. P1 will thus remain at Pves, and indicate the value of this parameter.
Release from newly primed vesicles can now be added to this scenario, assuming that this release starts after depletion of the pre-primed pool and is independent of release from this latter pool. The release of these newly primed vesicles will then reduce the number of single-release bursts with release in position 1 to the same extent as those releasing at later positions (by creating two-release bursts that fall outside our single-release burst criterion). P1 will thus still remain at Pves (for as long as single-release bursts with release at position 1 remain; Pves will thereafter collapse to zero). Thus, if one examines two-release events for various burst lengths, the second event occurring at the last position at the examined burst length, P1 will still remain the same as if that release had not occurred, so long as that second vesicle is one of these newly primed ones. On the other hand, if that second release were a pre-primed vesicle, P1 would be expected to be larger since the pre-primed pool would then have consisted of two vesicles instead of one.
Using single- and two-release events, the relation between P1 and burst length was computed for all synapses exhibiting release in the first position (n = 43). As illustrated for a synapse in Fig. 3 such computed curves demonstrated features consistent with a small rapidly depleted pre-primed pool, and a fast occurrence of newly primed vesicles. Thus, with increasing burst length, P1 decreased for the first three to four stimuli in the burst towards a plateau implying pre-primed pool depletion, the plateau level indicating a Pves value of about 0.15 for this synapse (Fig. 3a). Such an initial decrease followed by a plateau was also observed when data from all synapses were averaged (Fig. 4a). Figure 3B shows that P1 values, obtained when a second release event had occurred, also followed those obtained using a single-release event for burst lengths corresponding to the plateau region, validating the assumption that such release events did not come from the pre-primed pool. Only for the early part of the burst, in positions 2 and 3, was a second release event associated with a higher P1, indicating its inclusion in the pre-primed pool. The cumulative release probability was then computed to obtain the average pre-primed pool size for this synapse, giving a value of 1.3 vesicles (Fig. 3C).
Figure 3. Determination of the size of the pre-primed pool and of the vesicle release probability.

A, release probability in the first position of the burst as a function of burst length. Only trials that up to the burst length had contained one release event were selected for the calculation of the release probability in the first position. Note the relatively stable level at about 0.15 at burst lengths longer than three. B, comparison of release probability in the first stimulus position between single-release trials (○) and two-release trials (□). The single-release curve is the same as that in A. The two-release curve is the release probability in the first stimulus position as a function of burst length for those trials that had contained two release events, of which the later one appeared at the end of the burst length. The pre-primed pool was deemed depleted when trials containing two release events were not associated with any higher release probability in the first stimulus position than had only a single release event occurred (in this case position 4). The size of the pre-primed pool was then determined from the cumulative release probability, illustrated in C, up to that point in the burst (in this case up to position 3). The average probability of releasing a vesicle (Pves) was determined from the value of the single-release curve at the intersection between the single-release curve and the two-release curve. C, cumulative release probability as a function of stimulus position. The values are based on 144 consecutive burst stimulations of this synapse.
Figure 4. Heterogeneity in the vesicle release probability and the size of the pre-primed pool among synapses.

A, summary graph (n = 43 synapses) showing the average release probability (±s.e.m.) in the first position of single-release trials as a function of burst length. Each synapse was analysed as in Fig. 3A before averaging. Dashed line indicates the plateau level. B, distribution of the size of the pre-primed pool of vesicles among synapses, n = 52. The nine synapses with a pre-primed pool of zero (‘mute synapses’) are those that had zero release probability in the first stimulus position (cf. Fig. 6). C, distribution of vesicle release probabilities (Pves) among the synapses (n = 43).
Pre-primed pool size, Pves and initial release probability
The above analysis suggests that the number of vesicles directly available for release when the first action potential is evoked (pre-primed pool) is quite small. The distribution of (average) values for the synapses varied over a fourfold range (0.5-2.0) with a skew towards the lower range (Fig. 4B). Among the synapses, only about one vesicle is on average in a pre-primed state (1.03 ± 0.42, n = 43). Pves values, obtained from the plateau level, also displayed a considerable variation, from almost zero up to 1.0, also with some skew towards lower values (Fig. 4C) (0.43 ± 0.28, n = 43). The size of the pre-primed pool was found to depend somewhat on the inter-burst frequency, increasing by 15 ± 6 % (mean ±s.e.m., n = 5) when prolonging the interval between the bursts from 5 s to 30 s.
Previous work has indicated that the readily releasable pool size is the determinant of initial release probability (Dobrunz & Stevens, 1997). In Fig. 5 the observed values of P1 are plotted against Pves (Fig. 5a) and pre-primed pool size (Fig. 5B), respectively, demonstrating that P1 co-varies with both of these of parameters. A linear regression gave somewhat stronger correlation between P1 and Pves (r = 0.78) than between P1 and pool size (r = 0.67), suggesting that Pves accounts for at least as much, and possibly more, of the variation in P1 among the synapses as does the pool size. No correlation was observed between the value of Pves and of the average pre-primed pool among the synapses (Fig. 5C).
Figure 5. Vesicle release probability, the size of the pre-primed pool, and their relation to the release probability in the first position.

A, release probability in the first stimulus position (P1) is plotted against the vesicle release probability (Pves) for all synapses (n = 43; r = 0.78; P < 0.001). B, release probability in the first stimulus position (P1) is plotted against the size of the pre-primed pool for all synapses (n = 43; r = 0.67; P < 0.001). C, vesicle release probability (Pves) is plotted against the size of the pre-primed pool for all synapses (n = 43; r = 0.13; P > 0.05). D, release probability in the first stimulus position is plotted against predicted release probability (n = 43, r = 0.97; P < 0.001). The predicted release probability was calculated using the equation S(1 – (1 –Pves)pool), where S represents the fraction of non-zero release trials, Pves represents the calculated release probability for a vesicle in the first stimulus position, and pool represents the calculated mean size of the pre-primed pool for non-zero release trials. Dashed lines in all graphs are linear regression lines.
A value for P1 for each synapse could be predicted from these values of Pves and of average pre-primed pool (pool) obtained from this subgroup of trials with single- and two-release events. The equation P1 = 1 – (1 –Pves)pool will, however, only operate if pool is ≥ 1, i.e. that there are no trials in which there is no vesicle in the pre-primed pool. Since, according to our analysis, zero-release trials exist (implying an absence of a pre-primed vesicle), the obtained value of pool for a synapse will have to be divided by the fraction of non-zero release trials. After the insertion of this adjusted pool value into the above equation, the calculated P1 will then have to be multiplied by the above factor to account for the fact that the experimentally observed P1 also includes zero-release trials. Thus, P1 will be decided by two components, one component being the interaction between the number of pre-primed vesicles and Pves, the other the relative presence of zero-release (from the pre-primed pool) trials. The values for P1 computed in this manner for various synapses demonstrate a good agreement with the experimentally observed values (Fig. 5D). Thus, Pves values obtained from the single-release trials would appear to represent those of all trials, and the pre-primed vesicles to operate independently of each other to produce release.
Low frequency mute synapses
Nine of the examined synapses were not included in the above analysis since no release events occurred in the first position of the burst (Fig. 6A and B), in several cases despite more than hundred trials. In one case there were no release events in the second position, either. Nevertheless, these synapses released later during the burst, and the total number of release events during the burst did not differ from that of the other synapses. These synapses were thus not silent in response to the first stimulus because of an absence of functional postsynaptic receptors (‘deaf’ synapse) but due to the lack of release (‘mute’ synapse). This lack of initial release could be related either to a very low Pves (< 0.01-0.02) or to the lack of a pre-primed pool. To resolve this question single-release trials were again used, and P1 was plotted against burst length, P1 now representing the first position in the burst where release occurred (i.e. position 2 or 3). If now Pves had been very low (in position 1), a P1-burst length relation starting from position 2 (or 3) with (in that case) higher Pves would be expected to be similar to that in Fig. 3 with a plateau level giving the value of Pves at position 2 (or 3). However, as in the illustrated example (Fig. 6C), the P1-burst length relation for these synapses typically decayed to zero within four to five positions without any indication of a plateau. It thus does not appear that this release comes from a pre-primed pool of vesicles. What may explain this behaviour is release coming from a vesicle newly primed in an activity-dependent manner. The P1-burst length relation will then not reach any plateau but decay to zero at a burst length corresponding to the average priming rate. The rise in release probability during the burst in mute synapses may then reflect the rate of recruitment of a vesicle into a primed condition.
Figure 6. Low frequency mute synapse.

A, the release pattern for all consecutive stimulations during the experiment. A black bar indicates a release event. Note the absence of release events in the first stimulus position. B, the release probability is plotted against the position in the stimulus train. C, release probability in the second stimulus position as a function of burst length for the synapse illustrated in A and B. Same analysis as in Fig. 3A.
P-burst length relations decaying to zero are also observed in non-mute synapses when the starting position is chosen beyond that at which the pre-primed pool is depleted (not shown). This implies that release at this stage of the burst in these synapses, as well as in the mute ones, comes from vesicles primed (and then released) one at a time. The probability of release (at this stage, ranging from 0 to 0.3 among the synapses) is then determined by the probability of there being a primed vesicle, either pre-primed or newly primed. An approximate measure of the pre-primed pool in non-mute synapses can then be obtained by simply subtracting the actual release probability curve by the release probability curve of mute synapses (after adjusting in magnitude the average release probability curve from mute synapses to agree with the late phase (stimulus positions 8-10) of the actual probability curve). Pre-primed pool values estimated in this manner demonstrated a good agreement with those estimated above (Fig. 3C), a linear regression giving a slope of 0.94 (r = 0.92). This similarity supports our suggestion that release from mute synapses represents that of newly recruited vesicles, and that recruitment also occurs in much the same manner when a pre-primed pool is present.
Biphasic release
The above analysis has suggested the existence of two components in the release during a brief burst; one from vesicles directly available for release (pre-primed), and another from vesicles recruited in a fast manner (within 100 ms). Additional evidence supporting such a view comes from synapses where the release was found to be biphasic, an initial release in the first two stimulus positions followed by a pronounced dip, or pause, before a later resumption. Such behaviour was observed in three of the synapses analysed (Fig. 7a). As counterparts to the mute synapses, not showing an initial release, a few synapses displayed essentially no late release (Fig. 7B).
Figure 7. Synapses exhibiting biphasic release and only early release.

A, the release probability at each position of the stimulus train for one synapse where there was a clear dip between early and late release. B, the release probability at each position of the stimulus train for one synapse where late release was absent.
Is age a factor?
The synapses analysed were taken from rats of different ages (P1-P7), i.e. throughout the first postnatal week during which an appreciable neuronal development occurs. In Fig. 8 some key parameters such as initial release probability (P1) (Fig. 8a), late release probability (P8-10) (Fig. 8B), calculated release probability for a vesicle (Pves) (Fig. 8C) and calculated pre-primed pool (Fig. 8D) against the age of the animal are plotted. None of these parameters displayed any strong relation to age. Only in the case of late release probability could a statistically significant relation (P < 0.01) be demonstrated.
Figure 8. Developmental trend of presynaptic release parameters.
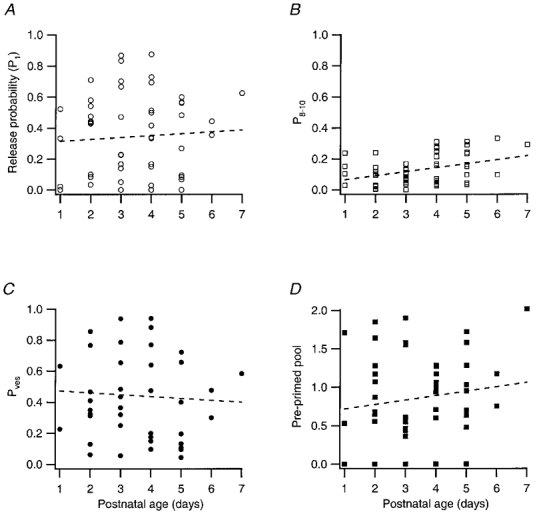
A, the initial release probability (P1) plotted against postnatal age (n = 52; r = 0.06; P > 0.05). B, average release probability in stimulus positions 8-10 (P8-10) plotted against postnatal age (n = 52; r = 0.38; P < 0.01). C, vesicle release probability (Pves) plotted against postnatal age (n = 43; r = -0.06; P > 0.05). D, the size of the pre-primed pool plotted against postnatal age (n = 52; r = 0.14; P > 0.05). Dashed lines in all graphs are linear regression lines.
DISCUSSION
This study has dissociated the two factors that decide the release probability of a synapse containing a single release site; the number of vesicles directly available for release at such a site, and the probability of release of a vesicle. This analysis has generated several new insights into the workings of a glutamatergic synapse. The average pool of vesicles directly available when an action potential arrives (pre-primed) is very small, no more than two to three, on average about one. This pool is depleted within the first few action potentials of a high frequency stimulus train, and release is thereafter mediated via fast (within 100 ms) priming of previously (most likely) docked vesicles. The average size of the pre-primed pool was found to vary considerably and to be one factor underlying the large heterogeneity in initial release probability among the synapses. However, the release probability of a vesicle (Pves) was also found to vary greatly among the synapses, from 0.05 to 0.9, and to be a major factor behind the heterogeneity in initial release probability. This behaviour of synapses was observed throughout the postnatal period examined (P1-P7), and is thus not acquired during the course of development.
The study has also identified, in 17 % of the analysed synapses, what appears to be a previously not described behaviour of glutamatergic synapses, namely that a synapse is ‘mute’ at low frequency. The synapse does not release at all after the first, and sometimes second, action potential of a stimulus train, but thereafter releases to the same degree as other synapses. Our analysis suggests that this behaviour is explained by an absence of a pre-primed pool of vesicles in these synapses.
Pre-primed pool and Pves determine initial release probability
To our knowledge this study is the first to determine release probability of single vesicles and pre-primed pool size at a single release site in this explicit manner. What has made this analysis possible is our focus on the exact release pattern of a synapse to burst stimulation, examining the interrelationship between the successive release events. We do not claim that this analysis leads to incontrovertible results for each synapse with respect to the magnitude of vesicle release probability and pre-primed pool. For instance, for these values to be exact, release from the pre-primed pool should be completely over before the initiation of release from newly primed vesicles, which is unlikely. However, an estimation of pre-primed pool size, in which this assumption was relaxed, led to largely the same result suggesting that we are close to the mark.
The conclusions reached in this study agree in part with those reached in the study of Dobrunz & Stevens (1997), the only comparable study that has been made on this issue. In common with that study, we found that initial release probability was correlated with the size of the releasable pool. The determination of the release probability of a vesicle (Pves) as performed in the present study indicates, however, that Pves is also a major factor determining the variation in initial release probability among the synapses. The study by Dobrunz & Stevens and the present one also differ in the sense that the vesicle pool considered to decide initial release probability was considerably larger in the former study, averaging about five vesicles. Part of this discrepancy may result from developmental reasons, i.e. synapses of P11-P18 rats may have larger pre-primed pools and thus lower vesicle probabilities (since P1 values are on average much the same in our results as those in the older rats) than those of P1-P7 rats. Ultrastructural data from the neonatal hippocampus (Fiala et al. 1998) and neocortex (Markus et al. 1987) do, in fact, indicate fewer vesicles adjacent to the presynaptic membrane in immature synapses. However, although we observed a significant increase in the vesicle pool within the first week, this increase was restricted to the newly primed pool. The pre-primed pool, considered to be decisive for the initial release probability, was not affected. Part of the discrepancy may result from the different manner of analysis. In this study the pre-primed pool was determined from an analysis of what release events actually did influence the initial release probability, while Dobrunz & Stevens (1997) estimated the release pool from the depletion curve using single long 10 Hz stimulation trains. According to our analysis this release should also have engaged vesicles not primed at the initiation of the stimulus train, thus leading to an overestimation of the pre-primed pool. We would venture to suggest that the readily releasable pool of Dobrunz & Stevens (1997) may contain our pre-primed pool as well as docked, but unprimed, vesicles.
In endocrine cells, e.g. a chromaffin cell, the readily releasable pool is a subpool of the morphologically docked vesicle pool (see Voets et al. 1999). Moreover, even within the readily releasable pool there is a subpool of vesicles more apt to release, an immediately releasable pool (Horrigan & Bookman, 1994; Voets et al. 1999). It may seem tempting to identify our pre-primed pool with this immediately releasable one, and our initially unprimed pool with the remaining part of the readily releasable pool. However, in chromaffin cells this subdivision within the readily releasable pool appears based on a different degree of co-localization between calcium channels and the release machinery for these vesicles (Voets et al. 1999), producing readily releasing vesicles with different Pves. However, as indicated from our analysis of ‘mute’ synapses, a very low Pves is not the reason for lack of release in the beginning of the burst in these synapses. Our unprimed pool may rather correspond to the slowly releasable pool of chromaffin cells, a docked pool (one step away from ‘maximal fusion competence’) in dynamic equilibrium with the readily releasable pool (Voets et al. 1999).
In the present study the value for the initial release probability of a synapse agreed well with that obtained from the expression 1 – (1 –Pves)pool where Pves is the calculated release probability of a vesicle and pool is the average number of pre-primed vesicles for that synapse. Using that equation, the relation between the pre-primed pool of vesicles and initial release probability can be plotted for various Pves values, as illustrated in Fig. 9. In this graph we have inserted values from this study (•) together with those of Dobrunz & Stevens (1997, □, their Fig. 7). As can be seen these two populations of values are quite distinct. One population has small pool values and the increase in initial release probability is to a large extent related to a climb towards higher Pves curves. In the other population vesicle pool values are much greater and Pves values correspondingly lower. Nevertheless, even in this latter population part of the rise in initial release probability might be construed as being due to an increase in Pves rather than pool size, at least within the lower range of pool sizes. The question then arises as to why, at larger pool sizes, initial release probability seems to be a function of pool size alone. One answer may be that Pves for these synapses is the same. An alternative answer is that these synapses actually operate in a range where variations in Pves can no longer substantially affect initial release probability, as will occur if large Pves values (> 0.4) are combined with pool sizes of two, or more. The conclusion of this reasoning may then be as follows: Pves varies considerably among the synapses at both 1 and 2-3 postnatal weeks, and this variation is an important factor underlying initial release heterogeneity. With age the pre-primed pool may increase somewhat, but not to the extent indicated by the readily releasable pool of Dobrunz & Stevens (1997), making initial release probability of synapses with the largest pools less dependent on existing variations in Pves.
Figure 9. Relation between release probability in the first stimulus position and the size of the pre-primed pool, at different vesicle probabilities.

Release probability in the first stimulus position was calculated using the equation P1 = 1 – (1 –Pves)pool, where Pves is the probability of releasing a vesicle and ‘pool’ is the number of pre-primed vesicles. Pves was increased from 0.1 to 1.0 in steps of 0.1. Curves for Pves values of 0.1 and 0.2 are indicated. •, data from the present study; □, data from Dobrunz & Stevens (1997), their Fig. 7.
Pves variations among and within release sites
Our conclusion is then that initial release heterogeneity among the synapses to a considerable extent is explained by a large variation in the release probability of vesicles when the synapse starts releasing. This conclusion is strengthened by a very recent study on cultured hippocampal neurones suggesting that release probability is related to the degree of active depolarization of the terminals (Prakriya & Mennerick, 2000). Initial release heterogeneity is thus explained by a heterogeneity among synapses in the density of voltage-dependent sodium channels in the terminal membrane. Other factors that, however, may not be excluded are differences among the synapses in number and characteristics of functional calcium channels in proximity to the release site, and of the calcium-sensing elements, such as synaptotagmin, within the release site.
A related question is whether the calculated Pves value for a release site represents that of all its docking sites, or whether these sites are non-uniform. In the latter case, the calculated value would represent the mean of the various site probabilities. What would speak in favour of uniformity is that the Pves value obtained from single-release trials (0.48) could adequately predict the P1 value (0.73) when two vesicles interacted to produce release (0.74), or when all trials were included (Fig. 5D). This result is not the expected one if different docking sites at the same release site had very different release probabilities. For example, if two docking sites had the same Pves value of 0.5, or had values of 0.8 and 0.2, respectively, the predicted P1 when two vesicles interact would be quite different (0.75 vs. 0.84). Moreover, if, as suggested above, heterogeneity among the synapses is explained by the degree of active depolarization of the terminal, it seems rather likely that all sites will be affected in a similar manner. However, our data can of course not exclude lesser degrees of non-uniformity, and Pves variations can also arise from factors that may vary from site to site.
Priming: resting variability and activity-dependent acceleration
In agreement with Dobrunz & Stevens (1997) we found for any given synapse a large inter-trial variability, the number of release events during the 10 impulse, 50 Hz stimulation varying from high values (4-5) down to even zero. The existence of zero-release trials, indicating an absence of a pre-primed pool at those trials, has certain implications. Initial release probability may be seen as related directly to the interaction between the number of pre-primed vesicles and Pves. However, in the absence of a primed vesicle there is no interaction between any vesicle and Pves, and release probability must then also contain a component related to the relative presence of such zero-release (from the pre-primed pool) trials. A second implication is that the priming should be reversible (in the absence of activity) since it seems unlikely that during some of the 5 s inter-trial intervals no vesicle should have entered the primed state when on other trials two to three vesicles had become primed. Such reversibility has recently been demonstrated with respect to the docking process (Murthy & Stevens, 1999).
A key finding in this study is that release events occurring even within the first 100 ms of a burst stimulus can be vesicles that were not available for release at the beginning of the stimulus. This calls for a fast transition of vesicles from a probably docked stage to a primed one. Our analysis suggests that this transition is activity dependent but not release dependent in the sense that the release from these newly recruited vesicles is independent of the release from the pre-primed pool. This transition thus resembles the refilling of the readily releasable pool described by Stevens & Wesseling (1998), except that the refilling of such an emptied pool took several seconds even when stimulated by activity. However, a fast refilling of the releasable pool on a time scale more comparable to that indicated here has recently been described for other synapses (Dittman & Regehr, 1998; Wang & Kaczmarek, 1998; Wu & Borst, 1999; Zenisek et al. 2000).
Functional considerations
The release properties of synapses are of functional interest primarily in the context of the activation pattern these synapses are subjected to. The heterogeneity that is observed at low frequency single volley activation may then be of little consequence for synapses normally activated, e.g. in brief high frequency bursts, unless this heterogeneity also decides release behaviour at this latter type of activation. Hippocampal pyramidal neurones usually fire action potentials clustered in bursts. This is true in the neonatal period when neurones fire synchronously and spontaneously in bursts (Ben Ari et al. 1989, 1997; Garaschuk et al. 1998), but also in the mature hippocampus burst activity has been considered as ‘functional, information bearing signalling’ (Lisman, 1997). Such brief burst activation of the synapses may make them generate ‘virtually the same integrated response to every burst’, essentially removing release probability as a factor determining the synaptic effect. Thus, release heterogeneity observed with low frequency activation should, according to this notion, be of little consequence for release during a burst, except for the possible importance of the exact timing of the release. However, it does not seem clear why synapses in which the number of readily releasable vesicles determines initial release probability (Dobrunz & Stevens, 1997) would behave in this manner. For the synapses observed in our study the 10 impulse, 50 Hz burst stimulation clearly ‘equalized’ the output from the initially differently behaving synapses, the total output during the burst being largely independent of initial release probability, a behaviour consistent with the above notion. Nonetheless, this ‘equalization’ does not mean that all synapses generate ‘the same integrated response to every burst’. Some heterogeneity, unrelated to initial release heterogeneity, persists, possibly related to differences in priming rate among the synapses.
A special group of synapses contained those that did not respond at all to low frequency activation, but that responded during the 10 impulse burst, a behaviour that our analysis attributes to the lack of a pre-primed pool. Synapses with this release behaviour would thus be ‘presynaptically silent’, or in the words of Lisman be ‘perfect’ synapses (Lisman, 1997), filtering out all single spike activity. However, since they release vesicles when activated with a high frequency burst they may be better referred to as ‘low frequency mute’ synapses (Malgaroli, 1999).
Acknowledgments
This project was supported by the Swedish Medical Research Council (project numbers 12600 and 05180), the Swedish Society of Medicine, Harald Jeanson’s Foundation, The Royal Society of Arts and Sciences in Göteborg, Magnus Bergvall’s Foundation and Adlerbertska Research Foundation.
References
- Ben Ari Y, Cherubini E, Corradetti R, Gaiarsa JL. Giant synaptic potentials in immature rat CA3 hippocampal neurones. The Journal of Physiology. 1989;416:303–325. doi: 10.1113/jphysiol.1989.sp017762. [DOI] [PMC free article] [PubMed] [Google Scholar]
- Ben Ari Y, Khazipov R, Leinekugel X, Caillard O, Gaiarsa JL. GABAA, NMDA and AMPA receptors: a developmentally regulated ‘menage a trois’. Trends in Neurosciences. 1997;20:523–529. doi: 10.1016/s0166-2236(97)01147-8. [DOI] [PubMed] [Google Scholar]
- Dittman JS, Regehr WG. Calcium dependence and recovery kinetics of presynaptic depression at the climbing fiber to Purkinje cell synapse. Journal of Neuroscience. 1998;18:6147–6162. doi: 10.1523/JNEUROSCI.18-16-06147.1998. [DOI] [PMC free article] [PubMed] [Google Scholar]
- Dobrunz LE, Huang EP, Stevens CF. Very short-term plasticity in hippocampal synapses. Proceedings of the National Academy of Sciences of the USA. 1997;94:14843–14847. doi: 10.1073/pnas.94.26.14843. [DOI] [PMC free article] [PubMed] [Google Scholar]
- Dobrunz LE, Stevens CF. Heterogeneity of release probability, facilitation, and depletion at central synapses. Neuron. 1997;18:995–1008. doi: 10.1016/s0896-6273(00)80338-4. [DOI] [PubMed] [Google Scholar]
- Fiala JC, Feinberg M, Popov V, Harris KM. Synaptogenesis via dendritic filopodia in developing hippocampal area CA1. Journal of Neuroscience. 1998;18:8900–8911. doi: 10.1523/JNEUROSCI.18-21-08900.1998. [DOI] [PMC free article] [PubMed] [Google Scholar]
- Garaschuk O, Hanse E, Konnerth A. Developmental profile and synaptic origin of early network oscillations in the CA1 region of rat neonatal hippocampus. The Journal of Physiology. 1998;507:219–236. doi: 10.1111/j.1469-7793.1998.219bu.x. [DOI] [PMC free article] [PubMed] [Google Scholar]
- Hanse E, Gustafsson B. Quantal variability at glutamatergic synapses in area CA1 of the rat neonatal hippocampus. The Journal of Physiology. 2001;531:467–480. doi: 10.1111/j.1469-7793.2001.0467i.x. [DOI] [PMC free article] [PubMed] [Google Scholar]
- Hessler NA, Shirke AM, Malinow R. The probability of transmitter release at a mammalian central synapse. Nature. 1993;366:569–572. doi: 10.1038/366569a0. [DOI] [PubMed] [Google Scholar]
- Horrigan FT, Bookman RJ. Releasable pools and the kinetics of exocytosis in adrenal chromaffin cells. Neuron. 1994;13:1119–1129. doi: 10.1016/0896-6273(94)90050-7. [DOI] [PubMed] [Google Scholar]
- Hsia AY, Malenka RC, Nicoll RA. Development of excitatory circuitry in the hippocampus. Journal of Neurophysiology. 1998;79:2013–2024. doi: 10.1152/jn.1998.79.4.2013. [DOI] [PubMed] [Google Scholar]
- Huang EP, Stevens CF. Estimating the distribution of synaptic reliabilities. Journal of Neurophysiology. 1997;78:2870–2880. doi: 10.1152/jn.1997.78.6.2870. [DOI] [PubMed] [Google Scholar]
- Lisman JE. Bursts as a unit of neural information: Making unreliable synapses reliable. Trends in Neurosciences. 1997;20:38–43. doi: 10.1016/S0166-2236(96)10070-9. [DOI] [PubMed] [Google Scholar]
- Liu G, Choi S, Tsien RW. Variability of neurotransmitter concentration and nonsaturation of postsynaptic AMPA receptors at synapses in hippocampal cultures and slices. Neuron. 1999;22:395–409. doi: 10.1016/s0896-6273(00)81099-5. [DOI] [PubMed] [Google Scholar]
- Malgaroli A. Silent synapses: I can’t hear you! Could you please speak aloud? Nature Neuroscience. 1999;2:3–5. doi: 10.1038/4503. [DOI] [PubMed] [Google Scholar]
- Markus EJ, Petit TL, LeBoutillier JC. Synaptic structural changes during development and aging. Brain Research. 1987;432:239–248. doi: 10.1016/0165-3806(87)90048-4. [DOI] [PubMed] [Google Scholar]
- Matveev V, Wang XJ. Implications of all-or-none synaptic transmission and short-term depression beyond vesicle depletion: a computational study. Journal of Neuroscience. 2000;20:1575–1588. doi: 10.1523/JNEUROSCI.20-04-01575.2000. [DOI] [PMC free article] [PubMed] [Google Scholar]
- Murthy VN, Sejnowski TJ, Stevens CF, Schikorski T. Heterogeneous release properties of visualized individual hippocampal synapses: Quantitative ultrastructural analysis of hippocampal excitatory synapses. Neuron. 1997;18:599–612. doi: 10.1016/s0896-6273(00)80301-3. [DOI] [PubMed] [Google Scholar]
- Murthy VN, Stevens CF. Reversal of synaptic vesicle docking at central synapses. Nature Neuroscience. 1999;2:503–507. doi: 10.1038/9149. [DOI] [PubMed] [Google Scholar]
- Prakriya M, Mennerick S. Selective depression of low-release probability excitatory synapses by sodium channel blockers. Neuron. 2000;26:671–682. doi: 10.1016/s0896-6273(00)81203-9. [DOI] [PubMed] [Google Scholar]
- Rosenmund C, Clements JD, Westbrook GL. Nonuniform probability of glutamate release at a hippocampal synapse. Science. 1993;262:754–757. doi: 10.1126/science.7901909. [DOI] [PubMed] [Google Scholar]
- Schikorski T, Stevens CF. Quantitative ultrastructural analysis of hippocampal excitatory synapses. Journal of Neuroscience. 1997;17:5858–5867. doi: 10.1523/JNEUROSCI.17-15-05858.1997. [DOI] [PMC free article] [PubMed] [Google Scholar]
- Stevens CF, Wang Y. Facilitation and depression at single central synapses. Neuron. 1995;14:795–802. doi: 10.1016/0896-6273(95)90223-6. [DOI] [PubMed] [Google Scholar]
- Stevens CF, Wesseling JF. Activity-dependent modulation of the rate at which synaptic vesicles become available to undergo exocytosis. Neuron. 1998;21:415–424. doi: 10.1016/s0896-6273(00)80550-4. [DOI] [PubMed] [Google Scholar]
- Voets T, Neher E, Moser T. Mechanisms underlying phasic and sustained secretion in chromaffin cells from mouse adrenal slices. Neuron. 1999;23:607–615. doi: 10.1016/s0896-6273(00)80812-0. [DOI] [PubMed] [Google Scholar]
- Wang LY, Kaczmarek LK. High-frequency firing helps replenish the readily releasable pool of synaptic vesicles. Nature. 1998;394:384–388. doi: 10.1038/28645. [DOI] [PubMed] [Google Scholar]
- Wu LG, Borst JG. The reduced release probability of releasable vesicles during recovery from short-term synaptic depression. Neuron. 1999;23:821–832. doi: 10.1016/s0896-6273(01)80039-8. [DOI] [PubMed] [Google Scholar]
- Zenisek D, Steyer JA, Almers W. Transport, capture and exocytosis of single synaptic vesicles at active zones. Nature. 2000;406:849–854. doi: 10.1038/35022500. [DOI] [PubMed] [Google Scholar]