

Abstract
The distribution and localization of Ca2+ transients and Ca2+ sparks in isolated adult rabbit Purkinje cells were examined using confocal microscopy and the Ca2+ indicator fluo-3.
When cells were field stimulated in 2.0 mm Ca2+ buffer, a transverse confocal line scan (500 Hz) showed that the fluorescence intensity was greatest at the cell periphery during the onset of the Ca2+ transient ([Ca2+]i). In contrast, the [Ca2+]i of ventricular cells showed a more uniform pattern of activation across the cell. Staining with di-8-ANEPPS revealed that Purkinje cells lack t-tubules, whereas ventricular cells have an extensive t-tubular system.
When we superfused both cell types with a buffer containing 5 mm Ca2+-1 μm isoproterenol (isoprenaline) they produced Ca2+ sparks spontaneously. Ca2+ sparks occurred only at the periphery of Purkinje cells but occurred throughout ventricular cells. Sparks in both cell types could be completely abolished by addition of the SR inhibitor thapsigargin (500 nm). Brief exposure to nifedipine (10 μm) did not reduce the number of spontaneous sparks.
Immunofluorescence staining of Purkinje cells with anti-ryanodine antibody revealed that ryanodine receptors (RyRs) are present at both peripheral and central locations.
Computer simulations of experiments in which the calcium transient was evoked by voltage clamp depolarizations suggested that the increase in calcium observed in the centre of the cell could be explained by simple buffered diffusion of calcium. These computations suggested that the RyRs deep within the cell do not contribute significantly to the calcium transient.
These results provide the first detailed, spatially resolved data describing Ca2+ transients and Ca2+ sparks in rabbit cardiac Purkinje cells. Both types of events are initiated only at subsarcolemmal SR Ca2+ release sites suggesting that in Purkinje cells, Ca2+ sparks only originate where the sarcolemma and sarcoplasmic reticulum form junctions. The role of the centrally located RyRs remains unclear. It is possible that because of the lack of t-tubules these RyRs do not experience a sufficiently large Ca2+ trigger during excitation-contraction (E-C) coupling to become active.
Spontaneous local increases in intracellular [Ca2+]i (calcium sparks) have been identified in cardiac, smooth and skeletal muscle (reviewed by Cheng et al. 1996b). A number of authors have suggested that Ca2+ transients are due the spatio-temporal summation of many Ca2+ sparks (Cannell et al. 1994; Cheng et al. 1995; Tanaka et al. 1998). These Ca2+ sparks are the result of release of Ca2+ from the SR and are believed to be the elementary events underlying E-C coupling in cardiac muscle (Cheng et al. 1993; Bridge et al. 1999). Shacklock et al. (1995) have shown that location of sparks coincides with the location of t-tubules in rat ventricular myocytes. Since L-type Ca2+ channels and SR Ca2+ release are co-localized at the t-tubule dyad junction, it has been suggested that a local accumulation of [Ca2+]i near one or a cluster of SR Ca2+ release channels gates their opening (Cannell et al. 1994; Cheng et al. 1996a). However, it is unclear whether Ca2+ channels or junctions with the sarcolemma are absolutely necessary for the spontaneous occurrence of sparks.
In contrast to the information available on sparks and Ca2+ transients in ventricular muscle, relatively little is known about the spatio-temporal characteristics of calcium signalling in other cardiac cell types. In canine cardiac Purkinje fibres, measurements of the Ca2+ transient by aequorin demonstrated that it was composed of two components: a rapid initial increase in [Ca2+] followed by a slower secondary rise (Wier & Isenberg, 1982). Since ventricular cells have a monotonic increase in [Ca2+] during the calcium transient, this difference suggests that mechanisms underlying the Ca2+ transient may differ between the two cell types. Using laser scanning confocal microscopy we have obtained new data describing the localization and distribution of Ca2+ sparks and Ca2+ transients in rabbit heart Purkinje cells. Our results suggest that Ca2+ sparks only occur at the periphery of the cell in association with junctions between the SR and sarcolemma. Antibody staining revealed that ryanodine receptors (RyRs) are arranged in regularly spaced bands (corresponding approximately to the Z-line) throughout the cell. However, we only observed sparks at the cell periphery and computer simulations suggested that little, if any, Ca2+ release takes place from the central RyRs. This suggests that sparks are only produced by the gating of RyRs located at junctions between the SR and sarcolemma in Purkinje cells. It follows that Ca2+ transients in Purkinje fibres normally originate at the cell periphery by the recruitment of peripheral sparks and simple diffusion of Ca2+ leads to the Ca2+ transient deeper inside the cell. Some preliminary results have been presented as an abstract (Spitzer et al. 1997; Cordeiro et al. 1999).
METHODS
Isolation of Purkinje cells
Purkinje cells were prepared from rabbit hearts using techniques described previously (Scamps & Carmeliet, 1989) with some modifications (Cordeiro et al. 1998). Male New Zealand white rabbits (Ellis and Pritchard, America Fork, UT, USA) were housed according to the Guide for the Care and Use of Laboratory Animals (NIH publication No. 85-23, revised 1985). Animals (2.0-3.0 kg) were anaesthetized with sodium pentobarbital (50 mg kg−1) administered through the ear vein. The hearts were rapidly removed and perfused retrogradely through the aorta with nominally Ca2+-free Tyrode solution of the following composition (mm): NaCl 126, KCl 5.4, MgCl2 5.0, NaH2PO4 1.0, glucose 22, Hepes 24, taurine 20, creatine 5, sodium pyruvate 5. This solution was equilibrated with 100% O2 and the pH was adjusted to 7.4 with NaOH. After 6-8 min of this nominally Ca2+-free perfusion, the heart was perfused for approximately 18-20 min with the solution described above supplemented with collagenase (273 U ml−1, Worthington type II), protease (5.2 U ml−1, Sigma type XIV) and 0.1 mm CaCl2. Following this enzyme digestion, the heart was perfused with enzyme-free Tyrode solution containing 0.1 mm Ca2+ for about 5 min. The heart was then placed in a dissecting dish containing 0.1 mm Ca2+ Tyrode solution. Purkinje fibres from both ventricles were dissected out and placed in a small dish containing fresh enzyme solution (described above). Dissociation of individual cells from the isolated fibres was aided by agitation of the enzyme solution with a stream of 100% O2. The temperature was maintained at 36°C throughout. Periodically, enzyme solution containing Purkinje cells in suspension was removed and added to a modified storage solution (described below). Myocytes were stored for up to 6 h in storage solution and were used on the day of isolation. Fresh enzyme solution was added to the undigested Purkinje fibres to maintain a volume of approximately 2 ml. Digestion of the Purkinje fibres into populations of individual myocytes required between 15 and 60 min under these conditions.
Isolation of ventricular cells
Ventricular cells were also isolated using the above methods. After the Purkinje strands had been dissected from both ventricles, the left ventricle was removed, minced and gently swirled in 0.1 mm Ca2+ Tyrode solution. The cell suspension containing ventricular cells was then placed in storage solution (described below) and kept at room temperature (21-22°C) until use.
Fluorescence imaging
The acetoxymethylester (AM) form of fluo-3 was used in this study. A 100 μm stock solution of fluo-3 AM was prepared by adding 1 mg of fluo-3 AM (dissolved in 0.86 ml DMSO) to 9 ml of fetal bovine serum (containing 225 μl of 20% F-127 pluronic in DMSO). The fluo-3 AM stock solution was divided into 200 μl aliquots and stored at -70° C. When needed, 1.5 ml of cell suspension containing either Purkinje or ventricular cells were loaded with fluo-3 AM for 30 min as described previously (Cheng et al. 1993).
All experiments were performed with a Bio-Rad 1024 laser-scanning confocal microscope attached to an inverted microscope (Nikon Diaphot). Fluorescence signals were collected with a x 100 oil-immersion objective lens (NA = 1.3). Fluo-3-loaded myocytes were placed in a perfusion chamber mounted on the stage of the microscope. The perfusion chamber could be rotated, allowing orientation of the myocytes either perpendicular or parallel to the scan line direction. Cells loaded with dye were excited at 488 nm using a krypton-argon laser and fluorescence emission detected via a 520 nm band-pass filter and photomultiplier tube. All confocal images were acquired with the Laser Sharp acquisition software program from Bio-Rad and recorded on a microcomputer and Jaz disk (Iomega) for later analysis. Images acquired with Laser Sharp software were analysed with custom programs written in IDL (Research Systems, Boulder, CO, USA).
The myocytes were repetitively field stimulated (4 ms duration via a pair of platinum wires) at 0.5 Hz to ensure a constant SR load. All experiments were performed at 36°C.
Staining with di-8-ANEPPS
In some experiments, myocytes were stained with the membrane-selective fluorescent dye di-8-ANEPPS. Cells were exposed to 5 μm of the dye (dissolved in DMSO + 20% pluronic) for 5 min. After washout, cells were excited at 488 nm and the emitted signal was recorded at 520 nm.
Immunofluorescence labelling
Freshly isolated myocytes from Purkinje strands and ventricular muscle were fixed by adding a 1 ml aliquot of myocytes in storage solution to 1 ml of 4% paraformaldehyde solution. The myocytes were fixed onto a glass slide, were washed briefly with phosphate-buffered saline (PBS) and permeabilized with Triton-X 100 (0.5% solution in PBS) for 15 min at room temperature. After permeabilization, the fixed myocytes were washed with PBS and blocked with 10% goat serum for 30 min. Myocytes were then incubated with monoclonal anti-ryanodine receptor antibody (mouse anti-RyR2 antibody; Affinity Bioreagents, Inc.). The antibody was diluted in 10% goat serum at a concentration of 0.5-1.0 μg ml−1 and myocytes were incubated with the antibody overnight at 4°C. The primary antibody was then rinsed with PBS and the secondary antibody was then added to the fixed myocytes for 4 h. As a control, the secondary antibody alone was added to fixed myocytes. The secondary antibody was goat anti-mouse Texas Red dissolved in PBS.
Ryanodine receptor antibody conjugated to Texas Red was visualized by confocal microscopy using 568 nm excitation wavelength with emission detected at 598 nm.
Solutions
All solutions were made with Milli-Q grade water. The modified storage solution had the following composition (mm): potassium glutamate 100, potassium aspartate 10, KCl 25, KH2PO4 10, MgSO4 2, taurine 20, creatine 5, EGTA 0.5, glucose 20, Hepes 5, BSA 0.2%. Myocytes were superfused with a Hepes buffer of the following composition (mm): NaCl 126, KCl 5.4, MgCl2 1.0, CaCl2 2.0, Hepes 24, glucose 11. pH was adjusted to 7.4 with NaOH. The anion exchange blocker probenecid (0.3 mm) was also added to the Hepes buffer to slow the loss of fluo-3 dye from the cells. In preliminary experiments, sparks were not always observable in the Hepes buffer containing 2 mm Ca2+. Therefore, the Ca2+ concentration in the Hepes buffer was elevated to 5 mm and 1 μm isoproterenol was added and in these conditions frequent sparks were detected throughout the experiments.
Electrophysiological recordings
In some experiments, voltage clamp recordings of the L-type Ca2+ current were made from Purkinje cells. Patch pipettes were fabricated from borosilicate glass capillaries (1.65 mm o.d., AM Systems, Everett, WA, USA). The pipettes were pulled using a gravity puller (DKI model 700C) and the tips were fire polished. The internal pipette solution had the following composition (mm): KCl 113, glucose 5.5, K2ATP 5, MgCl2 0.5, Hepes 10, NaCl 15. The pH was adjusted to 7.2 with KOH. Pipette resistance ranged from 1 to 3 MΩ when filled with the internal solution. Myocytes were superfused with the Hepes buffer (described above) and 2 mm 4-AP was added to inhibit transient outward current (Cordeiro et al. 1998). L-type Ca2+ current was recorded with an Axopatch 200B amplifier (Axon Instruments Inc., Foster City, CA, USA) and series resistance errors were reduced by 65-70% with electronic compensation. The voltage clamp protocol for the measurement of ICa consisted of three pre-pulses followed by a step to +10 mV for 150 ms from a post-conditioning potential of -40 mV. Membrane currents were recorded and analysed with a microcomputer running pCLAMP 7.0 software (Axon Instruments).
Drugs
Nifedipine and probenecid were purchased from Sigma Chemicals (St Louis, MO, USA). Fluo-3 AM, di-8-ANEPPS and Texas Red were purchased from Molecular Probes (Eugene, OR, USA). Thapsigargin and ryanodine were obtained from Calbiochem (La Jolla, CA, USA). Anti-ryanodine receptor antibody was purchased from Affinity Bioreagents (Golden, CO, USA).
Mathematical modelling
To quantitatively examine the movements of Ca2+ within Purkinje cells, a mathematical model of Ca2+ diffusion and binding was constructed. The Purkinje cell was modelled as a right cylinder with calcium binding by ATP, fluo-3 and troponin (Tn). The diameter of the cylinder was set to the diameter of the cell observed in confocal imaging experiments. The cylindrical geometry allowed the cell to be divided into 100 concentric compartments to allow equations describing the diffusion of Ca2+, Mg2+, ATP and fluo-3 to be examined. The method of solution of the diffusion/reaction equations was identical to that described previously (Cannell & Allen, 1984). The chemical reactions modelled were:
 |
with rate constants as given by Baylor & Hollingworh (1998) adjusted to 36°C by assuming a Q10 of 2.0. The diffusion coefficient of Ca2+ and fluo-3 was 3.0 x 10⁻⁶ cm2 s−1 and 0.25 x 10⁻⁶ cm2 s−1, respectively. The concentrations of the various buffers has not (to our knowledge) been measured in Purkinje fibres so the computer model was fitted to experimental data by adjustment of the [Tn], [ATP] and [fluo-3] (see Results). The calcium current recorded in voltage clamp experiments was used to drive calcium changes in the outermost compartment. Ca2+ then diffused from this compartment by simple diffusion. A simple first order differential equation provided transsarcolemmal Ca2+ extrusion. The rate of extrusion was defined by the rate of decline of Ca2+ once the voltage clamp pulse was over. The variable parameters were then adjusted to achieve the best possible fit to data obtained in the presence of ryanodine.
RESULTS
Relationship between cell structure and Ca2+ transients
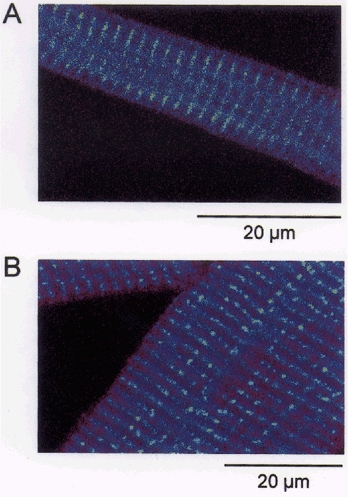
The fluorescent indicator di-8-ANEPPS was used to label surface membranes in rabbit Purkinje myocytes (Fig. 1A) and ventricular cells (Fig. 1B). The di-8-ANEPPS stain was only apparent at the periphery of the Purkinje cell showing that Purkinje cells lack t-tubules whereas the banding pattern in ventricular cells was indicative of a well developed t-tubular system. Since the t-tubular system permits the rapid spread of the calcium trigger signal to the interior of the cell (Cheng et al. 1994), the lack of t-tubular system in the Purkinje cell should result in a fundamentally different distribution of Ca2+ during excitation. As expected, transverse (x,t) line scan images from Purkinje cells (Fig. 2, top left) and ventricular cells (Fig. 2, top right) revealed very different spatial patterns of Ca2+-dependent fluorescence associated with electrical stimulation. In the ventricular cell, fluorescence increased more or less synchronously across the cell (Cheng et al. 1994; Cannell et al. 1994) whereas in the Purkinje cell, the fluorescence trace showed a U-shaped profile with the fluorescence increase at the edge preceding that in the centre. The time course of fluorescence change at the edge and centre of the two types of cells is shown in the lower panels of Fig. 2. Although the fluorescence change at the centre and edge of the ventricular cell was essentially identical (see Cheng et al. 1994), in the Purkinje cell, F/Fo reached ≈2.0 at the surface of the cell and 1.75 at the centre. Similar results were observed in every cell examined, with peak F/Fo being 2.28 ± 0.16 at 16.5 ± 1.4 ms at the edge and 1.69 ± 0.063 at 107.1 ± 15.8 ms in the centre (n = 8). These results show that in Purkinje cells, the rise of the Ca2+ transient was slower and of lower magnitude in the centre of the cell than at the surface. A similar pattern of activation has been observed in atrial cells, a preparation that also lacks t-tubules (Huser et al. 1996). The U-shaped fluorescence pattern is consistent with the idea that Ca2+ is released just beneath the surface of the cell and then moves into the interior by diffusion. The more uniform rise seen in the ventricular cell is consistent with the presence of t-tubules which, by providing contacts between the surface membrane and the SR deep inside the cell, allow synchronous activation (Cheng et al. 1994).
Figure 1. Sarcolemmal staining of Purkinje and ventricular myocytes.

Purkinje cell (A) and a ventricular cell (B) stained with the membrane dye di-8-ANEPPS.
Figure 2. Representative transverse (x,t) line scan recorded from a rabbit Purkinje cell (left panel) and ventricular myocyte (right panel).

The myocytes were field stimulated at a cycle length of 2 s. These images were obtained by calculating the ratio (F/Fo) of the single fluorescence (F) and dividing it by the background fluorescence (Fo) measured before field stimulation. Lower left panel, time course of F/Fo at the centre and edge of a Purkinje cell. Lower right panel, time course of F/Fo at the centre and edge of a ventricular cell.
Movement of Ca2+ from the periphery to the centre of the cell
The SR is believed to be distributed throughout the cells of Purkinje fibres (Sommer & Johnson, 1968; Jorgensen et al. 1993) and is essential for the ‘calcium-induced calcium release’ (CICR) mechanism (Fabiato, 1985). It follows that the rise in calcium in the cell interior might be due to both diffusion and CICR. The CICR mechanism is known to reside in the Ca2+-dependent gating of the SR calcium release channel (or ryanodine receptor (RyR)). We therefore performed immunocytochemistry using antibodies specific for the cardiac isoform of the RyR (RyR2). Cells were labelled with primary antibodies raised against RyR2 and visualized with secondary antibody conjugated to Texas Red. Ventricular cells showed prominent banding at the level of the t-tubules indicating that ryanodine receptors were located at sites adjacent to the t-tubules (Fig. 3B). Interestingly, the Purkinje cells also exhibited bands in the interior of the cell (Fig. 3a). Although the bands do not appear to be as well organized and intense as in ventricular cells, the result suggests that ryanodine receptors are located in the cell interior. In the absence of primary antibodies, application of the secondary antibody did not produce any intense regions of labelling (data not shown). Given that the primary antibody is highly specific for RyR2 (Lai et al. 1992; Jorgensen et al. 1993; Junker et al. 1994) we conclude that the RyR2 necessary for CICR is present in the interior of the cell.
Figure 3. Immunohistochemical localization of ryanodine receptors in Purkinje (A) and ventricular cells(B).
The ventricular cell shows prominent banding at the level of the t-tubules suggesting that ryanodine receptors were located at sites adjacent to the t-tubules (B). The Purkinje cell also exhibited bands of intense staining in the interior of the cell (A). This suggests that ryanodine receptors are located in the cell interior. The spacing between the bands of intensity measured in 4 Purkinje and 4 ventricular cells was found to be 1.95 and 1.98 μm, respectively.
Having established the possibility for CICR in Purkinje cells, we compared Ca2+ transients that were evoked by field stimulation in the absence and presence of ryanodine. Line scan images were recorded and the fluorescence from these images was averaged (Fig. 4A and B). The line scan images displayed the same general patterns under control conditions (top panel) and after exposure to ryanodine (200 nm) for 15 min (bottom panel). Exposure to ryanodine reduced the amplitude of the Ca2+ transient both at the surface and the interior of the cell. Since treatment with ryanodine should have inhibited any CICR in the interior of the cell, this result indicates that regenerative calcium release is not necessarily the major determinant of the amplitude and time course of the Ca2+ transient in the interior of the cell. However, full interpretation of this result requires a detailed understanding of the interaction between fixed and mobile calcium buffers within the cell as well as accounting for changes in the time course of the Ca2+ transient at the surface of the cell.
Figure 4. Ratio images (F/Fo) of transverse (x,t) line scan plots recorded from a Purkinje cell under control conditions (A, 2 mm Ca2+, left panel) and after 15 min exposure to 200 nm ryanodine (B, left panel).

The myocytes were field stimulated at a cycle length of 2 s. Time course of F/Fo at the centre and edge of the Purkinje cell in the absence (A, right panel) and presence (B, right panel) of ryanodine. The rate constants for diffusion of Ca2+ from the edge to the centre were calculated by fitting the curve with a single exponential. The rate constant for this rise was found to be 68 ms−1 in the absence of ryanodine and 77 ms−1 after application.
Mathematical modelling of calcium changes in Purkinje cells
A computer model of the calcium movements and fluo-3 fluorescence signals in Purkinje fibres was constructed (see Methods). Since there appears to be little information in the literature regarding Ca2+ movements in Purkinje cells we used voltage clamp techniques to measure the time course of the Ca2+ current in the presence of ryanodine and then fitted the model to the resulting data (Fig. 5). Since the time course of calcium influx was known and CICR was blocked, with suitable adjustment of parameters, the computer model should be able to describe the passive processes that determine the time course of calcium movements across the cell. An optimal fit was obtained with the [ATP] set to 5 mm, [fluo-3] to 60 μm and [TNC] to 50 μm. The former two parameters acted as validating benchmarks for the model as they should be closely related to the solution of the patch pipette-filling solution that was used to voltage clamp the cell. The close agreement between these parameters and the composition of patch pipette-filling solution suggested that we obtained a reasonable first order description of the calcium buffering properties as well as calcium transport by passive processes. Next, the model was re-run with a calcium influx at the surface scaled by a factor of 1.5 which resulted in the peripheral fluorescence transient closely matching the experimental observations obtained in the absence of ryanodine. With this modification, it is notable that the model also reproduced the peak amplitude of the Ca2+ transient in the centre of the cell also (Fig. 5). The ability of the model to reproduce the amplitude of the central Ca2+ changes when the SR was not inhibited by ryanodine suggests that the observed changes in Ca2+ could be explained by simple buffered diffusion alone. In other words, this result implies that it is not necessary to invoke any compartment except the cell surface to explain the observed Ca2+ changes. In addition, since simple scaling of the calcium influx at the cell edge enabled the model to reproduce the peripheral Ca2+ transient also, the model results suggest that CICR contributed about 50% of the Ca2+ influx underlying the Ca2+ transient at the cell surface and that the time course of this calcium release was very similar to that of the calcium current. Although the model did not reproduce the time course of the central Ca2+ transient exactly, we ascribe this shortcoming to uncertainties in the exact kinetic properties of the Ca2+ buffers as well as the possibility that the cell was ellipsoidal (rather than circular) in cross section. This deficiency does not affect the conclusion that the increased amplitude of the central Ca2+ transient observed in the absence of ryanodine could be explained by simple buffered diffusion alone.
Figure 5. Comparison of experimentally determined and computed calcium transients in Purkinje cells.

Top, representative recordings of ICa measured at +10 mV from a Purkinje cell. ICa measured at +10 mV was used to determine the time course of Ca2+ movement. A and B, graphs showing time course of Ca2+ movement and fluo-3 fluorescence signals obtained from a Purkinje cell in the absence and presence of ryanodine. Ryanodine decreased the fluorescence intensity but did not change the time course of Ca2+ movement. C and D, time course of Ca2+ movement and fluo-3 fluorescence signals obtained by mathematical modelling (see Results). No CICR mechanism was included in the formulation and all Ca2+ movement was by simple diffusion. The time course of Ca2+ movement in the model resembles the experimental data suggesting that the amplitude of the central transient is the result of simple diffusion from the cell periphery.
Localization of Ca2+ sparks in Purkinje cells
As rabbit Purkinje cells lacked t-tubules (Fig. 1a), it seemed likely that dyadic junctions between the sarcolemma and the SR should occur only at the periphery of the cell. Since Ca2+ sparks (Cheng et al. 1993) are believed to arise from a cluster of RyRs in such dyadic junctions (Cannell et al. 1994; Bridge et al. 1999), we expected to find sparks near the cell periphery. On the other hand, if sparks did not depend on clusters of RyRs in restricted spaces it might be possible to observe them in the cell interior since RyRs are also present there. In initial experiments, we observed that the frequency of Ca2+ sparks was very low in quiescent Purkinje cells under control conditions. Since increasing external Ca2+ increases the frequency of spontaneous spark occurrence (Cheng et al. 1996b), we superfused Purkinje cells with a buffer containing 5 mm Ca2+-1 μm isoproterenol and evoked [Ca2+]i transients by field stimulation (Fig. 6). After exposure to this solution, the intensity of the Ca2+ transient (Fig. 6B) markedly increased at the cell periphery with a more modest increase at the cell centre compared with control (Fig. 6A). The maximum F/Fo was 4.12 ± 0.26 at the edge and 2.27 ± 0.11 at the centre of the Purkinje cells (n = 5). The distribution of Ca2+ during these [Ca2+]i transients is easier to appreciate in the 3-dimensional reconstructions of the fluorescence signal (Fig. 6C and D). Images obtained from cells treated with isoproterenol revealed spark-like release events only at the cell periphery after repolarization.
Figure 6. Calcium sparks associated with evoked calcium transients in a Purkinje myocyte.

A, ratio images of transverse line scans from a Purkinje cell recorded under control conditions (2 mm external Ca2+, left side) and after application of 5 mm Ca2+-1 μm isoproterenol (B). Cells were field stimulated at a cycle length of 2 s. After application of 5 mm Ca2+-1 μm isoproterenol, the relative fluorescence intensity (F/Fo) of the Ca2+ transient was greater compared with control conditions. C and D, a 3-dimensional reconstructon of A and B, respectively (filtered with a 3rd order boxcar filter). This provides an impression of the distribution of Ca2+ during transients evoked in the presence and absence of isoproterenol. Spark-like events are apparent in both the 2- and 3-dimensional images obtained for isoproterenol-treated cells.
To localize the distribution of Ca2+ sparks in Purkinje cells, we performed x,y scans on resting Purkinje cells exposed to a 5 mm Ca2+-1 μm isoproterenol solution. A representative montage of images (Fig. 7) obtained from a single Purkinje cell shows that sparks are only observed at the cell periphery. Furthermore, the amplitude (F/Fo) of these sparks was between 1.5 and 2.5 which is similar to values obtained in studies on ventricular cells (see Cheng et al. 1996b). In 132 sweeps recorded from four Purkinje cells, Ca2+ sparks were observed in 64 sweeps and no sparks were observed after exposure to thapsigargin (500 nm). These results confirm the involvement of the SR in the genesis of these calcium sparks, again similar to results obtained from ventricular cells.
Figure 7. Montage of x,y line scan diagrams showing the distribution of Ca2+ sparks in a quiescent Purkinje cell.

Each panel represents one sweep of the cell. Cells were exposed to 5 mm Ca2+-1 μm isoproterenol and were not field stimulated. The first image (uppermost panel) represents 30 signal-averaged images. In the ratio images, the average fluorescence intensity from 30 x,y sweeeps was determined (Fo, shown at the top of the figure). The fluorescence intensity from each panel (F) was then divided by the fluorescence intensity of the averaged image (Fo). The intensity (F/Fo) of 8 representative sweeps are shown in this figure. This montage clearly shows that Ca2+ sparks occurred at the periphery of the Purkinje cell and no central Ca2+ release was observed.
Because of the relatively slow rate of scanning (about 300 ms per frame), the x,y scans in Fig. 7 do not give detailed information concerning the magnitude and time course of Ca2+ sparks. To examine spontaneous spark formation in greater detail, we performed transverse x,t scans under the same conditions as shown in Fig. 7. The sparks in the Purkinje cell only occurred in close proximity to the surface membrane (Fig. 8C and D). In contrast and as reported by others (Cheng et al. 1995; Tanaka et al. 1998), sparks in ventricular cells are observed throughout the cell. The time course of decay of the sparks in both cell types appeared to be similar. These results suggest that evoked Ca2+ transients and Ca2+ sparks originate at the periphery of Purkinje cells, presumably where the sarcolemma and SR form junctions.
Figure 8. x,t line scan images (F/Fo) recorded from a ventricular cell (A and B) and a Purkinje cell (C and D) displaying individual sparks.
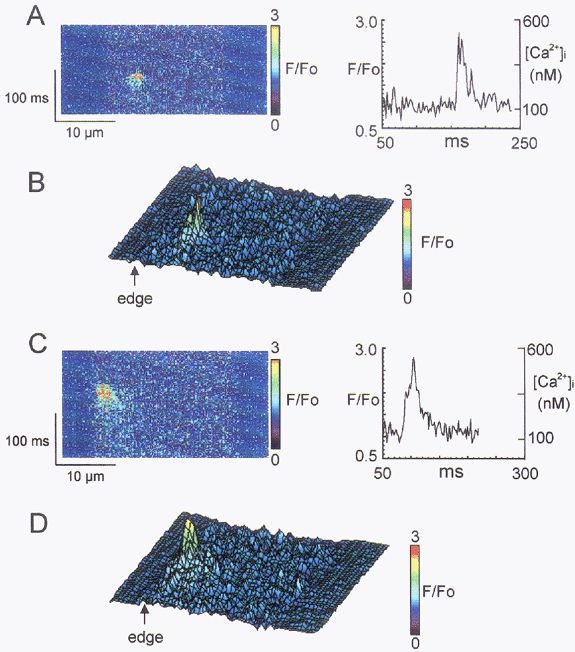
Cells were exposed to 5 mm Ca2+-1 μm proterenol and spontaneous sparks recorded. The spark in the Purkinje cell (C and D) occurred in close proximity to the cell membrane and Ca2+ diffused to more internal sites over time. The spark in the ventricular cell was not limited to the periphery of the cell. The magnitude and the time course of decay of the sparks in both cell types appeared to be similar. B and D show a 3-dimensional reconstruction of A and C, respectively.
Since the Purkinje cells were quiescent and were being superfused with a buffer containing 5.4 mm external K+, it seemed likely that the cells were well polarized. Therefore it was unlikely that Ca2+ influx through L-type Ca2+ channels was responsible for initiation of these spontaneous Ca2+ sparks. We tried to exclude further the possibility that Ca2+ influx through L-type Ca2+ channels initiated spontaneous Ca2+ sparks by measuring the frequency of spark production in Purkinje myocytes before and after addition of 10 μm nifedipine, an inhibitor of L-type Ca2+ channels. Quiescent cells were scanned in the x,y mode once per second. Under control conditions, Ca2+ sparks were observed in 27/60 sweeps from three Purkinje cells but only observed at peripheral sites. Myocytes were then exposed to 10 μm nifedipine. As the nifedipine was applied, cells were briefly field stimulated at a cycle length of 2 s to promote blockade of the L-type Ca2+ channels (Sanguinetti & Kass, 1984). Application of nifedipine did not decrease the frequency of sparks (23/60 sweeps) after 2 min of exposure to the drug. These results suggest that spontaneous Ca2+ sparks in resting Purkinje cells are not initiated by influx of Ca2+ via L-type Ca2+ channels.
DISCUSSION
Ca2+ transients in Purkinje cells
When Ca2+ transients were activated by field stimulation, line scan images showed a U-shaped profile (Fig. 2) which indicated that Ca2+ release is initiated at the cell periphery and Ca2+ then moves towards the cell centre by diffusion. When we stained the cell with a monoclonal antibody specific for RyR2 we found that RyRs exist in rows perpendicular to the sarcolemma throughout the cell interior although the membrane stain di-8-ANEPPS indicated a complete lack of t-tubules. These results are consistent with the findings of others (e.g. Sommer & Johnson, 1968; Hatem et al. 1997). It follows that junctions between RyRs and the sarcolemma could only occur at the cell periphery. Current cardiac E-C coupling theories propose that evoked Ca2+ transients represent the summation of many Ca2+ sparks which originate at junctions between the sarcolemma and SR (Cannell et al. 1994; Shacklock et al. 1995; Tanaka et al. 1998), and consistent with this idea, Ca2+ sparks were also only observed at the cell periphery. Therefore, the structural data, location of calcium sparks and the peripheral activation of calcium transients are in accord. The requirement for junctional regions may be due to the need for Ca2+ influx via Ca2+ channels to be sufficiently concentrated (or localized in space) to achieve a sufficiently high concentration to activate one or more RyRs (Santana et al. 1996; Bridge et al. 1999). The restricted nature of the junctional space would also help increase local Ca2+ levels (Soeller & Cannell, 1999) to promote activation of junctional RyRs.
The spontaneously occurring Ca2+ sparks had a fluorescence intensity (F/Fo) of approximately 1.3-2.5 and could be abolished by thapsigargin, confirming the involvement of the SR in their genesis. As such, they resembled sparks observed in other heart cells (Cheng et al. 1996b; Satoh et al. 1997). However, it has been suggested that small calcium release events may occur from single RyRs or small clusters of RyRs separate from those associated with junctions (Lipp & Niggli, 1996). The central RyRs which were detected by immunohistochemistry could perform such a role, but computer modelling of the electrically evoked Ca2+ transient did not reveal a component of calcium release at the cell centre (see below). Consistent with this result, we did not detect any spontaneous release events away from the cell periphery. The lack of detectable spontaneous Ca2+ release cannot be explained by the distance of the central RyRs from the cell surface (and the lower [Ca2+] experienced by such RyRs) since the resting Ca2+ level was sufficient to produce spontaneous surface Ca2+ sparks in the presence of nifedipine. Three possible explanations for this result are: (1) RyRs in the centre of the cell are effectively ‘silent’ (and do not contribute significantly to the electrically evoked Ca2+ transient). (2) The junctional RyRs at the surface membrane are exposed to higher levels of Ca2+ at rest. Since the interior of the cell is in continuity with the interior surface of the cell, it is difficult to explain how the junctional RyRs could experience a higher resting level of Ca2+ unless the junctional region has a higher level of calcium entry (or lower level of calcium extrusion) at rest than the rest of the surface membrane. (3) Sparks must arise from clusters of RyRs which are only present at junctions between the surface membrane and the SR.
It is possible that the RyRs and the SR elements that contain them are targeted to the cell cytoskeleton associated with Z-lines, but since t-tubules do not invaginate the cell interior they are not assembled into clusters from which sparks may occur. Their inability to release calcium during the calcium transient may then be explained by the low amplitude of the calcium trigger arising from calcium diffusion from the cell surface to the periphery. The lack of developed clusters would explain the absence of detectable spontaneous calcium release in the cell centre (and thereby overcome the need to propose different local surface membrane properties) since the local calcium flux produced by a single RyR would not be amplified by its neighbours in the cluster (it is also possible that there may be a more limited SR calcium store in their location). In this scheme, the RyRs may be functional but are uncoupled from their normal function by the geometric organization associated with Purkinje cell microarchitecture. In this regard, we can consider that the central Purkinje RyRs may be similar to the ‘extra-junctional’ RyRs of ventricular muscle (Franzini-Armstrong et al. 1999). Although we favour this explanation, we cannot exclude the possibility that the RyRs in the cell centre may be ‘silent’.
In our study, we observed a monotonic rising phase of the Ca2+ transient, which has also been observed by others in rabbit Purkinje cells using epifluorescence (Sipido et al. 1993; Papp et al. 1995). In contrast, canine Purkinje cells exhibit a two-stage rise in the Ca2+ transient (Wier & Isenberg, 1982; Boyden et al. 2000). Furthermore, Ca2+ waves were frequently noted in that preparation (Boyden et al. 2000). We never observed Ca2+ waves in rabbit Purkinje cells, even during Ca2+ overload (Cordeiro et al. 2000). However, we have observed Ca2+ waves in canine Purkinje cells (unpublished observations). Therefore, the nature of the Ca2+ transient appears to be different in rabbit and canine Purkinje cells, even though both preparations lack t-tubules.
Ca2+ transients in atrial cells, which also lack t-tubules, are also initiated at the cell periphery (Huser et al. 1996). Huser et al. (1996) reported that in these cells, spontaneous Ca2+ sparks were rarely observed in the cell centre but commonly observed at the cell periphery. Evidence for evoked Ca2+ release in the centre of these cells was also obtained by these authors, but it is important to note that (1) the spatial pattern of Ca2+ movement across the atrial cells was much less uniform than observed in the Purkinje cells studied here and (2) the central Ca2+ transient could have the same amplitude as the peripheral transient. These observations suggest that the atrial cell relies on Ca2+ diffusion to trigger SR calcium release from internal sites (Huser et al. 1996) while the Purkinje cell has a very limited capacity to reinforce the inward propagation of Ca2+ via CICR. Given the relatively low amounts of contractile protein in Purkinje cells (Truex & Smythe, 1965) compared with atrial cells (Sommer & Johnson, 1979), these differences in the pattern of calcium release within the cell seem consistent with function. In addition, since the contractile protein may be concentrated at the periphery of the Purkinje cell in some cases (Truex & Smythe, 1965), calcium release from deeper SR (in such cells) would serve no obvious function in either electrical propagation or mechanical contraction.
Modelling the Purkinje cell Ca2+ transient
The simple computer model presented here was able to reproduce the major spatio-temporal features of the Purkinje cell Ca2+ transient. By fitting the parameters of the model to the Ca2+ transient observed in the presence of ryanodine with a measured Ca2+ influx (due to the Ca2+ current) we obtained an estimate of the buffering properties of the cell. By fixing the buffering parameters we showed that the increased [Ca2+] observed in the cell centre in the absence of ryanodine (i.e. when the SR was not inhibited) could be explained entirely by the increased Ca2+ levels that occur at the cell periphery in these conditions. From this result we concluded that there is little evidence for evoked SR calcium release at any site other than the cell surface. However, the model also showed that a much lower concentration of fixed binding sites (Tn) appeared to be present than in models of ventricular cells. The value we obtained for these sites (50 μm) is considerably less than that usually considered to be appropriate for mathematical models of ventricular cells. However, we do not consider this to be a deficiency of the present model, but rather that it reflects the lower density of contractile machinery present in these cells (see above).
The model also showed that the peripheral release of Ca2+ by the SR was a surprisingly small fraction of the Ca2+ influx due to the Ca2+ current. It is likely that the smaller than normal Ca2+ transient was the result of the conditions used to achieve voltage clamp recordings, but the internal dialysis of the cell by the voltage clamp pipette and possible alteration of SR Ca2+ load is unavoidable with this technique. This concern leads to the possibility that, under normal conditions, the increased SR Ca2+ content might permit CICR in the cell interior. When isoproterenol was applied there was a marked increase in the amplitude of the peripheral Ca2+ transient, confirming an increase in SR content (Fig. 6). However, under these conditions the U-shaped diffusion profile was not diminished suggesting that diffusion to the centre of the cell, which would be accelerated by internal SR release, was not very different from that observed in control conditions. In addition, the magnitude of the Ca2+ transient at the edge of the cell was increased by a factor of ≈5 while at the centre it increased by a factor of only ≈1.5. The computer model also predicted a similar disproportionate increase in Ca2+ at the cell periphery compared with the cell centre (due to local buffer saturation – not shown). It follows that even when the SR calcium content was augmented by isoproterenol, Ca2+ release by internal SR Ca2+ stores remained very small (or non-existent).
Local control of SR release in Purkinje cells
The spontaneous Ca2+ sparks in Purkinje cells (which only occurred at the cell periphery) were similar to those measured in other cell types (Cheng et al. 1996a). Others have shown that the primary site of Ca2+ release in ventricular muscle is in regions adjacent to the t-tubules (inferred to be junctional regions) (Shacklock et al. 1995). This similarity suggests that the existence of typical sparks is predicated on the existence of junctions between the cell surface membrane and the SR. The RyRs in the cell interior revealed by immunocytochemistry would therefore be exposed to a much lower [Ca2+] and probably would not be activated. However, the activation of L-type Ca2+ channels is not an absolute requirement for the activation of Ca2+ sparks since spontaneous Ca2+ sparks also occur at rest during L-type Ca2+ channel blockade (e.g. Cannell et al. 1994).
To reconcile the presence of central RyRs with a lack of any detectable Ca2+ release we suggest that such ‘silent’ RyRs occur at low local densities i.e. they are not assembled into clusters (see below). Although such isolated RyRs have been proposed to underlie microscopic Ca2+ release events called ‘calcium quarks’ (Lipp & Niggli, 1996), we did not detect any evoked or spontaneous Ca2+ release in the cell centre.
The lack of detectable Ca2+ release at internal sites supports the idea that (under normal circumstances) Ca2+ does not enter a common pool to stimulate regenerative release of Ca2+ from other RyRs. Stern (1992) has explained in some detail the difficulties associated with such ‘common pool models’ for achieving graded or controlled responses. Our results are consistent with the local control mechanism described by Stern (1992) which requires the presence of a Ca2+‘synapse’ to confine regeneration. The clustering of RyRs in junctional regions at the sarcolemma provides high gain that is stable and spatial separation of RyRs will limit the possibility of regeneration. In the case of Purkinje fibres, if the central RyRs were activated by the levels of Ca2+ that occur as a result of calcium movement from the periphery, they probably would also be activated at resting levels of Ca2+ as well. In this case, the RyRs would not be under the tight control of the surface membrane and they would represent an unstable system with a high probability for propagating spontaneous calcium release. The uncoupling of the central RyRs from E-C coupling would therefore help prevent uncontrolled regenerative release and the resulting electrical disturbances (e.g. transient depolarizations). Given the importance of the Purkinje system in the spread of cardiac activation, it is possible that this uncoupling is an important modification of E-C coupling to reduce the probability of abnormal activation.
Acknowledgments
This study was supported by grants from the Nora Eccles Treadwell Foundation and the Richard A. and Nora Eccles Harrison Fund for Cardiovascular Research (K.W.S. and J.H.B.B.), the New Zealand Heart Foundation and Health Research Council (NZ) (M.B.C.) and the National Institutes of Health (HL-52388, K.W.S.; HL-62690, 52388, J.H.B.B.). J.M.C. is a recipient of a fellowship from the Alberta Heritage Foundation for Medical Research. The authors thank Dr Andy Weyrich for his assistance with the immunofluorescence labelling.
References
- Baylor SM, Hollingworth S. Model of sarcomeric Ca2+ movements, including ATP Ca2+ binding and diffusion, during activation of frog skeletal muscle. Journal of General Physiology. 1998;112:297–316. doi: 10.1085/jgp.112.3.297. [DOI] [PMC free article] [PubMed] [Google Scholar]
- Boyden PA, Pu J, Pinto J, ter Keurs HE. [Ca2+] transients and [Ca2+] waves in Purkinje cells. Circulation Research. 2000;86:448–455. doi: 10.1161/01.res.86.4.448. [DOI] [PMC free article] [PubMed] [Google Scholar]
- Bridge JH, Ershler PR, Cannell MB. Properties of Ca2+ sparks evoked by action potentials in mouse ventricular myocytes. Journal of Physiology. 1999;518:469–478. doi: 10.1111/j.1469-7793.1999.0469p.x. [DOI] [PMC free article] [PubMed] [Google Scholar]
- Cannell MB, Allen DG. Model of calcium movement during activation in the sarcomere of frog skeletal muscle. Biophysical Journal. 1984;45:913–925. doi: 10.1016/S0006-3495(84)84238-1. [DOI] [PMC free article] [PubMed] [Google Scholar]
- Cannell MB, Cheng H, Lederer WJ. Spatial non-uniformities in [Ca2+]i during excitation-contraction coupling in cardiac myocytes. Biophysical Journal. 1994;67:1942–1956. doi: 10.1016/S0006-3495(94)80677-0. [DOI] [PMC free article] [PubMed] [Google Scholar]
- Cheng H, Cannell MB, Lederer WJ. Propagation of excitation-contraction coupling into ventricular myocytes. Pflügers Archiv. 1994;428:415–417. doi: 10.1007/BF00724526. [DOI] [PubMed] [Google Scholar]
- Cheng H, Cannell MB, Lederer WJ. Partial inhibition of Ca2+ current by methoxyverapamil (D600) reveals spatial non-uniformities in [Ca2+]i during excitation-contraction coupling in cardiac myocytes. Circulation Research. 1995;76:236–241. doi: 10.1161/01.res.76.2.236. [DOI] [PubMed] [Google Scholar]
- Cheng H, Lederer WJ, Cannell MB. Calcium sparks: elementary events underlying excitation-contraction coupling. Science. 1993;262:740–744. doi: 10.1126/science.8235594. [DOI] [PubMed] [Google Scholar]
- Cheng H, Lederer MR, Lederer WJ, Cannell MB. Calcium sparks and [Ca2+]i waves in cardiac myocytes. American Journal of Physiology. 1996a;270:C148–159. doi: 10.1152/ajpcell.1996.270.1.C148. [DOI] [PubMed] [Google Scholar]
- Cheng H, Lederer MR, Xiao RP, GomeZ AM, Zhou YY, Ziman B, Spurgeon H, Lakatta EG, Lederer WJ. Excitation-contraction coupling in heart: new insights from Ca2+ sparks. Cell Calcium. 1996b;20:129–140. doi: 10.1016/s0143-4160(96)90102-5. [DOI] [PubMed] [Google Scholar]
- Cordeiro JM, Spitzer KW, Bridge JH. Early and delayed afterdepolarizations in rabbit heart Purkinje cells viewed by confocal microscopy. Biophysical Journal. 2000;78:223A. doi: 10.1054/ceca.2000.0192. [DOI] [PubMed] [Google Scholar]
- Cordeiro JM, Spitzer KW, Ershler PR, Giles WR, Bridge JH. Calcium sparks are localized at the cell periphery in Purkinje myocytes. Biophysical Journal. 1999;76:A465. [Google Scholar]
- Cordeiro JM, Spitzer KW, Giles WR. Repolarizing K+ currents in rabbit heart Purkinje cells. Journal of Physiology. 1998;508:811–823. doi: 10.1111/j.1469-7793.1998.811bp.x. [DOI] [PMC free article] [PubMed] [Google Scholar]
- Fabiato A. Time and calcium dependence of activation and inactivation of calcium-induced calcium release of calcium from the sarcoplasmic reticulum of a skinned cardiac Purkinje cell. Journal of General Physiology. 1985;85:247–290. doi: 10.1085/jgp.85.2.247. [DOI] [PMC free article] [PubMed] [Google Scholar]
- Franzini-Armstrong C, Protasi F, Ramesh V. Shape, size and distribution of Ca2+ release units and couplons in skeletal and cardiac muscle. Biophysical Journal. 1999;77:1528–1539. doi: 10.1016/S0006-3495(99)77000-1. [DOI] [PMC free article] [PubMed] [Google Scholar]
- Hatem SN, Benardeau A, Rucker-Martin C, Marty I, de Chamisso P, VillaZ M, Mercadier JJ. Different compartments of sarcoplasmic reticulum participate in the excitation-contraction coupling process in human atrial myocytes. Circulation Research. 1997;80:345–353. doi: 10.1161/01.res.80.3.345. [DOI] [PubMed] [Google Scholar]
- Huser J, Lipsius SL, Blatter LA. Calcium gradients during excitation-contraction coupling in cat atrial myocytes. Journal of Physiology. 1996;494:641–651. doi: 10.1113/jphysiol.1996.sp021521. [DOI] [PMC free article] [PubMed] [Google Scholar]
- Jorgensen AO, Shen AC, Arnold W, McPherson PS, Campbell KP. The Ca2+-release channel/ryanodine receptor is localized in junctional and corbular sarcoplasmic reticulum in cardiac muscle. Journal of Cell Biology. 1993;120:969–980. doi: 10.1083/jcb.120.4.969. [DOI] [PMC free article] [PubMed] [Google Scholar]
- Junker J, Sommer JR, Sar M, Meissner G. Extended junctional sarcoplasmic reticulum of avian cardiac muscle contains functional ryanodine receptors. Journal of Biological Chemistry. 1994;269:1627–1634. [PubMed] [Google Scholar]
- Lai FA, Liu QY, Xu L, El-Hashem A, Kramarcy NR, Sealock R, Meissner G. Amphibian ryanodine receptors are related to those of mammalian skeletal or cardiac muscle. American Journal of Physiology. 1992;263:C365–372. doi: 10.1152/ajpcell.1992.263.2.C365. [DOI] [PubMed] [Google Scholar]
- Lipp P, Niggli E. Submicroscopic calcium signals as fundamental events of excitation-contraction coupling in guinea-pig cardiac myocytes. Journal of Physiology. 1996;492:31–38. doi: 10.1113/jphysiol.1996.sp021286. [DOI] [PMC free article] [PubMed] [Google Scholar]
- Papp Z, Sipido KR, Callewaert G, Carmeliet E. Two components of [Ca2+]i-activated Cl− current during large [Ca2+]i transients in single rabbit heart Purkinje cells. Journal of Physiology. 1995;483:319–330. doi: 10.1113/jphysiol.1995.sp020588. [DOI] [PMC free article] [PubMed] [Google Scholar]
- Sanguinetti MC, Kass RS. Voltage-dependent block of calcium channel current in the calf cardiac Purkinje fiber by dihydropyridine calcium channel antagonists. Circulation Research. 1984;55:336–348. doi: 10.1161/01.res.55.3.336. [DOI] [PubMed] [Google Scholar]
- Santana LF, Cheng H, GomeZ AM, Cannell MB, Lederer WJ. Relation between the sarcolemmal Ca2+ current and Ca2+ sparks and local control theories for cardiac excitation-contraction coupling. Circulation Research. 1996;78:166–171. doi: 10.1161/01.res.78.1.166. [DOI] [PubMed] [Google Scholar]
- Satoh H, Blatter LA, Bers DM. Effects of [Ca2+]i, SR Ca2+ load, and rest on Ca2+ spark frequency in ventricular myocytes. American Journal of Physiology. 1997;272:H657–668. doi: 10.1152/ajpheart.1997.272.2.H657. [DOI] [PubMed] [Google Scholar]
- Scamps F, Carmeliet E. Delayed K+ current and external K+ in single cardiac Purkinje cells. American Journal of Physiology. 1989;257:C1086–1092. doi: 10.1152/ajpcell.1989.257.6.C1086. [DOI] [PubMed] [Google Scholar]
- Shacklock PS, Wier WG, Balke CW. Local Ca2+ transients (Ca2+ sparks) originate at transverse tubules in rat heart cells. Journal of Physiology. 1995;487:601–608. doi: 10.1113/jphysiol.1995.sp020903. [DOI] [PMC free article] [PubMed] [Google Scholar]
- Sipido KR, Callewaert G, Carmeliet E. [Ca2+]i and [Ca2+]i-dependent chloride current in single Purkinje cells from rabbit heart. Journal of Physiology. 1993;468:641–667. doi: 10.1113/jphysiol.1993.sp019793. [DOI] [PMC free article] [PubMed] [Google Scholar]
- Soeller C, Cannell MB. Examination of the transverse tubular system in living cardiac rat myocytes by 2-photon microscopy and digital image-processing techniques. Circulation Research. 1999;84:266–275. doi: 10.1161/01.res.84.3.266. [DOI] [PubMed] [Google Scholar]
- Sommer JR, Johnson EA. A comparative study of Purkinje fibers and ventricular fibers. Journal of Cell Biology. 1968;36:497–526. doi: 10.1083/jcb.36.3.497. [DOI] [PMC free article] [PubMed] [Google Scholar]
- Sommer JR, Johnson EA. Cardiac ultrastructure. In: Berne RM, Sperelakis N, Geiger SR, editors. Handbook of Physiology, The Cardiovascular System. Bethesda, MD, USA: American Physiological Society; 1979. pp. 113–186. chap. 5. [Google Scholar]
- Spitzer KW, Cordeiro JM, Ershler PR, Giles WR, Bridge JH. Confocal microscopy reveals that calcium transients in Purkinje myocytes are initiated at the cell periphery. Circulation. 1997;96(supple I):I-239. [Google Scholar]
- Stern MD. Theory of excitation-contraction coupling in cardiac muscle. Biophysical Journal. 1992;63:497–517. doi: 10.1016/S0006-3495(92)81615-6. [DOI] [PMC free article] [PubMed] [Google Scholar]
- Tanaka H, Sekine T, Kawanishi T, Nakamura R, Shigenobu K. Intrasarcomere [Ca2+] gradients and their spatio-temporal relation to Ca2+ sparks in rat cardiomyocytes. Journal of Physiology. 1998;508:145–152. doi: 10.1111/j.1469-7793.1998.145br.x. [DOI] [PMC free article] [PubMed] [Google Scholar]
- Truex RC, Smythe MQ. Comparative morphology of the cardiac conduction system in animals. Annals of the New York Academy of Sciences. 1965;127:19–33. doi: 10.1111/j.1749-6632.1965.tb49390.x. [DOI] [PubMed] [Google Scholar]
- Wier WG, Isenberg G. Intracellular [Ca2+] transients in voltage clamped cardiac Purkinje fibers. Pflügers Archiv. 1982;392:284–290. doi: 10.1007/BF00584312. [DOI] [PubMed] [Google Scholar]