

Abstract
Recent observations showed that a mitochondrial Ca2+ increase is necessary for an NMDA receptor stimulus to be toxic to cortical neurones. In an attempt to determine the magnitude of the Ca2+ fluxes involved in this phenomenon, we used carbonylcyanide-p-(trifluoromethoxy)phenylhydrazone (FCCP), a mitochondrial proton gradient uncoupler, to release mitochondrial free calcium ([Ca2+]m) during and following a glutamate stimulus, and magfura-2 to monitor cytoplasmic free calcium ([Ca2+]c).
FCCP treatment of previously unstimulated neurones barely changed [Ca2+]c whereas when added after a glutamate stimulus it elevated [Ca2+]c to a much greater extent than did exposure to glutamate, suggesting a very large accumulation of Ca2+ in the mitochondria.
Mitochondrial Ca2+ uptake was dependent on glutamate concentration, whereas the changes in the overall quantity of Ca2+ entering the cell, obtained by simultaneously treating neurones with glutamate and FCCP, showed a response that was essentially all-or-none.
Mitochondrial Ca2+ uptake was also dependent on the nature and duration of a given stimulus as shown by comparing [Ca2+]m associated with depolarization and treatment with kainate, NMDA or glutamate. Large mitochondrial Ca2+ accumulation only occurred after a glutamate or NMDA stimulus.
These studies provide a method of estimating the accumulation of Ca2+ in the mitochondria of neurones, and suggest that millimolar concentrations of Ca2+ may be reached following intense glutamate stimulation. It was shown that substantially more Ca2+ enters neurones following glutamate receptor activation than is reflected by [Ca2+]c increases.
Glutamate is the predominant excitatory neurotransmitter in mammalian brain (Headley & Grillner, 1990). However, an excess of glutamate can be toxic to various populations of neuronal cells (Rothman & Olney, 1986; Choi et al. 1987; Manev et al. 1989). Delayed glutamatergic excitotoxicity has been identified as a consequence of NMDA receptor activation which requires an intracellular calcium ([Ca2+]i) increase (Choi, 1987; Randall & Thayer, 1992; Hartley et al. 1993). Although mitochondria are known to accumulate Ca2+ following cytosolic free calcium ([Ca2+]c) increases in neurones (Nicholls & Åkerman, 1982; White & Reynolds, 1995), it was thought for a long time that this process was not involved in cell death but in preventing toxicity associated with elevated [Ca2+]i. However, recent studies showed that when mitochondrial Ca2+ uptake is prevented during glutamate stimulation, neuronal cells survive toxic doses (Dessi et al. 1995; Budd & Nicholls, 1996b; Stout et al. 1998).
Ca2+ entry in mitochondria may be linked to cell death in many ways. These include changes in the polarization state of the mitochondria which jeopardize the energy balance maintained by the metabolic functions of the mitochondria and also lead to the production of reactive oxygen species (for reviews see Duchen, 1999; Nicholls & Budd, 2000). Several studies have monitored alterations in mitochondrial free calcium ([Ca2+]m) using fluorescent indicators such as rhod-2 (Peng & Greenamyre, 1998; Peng et al. 1998). However, rhod-2 has a relatively high affinity for Ca2+ and it is not clear that it can accurately report [Ca2+]m under conditions involving large fluxes of Ca2+ which may lead to the saturation of the dye.
We used the protonophore carbonylcyanide-p-(trifluoromethoxy)phenylhydrazone (FCCP) to release mitochondrial Ca2+ into the cytoplasm (Duchen, 1990; Thayer & Miller, 1990; Kiedrowski & Costa, 1995), where it is measured with the low affinity Ca2+-sensitive fluorescent dye magfura-2 (Raju et al. 1989; Stout & Reynolds, 1999). We were able to demonstrate that mitochondrial Ca2+ accumulation is large compared to that seen in the cytoplasm during a given stimulus and to establish the kinetics of Ca2+ fluxes during and after different stimuli.
METHODS
Cell culture
Pregnant Sprague-Dawley female rats were anaesthetized with diethyl ether inhalation until complete loss of responsiveness to tail and foot pinch was achieved. Embryonic day 17 fetuses were released from the uterus and decapitated. The mothers were then humanely killed without being allowed to regain consciousness. The forebrains were then removed from the fetuses and dissected as follows. The lobes were incubated in 0.005-0.01 % trypsin in 2 ml of Ca2+, Mg2+-free medium (mm: 115 NaCl, 5.4 KCl, 26.2 NaHCO3, 9.9 NaH2PO4, 5.5 glucose; 0.001 % phenol red, and minimum essential medium amino acids; pH was adjusted to 7.4 with NaOH) for 30 min at 37 °C. The tissue was triturated an average of 12 times before the volume was brought to 10 ml and viability determinations were made with trypan blue (0.08 %) exclusion. The plating suspension was diluted to 450 000 cells ml−1 using plating medium (v/v solution of 90 % Dulbecco's modified Eagle's medium, 10 % heat-inactivated fetal bovine serum, 24 u ml−1 penicillin, 24 μg ml−1 streptomycin; final glutamine concentration, 3.9 mm). Cells were plated onto poly-d-lysine-coated (Mr= 120 400; 40 mg ml−1) 31 mm glass coverslips that were inverted 1 day later into maintenance medium (horse serum substituted for fetal bovine serum, all other constituents identical). Neurones were used after 13-16 days in culture, with no further medium changes. These culture conditions provide the sparse, glia-poor neuronal cultures that are optimal for fluorescence microscopy measurements. Each experiment described was performed on 8-25 neurones per coverslip and 5-15 coverslips from two or more different culture dates. All procedures using animals were in accordance with the National Institutes of Health Guide for the Care and Use of Laboratory Animals and were approved by the University of Pittsburgh's Institutional Animal Care and Use Committee.
Solutions and drugs
For perfusion of coverslips in the fluorescence microscopy experiments, we used a Hepes-buffered salt solution (HBSS, adjusted to pH 7.4 with NaOH) of the following composition (mm): NaCl 137, KCl 5, NaHCO3 10, Hepes 20, glucose 5.5, KH2PO4 0.6, Na2HPO4 0.6, CaCl2 1.4 and MgSO4 0.9. Ca2+ was omitted in the Ca2+-free HBSS buffer; high KCl buffer contained 50 mm KCl and 92 mm NaCl. The drugs used in the present experiments were purchased from Sigma (USA) and prepared from the following stock solutions: 1-100 μm glutamate from 10 mm in water, 1 μm glycine from 10 mm in water, 750 nm FCCP from 750 μm in methanol, 100 μm kainate from 10 mm in water and 300 μmN-methyl-d-aspartic acid (NMDA) from 10 mm in water. One micromolar glycine was always added to the glutamate- and NMDA-containing solutions. For treatments with FCCP alone, the drug was diluted in Ca2+-free buffer to avoid external Ca2+ entry in the cells.
[ca2+]c measurements
A 1 mm stock solution for the acetoxymethyl ester form of magfura-2 (magfura-2 AM; Molecular Probes) was prepared in anhydrous DMSO. Coverslips were incubated in HBSS containing 5 μm of magfura-2, 0.5 % DMSO and 5 mg ml−1 bovine serum albumin for 10-15 min at 37 °C. Cells were then rinsed with HBSS, mounted on a record chamber and perfused with HBSS at a rate of 20 ml min−1. All recordings were made at room temperature (20-25 °C). The imaging system used in this study consisted of a Nikon Diaphot 300 inverted microscope fitted with a x 40 objective, a digital camera (Hamamatsu Corporation, NJ, USA) and a 75 W xenon lamp-based monochromator light source (Applied Scientific Instrumentation Inc., OR, USA) as specified (Stout et al. 1998). Cells were alternately illuminated with 335 nm and 375 nm wavelengths. Incident light was attenuated with neutral density filters (ND 0.5 and 0.3 for 16 % transmittance; Omega Optical, VT, USA) and emitted fluorescence passed through a 515 nm dichroic mirror and a 535 nm/525 nm band pass filter (Omega Optical). Background fluorescence, determined from three cell-free regions of the coverslips, was subtracted from all the signals prior to calculating the ratios. The baseline ratio corresponded to the last ratio before the first stimulus (usually glutamate; see the arrows in Fig. 1A-D). The areas under curve (AUCs) were calculated from baseline-subtracted magfura-2 ratios during the first 5 min of a given stimulus as described (see Fig. 1F and G).
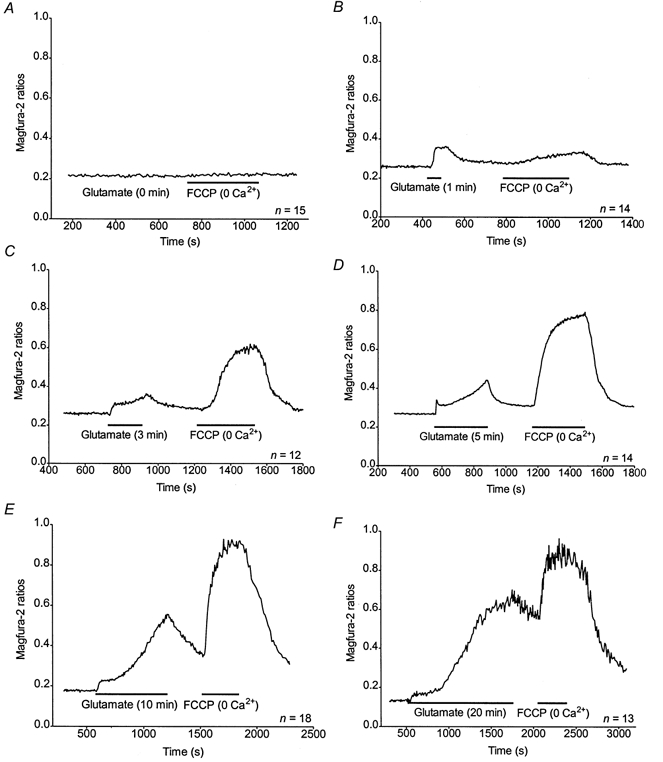
Figure 1. Evaluation of [Ca2+]c and mitochondrial Ca2+ accumulation during and following a glutamate stimulus.
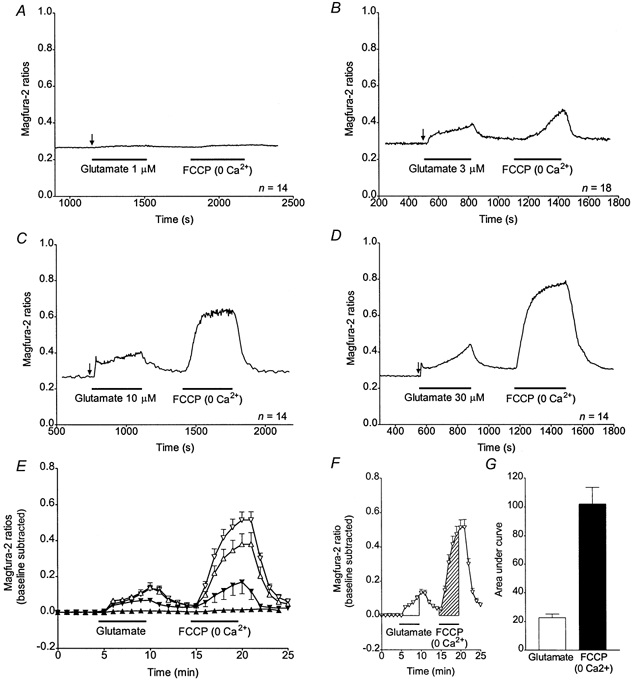
A-D, representative traces obtained from n neurones treated with 1 (A), 3 (B), 10 (C) or 30 μm (D) glutamate and with FCCP as indicated. The arrows point to the ratio taken as the baseline. The FCCP applications were performed in the absence of Ca2+ in the buffer. E, means ±s.e.m. of the magfura-2 ratios (baseline subtracted) obtained from n coverslips for each glutamate treatment: 1 μm glutamate (▴; n = 5), 3 μm glutamate (▾; n = 10), 10 μm glutamate (▵; n = 10), 30 μm glutamate (▿; n = 15). F, mean ±s.e.m. of the magfura-2 ratios (baseline subtracted) obtained from 15 coverslips with 30 μm glutamate (▿; n = 15) and areas under the curve (AUCs) used as a measure of the [Ca2+]i changes after the glutamate stimulation (open area) and the FCCP application (hatched area). G, means ±s.e.m. for AUCs as described in F, for the 30 μm glutamate stimulus (□) and the FCCP treatment (▪).
Statistics
Student's unpaired t test and one-way analysis of variance (ANOVA) coupled with Bonferroni's multicomparison post hoc test were performed using Prism 3.0 software (GraphPad Software Inc., San Diego, CA, USA).
RESULTS
Ca2+ uptake and Ca2+ release in neuronal cells
We have previously shown that the Ca2+ that enters cells during glutamate application is largely due to NMDA receptor activation, and that a substantial fraction of the Ca2+ load is buffered by mitochondria (White & Reynolds, 1997). In this study, we used the low affinity Ca2+ indicator magfura-2 to estimate [Ca2+]c (Raju et al. 1989; Stout & Reynolds, 1999). We ruled out the possibility that magfura-2 was measuring large cytoplasmic [Mg2+] changes, because Calcium Green-5N, a low affinity Ca2+ dye that is insensitive to Mg2+ (Rajdev & Reynolds, 1993) produced qualitatively similar results in the protocol described below (J. B. Brocard & I. J. Reynolds, unpublished observations). Magfura-2 is almost exclusively found in the cytoplasm of neurones under the loading conditions used here because all of the dye could be released (as indicated by a decrease of cell-associated fluorescence) by a low concentration of digitonin (< 5 μm) that selectively removed the plasma membrane (Ishijima et al. 1991). Magfura-2 loaded into the cells could be quenched by the addition of Mn2+, in a depolarizing solution to the outside of the cell; dye released from neurones by 5 μm digitonin displayed a peak excitation wavelength of 340 nm when incubated with saturating Ca2+ concentrations and could also be completely quenched by Mn2+, which does not bind to the uncleaved magfura-2 AM (Brocard et al. 1993). To evaluate [Ca2+]m following glutamate stimulation we used the protonophore FCCP, which rapidly and reversibly causes the mitochondrial membrane potential to collapse. This results in the release of Ca2+ from the mitochondria, probably by the reversed operation of the Ca2+ uniporter (Budd & Nicholls, 1996a). Thus, assessing [Ca2+]c during an FCCP application in the absence of Ca2+ in the external buffer corresponds to measuring [Ca2+]m.
Concentration-dependent increase of [ca2+]m
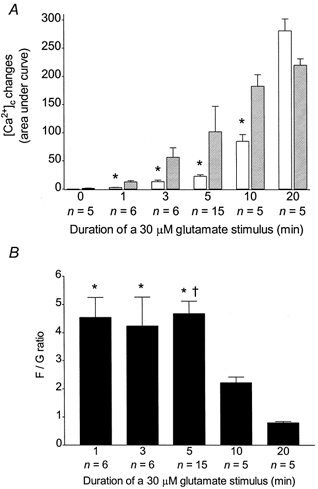
Representative curves of magfura-2 ratios (background subtracted) obtained for 1, 3, 10 and 30 μm glutamate are shown in Fig. 1A-D. The arrows indicate the ratio taken as the baseline for further studies. They show a concentration-dependent increase of [Ca2+]c with both glutamate and FCCP. These curves represent the means from 8-25 neurones on a single coverslip, and the mean response is considered to be a single experiment. The mean magfura-2 ratios obtained from 5-15 experiments with each concentration of glutamate were baseline subtracted and plotted in Fig. 1E. Due to the variability in the characteristics of the Ca2+ responses in single cells (as exemplified in Fig. 2A and B), we calculated the area under the curve (AUC), defined as the sum of the baseline-subtracted ratios for the duration of the treatment (Fig. 1F), as a measure of the overall [Ca2+]i changes occurring during a specific treatment (Fig. 1G). Mean AUCs ±s.e.m. for glutamate-induced and FCCP-induced Ca2+ responses are shown in Fig. 3A. At all concentrations, the FCCP-induced Ca2+ release is greater than that observed during the glutamate treatment. Thus, most of the Ca2+ entering the neurones is not measured by the fluorescent dye during the glutamate treatment (Thayer & Miller, 1990). The ratio of the FCCP-induced to the glutamate-induced [Ca2+]c changes (F/G ratio) is also concentration dependent and increases with the concentration of glutamate used during the stimulus (Fig. 3B). However, the increase in the rate of Ca2+ uptake seems to reach a maximum at high concentrations of glutamate. Taken together, these data indicate that the higher the glutamate concentration, the more Ca2+ is taken up by the mitochondria until the limit of their capacity is reached.
Figure 2. Variability in single-cell responses during and following a glutamate stimulus.
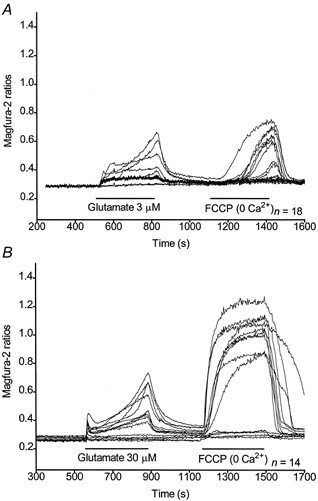
Traces for single cells treated with 3 μm (A) or 30 μm (B) glutamate corresponding to Fig. 1B and D, respectively.
Figure 3. Dose-dependent increase of [Ca2+]c and [Ca2+]m during and following a glutamate stimulus.
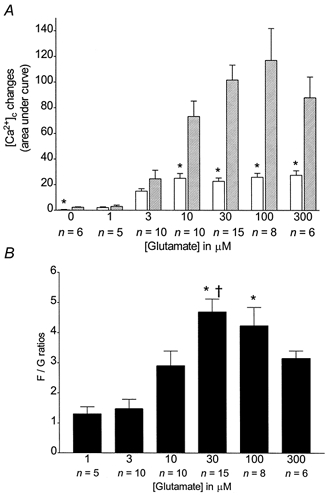
A, n coverslips were treated as indicated in Fig. 1 and means ±s.e.m. for AUCs after the glutamate (open bars) and FCCP treatments (hatched bars) were plotted. * Significant differences from the corresponding FCCP treatment, Student's unpaired t test; P < 0.05.B, means ±s.e.m. of normalized ratios of FCCP-induced to glutamate-induced [Ca2+]c changes. * Significant difference from the 1 μm and 3 μm glutamate treatments, ANOVA followed by Bonferroni's test; P < 0.05. † Significant differences from the 10 μm glutamate treatment, ANOVA followed by Bonferroni's test; P < 0.05.
Overall cellular ca2+ uptake during a glutamate stimulus
By inactivating the predominant Ca2+ buffering mechanism with FCCP during glutamate stimulations, it is possible to evaluate the overall quantity of Ca2+ being taken up by the neurones (Stout et al. 1998). Representative curves of magfura-2 ratios (background subtracted) obtained for glutamate (0, 1, 3, 30 and 300 μm) + FCCP are shown in Fig. 4A-E. AUCs obtained for those treatments are shown in Fig. 4F. Although the concentration at which glutamate started to produce a sizeable response was similar in the absence or presence of FCCP, there appeared to be an all-or-none characteristic to the concentration-response relationship for glutamate in the presence of FCCP. However, at most concentrations, the AUCs shown in Fig. 4F appear to reflect the sum of the glutamate-induced transient and the subsequent FCCP-induced release (with the notable exception of the measurements made with 3 μm glutamate) suggesting that this approach does provide a reasonable estimate of the total Ca2+ load during glutamate exposure.
Figure 4. Evaluation of [Ca2+]c and [Ca2+]m during a simultaneous glutamate + FCCP stimulus.
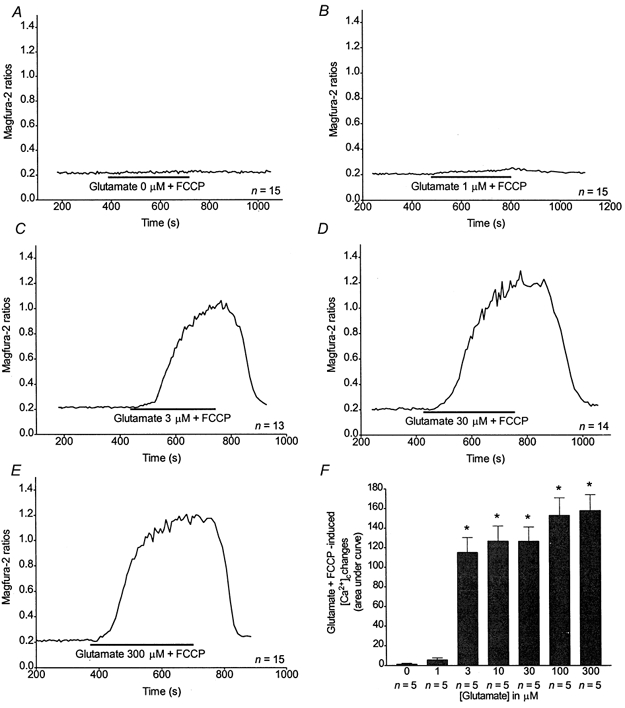
A-E, representative traces obtained from n neurones treated with 0 (A), 1 (B), 3 (C), 30 (D) or 300 μm glutamate (E) + FCCP as indicated. F, n coverslips were treated as indicated above and means ±s.e.m. for AUCs after the glutamate + FCCP treatments were plotted. * Significant differences from 0 and 1 μm glutamate treatments, ANOVA followed by Bonferroni's test; P < 0.05.
Duration-dependent increase of [ca2+]m after a glutamate stimulus
We next sought to determine the time dependence of the mitochondrial Ca2+ accumulation in the neurones. Representative curves of magfura-2 ratios (background subtracted) obtained for 0, 1, 3, 5, 10 and 20 min of 30 μm glutamate stimulation are shown in Fig. 5A-F. AUCs obtained for the FCCP treatment correspond to significantly bigger [Ca2+]i changes than that measured in the cytoplasm during any glutamate stimulus shorter than 10 min (Fig. 6A). However, after 20 min of 30 μm glutamate activation, the AUC obtained after the FCCP treatment is significantly smaller than the [Ca2+]i change measured during the stimulus (Fig. 6A). Thus, the F/G ratio is stable for 1-5 min of glutamate treatment, then drops for 10 and 20 min to a value significantly smaller than that observed for 1, 3 or 5 min (Fig. 6B).
Figure 5. Evaluation of [Ca2+]c and mitochondrial Ca2+ accumulation during and following a glutamate stimulus.
A-F, representative traces obtained from n neurones treated with 30 μm glutamate for 0 (A), 1 (B), 3 (C), 5 (D), 10 (E) or 20 min (F) and FCCP as indicated. The FCCP applications were performed in the absence of Ca2+ in the buffer. Neurones treated for 0 min were subjected to the same experimental procedure but not to the glutamate stimulus.
Figure 6. Duration-dependent increase of [Ca2+]c and [Ca2+]m during and following a glutamate stimulus.
A, n coverslips were treated as indicated in Fig. 5 and means ±s.e.m. for AUCs after the glutamate (open bars) and the FCCP treatments (hatched bars) were plotted. * Significant differences from the corresponding FCCP treatment, Student's unpaired t tests; P < 0.05.B, means ±s.e.m. of normalized ratios of FCCP-induced to glutamate-induced cytoplasmic Ca2+ changes. * Significant differences from the 20 min glutamate treatment, ANOVA followed by Bonferroni's test; P < 0.05.† Significant differences from the 10 min glutamate treatment, ANOVA followed by Bonferroni's test; P < 0.05.
Recovery-dependent decrease of [ca2+]m
We also estimated the rate of Ca2+ extrusion from the mitochondria by varying the duration of the washout following a 30 μm glutamate stimulus. Representative curves of magfura-2 ratios (background subtracted) obtained for 0, 5, 10 and 20 min after exposure to glutamate when the cells were washed in the absence of external Ca2+ are shown in Fig. 7A-D. As a comparison, the response obtained when using FCCP in previously unstimulated cells is shown in Fig. 7E. AUCs obtained for the FCCP treatment 0–5 min after glutamate correspond to higher [Ca2+]m than 10 or 20 min after the stimulus or in previously unstimulated cells (Fig. 7F). The absence of Ca2+ in the medium during glutamate washout did not significantly alter Ca2+ extrusion from the neurones. However, after a [Ca2+]m decrease of threefold within the first 10 min of Ca2+-free buffer washout, it stays stable over the next 10 min period. Thus, [Ca2+]m is still higher after 20 min of washout compared to previously unstimulated cells (Fig. 7F).
Figure 7. Recovery-dependent decrease of [Ca2+]m following a glutamate stimulus.
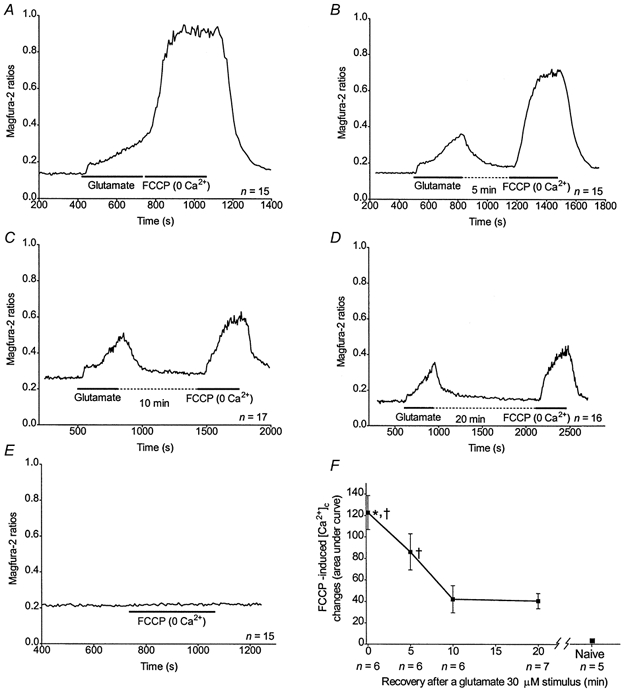
A-D, representative traces obtained from n neurones treated with 30 μm glutamate, rinsed for 0 (A), 5 (B), 10 (C) or 20 min (D) in Ca2+-free buffer and treated with FCCP as indicated. E, n previously unstimulated cells were treated with FCCP only, as indicated. The FCCP applications were performed in the absence of Ca2+ in the buffer. F, n coverslips were treated as indicated above and means ±s.e.m. for AUCs obtained after the glutamate and FCCP treatments were plotted. * Significant differences from 10 and 20 min recovery, ANOVA followed by Bonferroni's test; P < 0.05.† Significant differences from previously unstimulated cells, ANOVA followed by Bonferroni's test; P < 0.05.
Stimulus-dependent increase of [ca2+]m
Previous studies have suggested that the magnitude of [Ca2+]m increase depends on the route of Ca2+ entry per se (Sattler et al. 1998), whereas others showed that only NMDA receptor activation would lead to large [Ca2+]c followed by high [Ca2+]m increases (Hyrc et al. 1997; Stout & Reynolds, 1999; Keelan et al. 1999). Moreover, as magfura-2 is sensitive to physiological [ Mg2+]i (Raju et al. 1989), it was important to determine whether there were dye changes in the absence of Ca2+ in the buffer. We investigated these principles further by exposing neurones to other stimuli that elevate Ca2+ to a varying extent (Stout & Reynolds, 1999). Representative curves of magfura-2 ratios (background subtracted) obtained for 30 μm glutamate in Ca2+-free buffer, high KCl buffer, 100 μm kainate and 300 μm NMDA are shown in Fig. 8. AUCs obtained using glutamate in Ca2+-free buffer, high KCl or kainate correspond to significantly smaller Ca2+ fluxes than the [Ca2+]c change obtained with 30 μm glutamate (Fig. 9A). Similarly, Ca2+ responses with FCCP following those stimuli are significantly smaller than the response obtained with FCCP after a 30 μm glutamate stimulation (Fig. 9B). Interestingly, though, the magnitude of the [Ca2+]c changes following glutamate stimulation in Ca2+-free buffer and kainate is significantly higher than the [Ca2+]c change observed in previously unstimulated cells (see Fig. 7F, and J. B. Brocard & I. J. Reynolds, unpublished observations).
Figure 8. Evaluation of [Ca2+]c and mitochondrial Ca2+ accumulation during and following various stimuli.
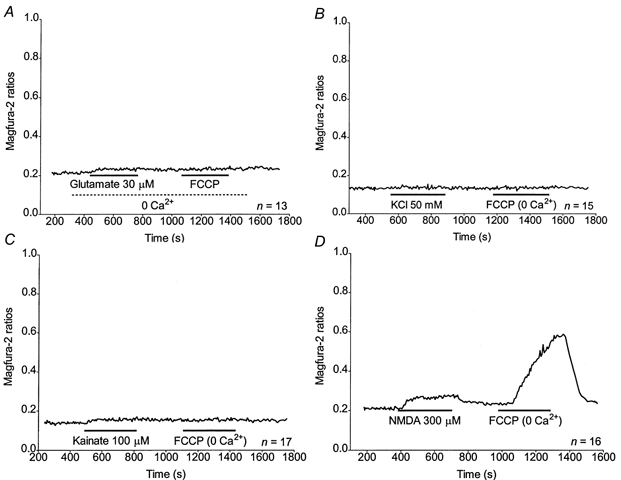
A-D, representative traces obtained from n neurones treated with 30 μm glutamate in Ca2+-free buffer (A), 50 mm KCl (B), 100 μm kainate (C) or 300 μm NMDA (D) and FCCP as indicated. The FCCP applications were performed in the absence of Ca2+ in the buffer.
Figure 9. Stimulus-dependent increase of [Ca2+]c and [Ca2+]m.
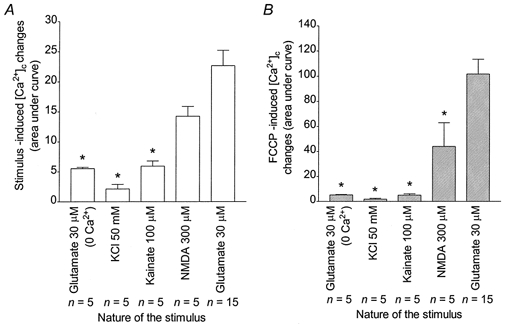
n coverslips were treated as indicated in Fig. 8 and means ±s.e.m. for AUCs obtained after the stimuli (A) and the FCCP (B) treatments were plotted. * Significant differences from the 30 μm glutamate treatment, ANOVA followed by Bonferroni's test; P < 0.05.
DISCUSSION
The goal of these experiments was to develop a method of measuring the mitochondrial Ca2+ accumulation during and after glutamate stimulation in cortical neurones. The protonophore FCCP was used to release Ca2+ from mitochondria, and the Ca2+ elevation was detected in the cytoplasm using the low affinity Ca2+ indicator magfura-2. Our results demonstrate the value of this approach, as we show that mitochondrial Ca2+ accumulation is dependent on the glutamate concentration, the time of exposure to glutamate and the duration of the washout following the glutamate stimulus. The only exception seems to be the Ca2+ increases measured during combined FCCP and glutamate applications (Fig. 4). This result may be explained by the inhibition of the NMDA receptor through high [Ca2+]c, thereby underestimating the overall Ca2+ entry at high glutamate concentrations (Rosenmund et al. 1995). However, the most notable observation is the size of the [Ca2+]m pool. The Ca2+ changes detected by magfura-2 approached the maximal ratios we have obtained with this dye, suggesting that the dye is close to being saturated with Ca2+. Given that the Kd of the dye for Ca2+ is ∼10–20 μm (Raju et al. 1989; Stout & Reynolds, 1999), this suggests that [Ca2+]c following FCCP-induced release may significantly exceed 100 μm. When one considers that the usual estimate of the fractional volume of the cytoplasm occupied by mitochondria is < 5 % (Scott & Nicholls, 1980) this implies that [Ca2+]m following exposure to glutamate approaches several millimolar.
This study reveals some interesting characteristics of the relationship between [Ca2+]c and [Ca2+]m after NMDA receptor activation. The threshold glutamate concentration for producing [Ca2+]m increase in this study was approximately 1 μm, and this led to similar small increases in magfura-2 fluorescence during the stimulus and FCCP application. Higher glutamate concentrations produced an elevation in [Ca2+]c that exceeds the set point with the result that there is a progressive accumulation of Ca2+ in the matrix (Nicholls, 1978). There was a clear relationship between the magnitude of the [Ca2+]c response to glutamate (between 1 and 100 μm) and the subsequent FCCP-induced Ca2+ release from the mitochondrial Ca2+ stores following a 5 min glutamate exposure. This suggests that the approach provides a reasonable, semi-quantitative estimate of [Ca2+]m under these conditions. A similar relationship was observed when the time of glutamate exposure was varied between 1 and 5 min, again suggesting that the method can report mitochondrial Ca2+ accumulation under the conditions of these experiments. It is worth noting, though, that the relationship between [Ca2+]m and [Ca2+]c is not linear under these circumstances, as revealed by the variation in the F/G ratio obtained with increasing concentrations of glutamate (Fig. 3B). This non-linear relationship could be due to the inherent properties of the low-affinity dye magfura-2 itself, as described elsewhere (Hyrc et al. 2000), or alternatively it could be a consequence of the activation of the mitochondrial Ca2+ uniporter by high [Ca2+]c, as reported previously (Colegrove et al. 2000). Furthermore, mitochondrial Ca2+ buffering capacity is limited as becomes evident when stimulating cells with concentrations of glutamate greater than 100 μm or for periods of time beyond 5 min. With these more extreme stimulation protocols we observed that the F/G ratio decreased, reflecting a limitation in the accumulation of Ca2+ by mitochondria. This could reflect a saturation phenomenon, where the limit of the ability of mitochondria to accumulate Ca2+ is reached. Alternatively, the limitation could reflect the dissipation of the gradient that drives Ca2+ into the mitochondria (ΔΨm; Zoccarato & Nicholls, 1982), the glutamate-induced Ca2+-dependent decrease of ΔΨm being a well-characterized property of neuronal mitochondria (Khodorov et al. 1996; Schinder et al. 1996; White & Reynolds, 1996; Vergun et al. 1999). It is also possible that the later failure of Ca2+ accumulation and/or release of matrix Ca2+ in these long exposures reflects activation of permeability transition (Hunter & Haworth, 1979; Al Nasser & Crompton, 1986). However, recent studies argued against the induction of transition in a similar experiment (Castilho et al. 1998; Hüser et al. 1998). Interestingly, [Ca2+]c always stayed high for the whole duration of the FCCP treatment, probably reflecting a continuous release of Ca2+ from the mitochondria and/or a slow rate of Ca2+ extrusion from the cytoplasm. Given that the subsequent decline in [Ca2+]c appeared to be the consequence of FCCP removal, this observation suggests that the FCCP treatment was not of sufficient duration to empty the mitochondria of calcium. It is not clear whether this is due to the relatively slow mobilization of intramitochondrial calcium, or whether the efflux pathway is rate limiting in this process.
For smaller concentrations of glutamate (1 μm) and non-NMDA stimulation, the stimulus- and FCCP-induced increases in magfura-2 fluorescence are not necessarily related to mitochondrial Ca2+ accumulation. We first confirmed that the initial [Ca2+]m in previously unstimulated cells is very small by monitoring magfura-2 fluoresence increase during an FCCP application to untreated cells (see Fig. 7E). This content was estimated to be << 1 μm (J. B. Brocard & I. J. Reynolds, unpublished observations) when using fura-2, a fluorescent dye more sensitive to Ca2+ (Grynkiewicz et al. 1985; Stout & Reynolds, 1999). The magfura-2 fluorescence increases obtained when using 0 μm glutamate (+1 μm glycine; see Methods) followed by FCCP were identical to those observed in previously unstimulated cells, thus confirming the absence of any intrinsic ability of glycine to activate the NMDA receptor (Johnson & Ascher, 1987).
The use of 1 μm glutamate led to similar small increases in magfura-2 fluorescence during the stimulus and FCCP application. If there is any Ca2+ entry, it does not lead to [Ca2+]c changes large enough to trigger the process of mitochondrial buffering (Nicholls, 1978; see above). Identical results were obtained when using depolarization as a stimulus. In contrast, increases in magfura-2 fluorescence observed during a 30 μm glutamate stimulus followed by an FCCP application, all in Ca2+-free buffer, are unlikely to be due to Ca2+ variations. However, we previously demonstrated that glutamate can stimulate the influx of Mg2+ in Ca2+-free buffer, and this may be the source of magfura-2 fluorescence changes in the absence of Ca2+ (Brocard et al. 1993; Stout et al. 1996). Interestingly, the AUC obtained during FCCP application in this experiment is higher than that obtained when the drug was applied to previously unstimulated cells. Therefore, this signal could be due to either Mg2+ initially taken up, then extruded by the mitochondria, or Mg2+ released from ATP during the FCCP application (Leyssens et al. 1996). Interestingly, similar observations were made with kainate stimuli (in the presence of Ca2+ in the buffer); in this case, it is difficult to decide between a Ca2+- or a Mg2+-specific increase or both.
Several previous studies have described the determination of [Ca2+]m in neurones. Perhaps the most direct approach involves electron microprobe X-ray analysis to determine the mitochondrial ion content (Pivovarova et al. 1999; Taylor et al. 1999). However, as of yet it has not proved possible to apply this method to monolayer cultures of neurones, and it is also rather more difficult to establish time courses with this technique. Others have reported the use of fluorescent indicators that report Ca2+ and preferentially accumulate in mitochondria. The major limitation in this approach would appear to be the problem of dye saturation. For example, rhod-2 has an affinity for Ca2+ of ∼0.5 μm, and can selectively accumulate in mitochondria because the acetoxymethyl ester is a partially charged cation (Peng & Greenamyre, 1998; Peng et al. 1998). However, as noted above, the estimate of [Ca2+]m suggests that millimolar concentrations might be expected, which is far beyond the levels that these dyes can measure accurately. Alternatively, it is also possible that a substantial majority of the Ca2+ that enters mitochondria is not actually free in solution, and is instead precipitated as calcium phosphate or sequestered in some other form in the matrix (Lehninger, 1974; Zoccarato & Nicholls, 1982). Thus, the actual [Ca2+]m may still be in the low micromolar range.
We have not directly investigated the efflux mechanisms triggered by FCCP. It has previously been reported that the dissipation of ΔΨm results in the reverse operation of the Ca2+ uniporter in isolated mitochondria (Budd & Nicholls, 1996a). Other potential efflux mechanisms are the mitochondrial Na+-Ca2+ exchanger (White & Reynolds, 1995 and references therein) and the activation of permeability transition (for review see Duchen, 1999; Nicholls & Budd, 2000). As already noted, it is likely that some fraction of the Ca2+ that accumulates in mitochondria is taken out of solution in the form of calcium phosphate or some other insoluble form in the matrix (Lehninger, 1974; Zoccarato & Nicholls, 1982). It is difficult to establish the extent to which this alters the characteristics of the efflux that we observed. We might tentatively infer, based on the experiments shown in Fig. 7, that there are two pools of releasable Ca2+. The first and larger pool leaves the mitochondria within 10 min, while the second pool remains stable prior to the addition of FCCP. One might speculate that these pools represent soluble and insoluble forms of Ca2+ in the mitochondrion, recognizing that there is as yet, little direct evidence to support this supposition. Alternatively, the activation of the Ca2+ efflux routes may be less sensitive to [Ca2+]m than entry routes are to [Ca2+]c. In any case, whatever the form of Ca2+ that these pools represent, both must be mobilized by the effects of FCCP, either as the result of the alteration of membrane potential or by the change in the matrix pH.
Acknowledgments
We gratefully thank G. J. Kress for excellent technical help and Dr J. F. Buckman for critically reading this manuscript. J.B.B. was supported by a long term fellowship from the European Molecular Biology Organization (ALTF-743-1998). This study was also supported by NIH grant NS34138.
References
- Al Nasser I, Crompton M. The reversible Ca2+-induced permeabilization of rat liver mitochondria. Biochemical Journal. 1986;239:19–29. doi: 10.1042/bj2390019. [DOI] [PMC free article] [PubMed] [Google Scholar]
- Brocard JB, Rajdev S, Reynolds IJ. Glutamate-induced increases in intracellular free Mg2+ in cultured cortical neurons. Neuron. 1993;11:751–757. doi: 10.1016/0896-6273(93)90084-5. [DOI] [PubMed] [Google Scholar]
- Budd SL, Nicholls DG. A reevaluation of the role of mitochondria in neuronal Ca2+ homeostasis. Journal of Neurochemistry. 1996a;66:403–411. doi: 10.1046/j.1471-4159.1996.66010403.x. [DOI] [PubMed] [Google Scholar]
- Budd SL, Nicholls DG. Mitochondria, calcium regulation, and acute glutamate excitotoxicity in cultured cerebellar granule cells. Journal of Neurochemistry. 1996b;67:2282–2291. doi: 10.1046/j.1471-4159.1996.67062282.x. [DOI] [PubMed] [Google Scholar]
- Castilho RF, Hansson O, Ward WM, Budd SL, Nicholls DG. Mitochondrial control of acute glutamate excitotoxicity in cultured cerebellar granule cells. Journal of Neuroscience. 1998;18:10277–10286. doi: 10.1523/JNEUROSCI.18-24-10277.1998. [DOI] [PMC free article] [PubMed] [Google Scholar]
- Choi DW. Ionic dependence of glutamate neurotoxicity. Journal of Neuroscience. 1987;7:369–379. doi: 10.1523/JNEUROSCI.07-02-00369.1987. [DOI] [PMC free article] [PubMed] [Google Scholar]
- Choi DW, Maulucci-Gede M, Kriegstein AR. Glutamate neurotoxicity in cortical cell culture. Journal of Neuroscience. 1987;7:357–368. doi: 10.1523/JNEUROSCI.07-02-00357.1987. [DOI] [PMC free article] [PubMed] [Google Scholar]
- Colegrove SL, Albrecht MA, Friel DD. Dissection of mitochondrial Ca2+ uptake and release fluxes in situ after depolarization-evoked [Ca2+]i elevations in sympathetic neurons. Journal of General Physiology. 2000;115:351–370. doi: 10.1085/jgp.115.3.351. [DOI] [PMC free article] [PubMed] [Google Scholar]
- Dessi F, Ben-Ari Y, Charriaut-Marlangue C. Ruthenium red protects against glutamate-induced neuronal death in cerebellar culture. Neuroscience Letters. 1995;201:53–56. doi: 10.1016/0304-3940(95)12128-q. [DOI] [PubMed] [Google Scholar]
- Duchen MR. Effects of metabolic inhibition on the membrane properties of isolated mouse primary sensory neurones. Journal of Physiology. 1990;424:387–409. doi: 10.1113/jphysiol.1990.sp018073. [DOI] [PMC free article] [PubMed] [Google Scholar]
- Duchen MR. Contributions of mitochondria to animal physiology: from homeostatic sensor to calcium signalling and cell death. Journal of Physiology. 1999;516:1–17. doi: 10.1111/j.1469-7793.1999.001aa.x. [DOI] [PMC free article] [PubMed] [Google Scholar]
- Grynkiewicz G, Poenie M, Tsien RY. A new generation of Ca2+ indicators with greatly improved fluorescence properties. Journal of Biological Chemistry. 1985;260:3440–3450. [PubMed] [Google Scholar]
- Hartley DM, Kurth MC, Bjerkness L, Weiss JH, Choi DW. Glutamate receptor-induced 45Ca2+ accumulation in cortical cell culture correlated with subsequent neuronal degeneration. Journal of Neuroscience. 1993;13:1993–2000. doi: 10.1523/JNEUROSCI.13-05-01993.1993. [DOI] [PMC free article] [PubMed] [Google Scholar]
- Headley PM, Grillner S. Excitatory amino acids and synaptic transmission: evidence for a physiological function. Trends in Pharmacological Sciences-A special report. 1990;1991:30–36. doi: 10.1016/0165-6147(90)90116-p. [DOI] [PubMed] [Google Scholar]
- Hunter DR, Haworth RA. The Ca2+-induced membrane transition in mitochondria. I. The protective mechanisms. Archives in Biochemistry and Biophysics. 1979;195:453–459. doi: 10.1016/0003-9861(79)90371-0. [DOI] [PubMed] [Google Scholar]
- Hüser J, Rechenmacher CE, Blatter LA. Imaging the permeability pore transition in single mitochondria. Biophysical Journal. 1998;74:2129–2137. doi: 10.1016/S0006-3495(98)77920-2. [DOI] [PMC free article] [PubMed] [Google Scholar]
- Hyrc K, Handran SD, Rothman SM, Goldberg MP. Ionized intracellular calcium concentration predicts excitotoxic neuronal death: observations with low-affinity fluorescent calcium indicators. Journal of Neuroscience. 1997;17:6669–6677. doi: 10.1523/JNEUROSCI.17-17-06669.1997. [DOI] [PMC free article] [PubMed] [Google Scholar]
- Hyrc KL, Bownik JM, Goldberg MP. Ionic selectivity of low-affinity ratiometric calcium indicators: mag-Fura-2, Fura-2FF and BTC. Cell Calcium. 2000;27:75–86. doi: 10.1054/ceca.1999.0092. [DOI] [PubMed] [Google Scholar]
- Ishijima S, Sonoda T, Tatibana M. Mitogen-induced early increase in cytosolic free Mg2+ concentrations in single Swiss 3T3 fibroblasts. American Journal of Physiology. 1991;261:C1074–1080. doi: 10.1152/ajpcell.1991.261.6.C1074. [DOI] [PubMed] [Google Scholar]
- Johnson JW, Ascher P. Glycine potentiates the NMDA response in cultured mouse brain neurons. Nature. 1987;325:529–531. doi: 10.1038/325529a0. [DOI] [PubMed] [Google Scholar]
- Keelan J, Vergun O, Duchen MR. Excitotoxic mitochondrial depolarisation requires both calcium and nitric oxide in rat hippocampal neurons. Journal of Physiology. 1999;520:797–813. doi: 10.1111/j.1469-7793.1999.00797.x. [DOI] [PMC free article] [PubMed] [Google Scholar]
- Khodorov B, Pinelis V, Vergun O, Storozhevykh T, Vinskaya N. Mitochondrial deenergization underlies neuronal calcium overload following a prolonged glutamate challenge. FEBS Letters. 1996;397:230–234. doi: 10.1016/s0014-5793(96)01139-8. [DOI] [PubMed] [Google Scholar]
- Kiedrowski L, Costa E. Glutamate-induced destabilization of intracellular calcium concentration homeostasis in cultured cerebellar granule cells: role of mitochondria in calcium buffering. Molecular Pharmacology. 1995;47:140–147. [PubMed] [Google Scholar]
- Lehninger AL. Role of phosphate and other proton-donating anions in respiration-coupled transport of Ca2+ by mitochondria. Proceedings of the National Academy of Sciences of the USA. 1974;71:1520–1524. doi: 10.1073/pnas.71.4.1520. [DOI] [PMC free article] [PubMed] [Google Scholar]
- Leyssens A, Nowicky AV, Patterson L, Crompton M, Duchen MR. The relationship between mitochondrial state, ATP hydrolysis, [Mg2+]i and [Ca2+]i studied in isolated rat cardiomyocytes. Journal of Physiology. 1996;496:111–128. doi: 10.1113/jphysiol.1996.sp021669. [DOI] [PMC free article] [PubMed] [Google Scholar]
- Manev H, Favaron M, Guidotti A, Costa E. Delayed increase of Ca2+ influx elicited by glutamate: role in neuronal death. Molecular Pharmacology. 1989;36:106–112. [PubMed] [Google Scholar]
- Nicholls DG. The regulation of extra-mitochondrial free Ca2+ by rat liver mitochondria. Biochemical Journal. 1978;176:463–474. doi: 10.1042/bj1760463. [DOI] [PMC free article] [PubMed] [Google Scholar]
- Nicholls DG, Åkerman KEO. Mitochondrial calcium transport. Biochimica et Biophysica Acta. 1982;683:57–88. doi: 10.1016/0304-4173(82)90013-1. [DOI] [PubMed] [Google Scholar]
- Nicholls DG, Budd SL. Mitochondria and neuronal survival. Physiological Reviews. 2000;80:315–360. doi: 10.1152/physrev.2000.80.1.315. [DOI] [PubMed] [Google Scholar]
- Peng TI, Greenamyre JT. Privileged access to mitochondria of calcium influx through N-methyl-D-aspartate receptors. Molecular Pharmacology. 1998;53:974–980. [PubMed] [Google Scholar]
- Peng TI, Jou MJ, Sheu SS, Greenamyre JT. Visualization of NMDA receptor-induced mitochondrial calcium accumulation in striatal neurons. Experimental Neurology. 1998;149:1–12. doi: 10.1006/exnr.1997.6599. [DOI] [PubMed] [Google Scholar]
- Pivovarova NB, Hongpaisan J, Andrews SB, Friel DD. Depolarization-induced mitochondrial Ca2+ accumulation in sympathetic neurons: spatial and temporal characteristics. Journal of Neuroscience. 1999;19:6372–6384. doi: 10.1523/JNEUROSCI.19-15-06372.1999. [DOI] [PMC free article] [PubMed] [Google Scholar]
- Rajdev S, Reynolds IJ. Calcium green-5N, a novel fluorescent probe for monitoring high intracellular free Ca2+ concentrations associated with glutamate excitotoxicity in cultured rat brain neurons. Neuroscience Letters. 1993;162:149–152. doi: 10.1016/0304-3940(93)90582-6. [DOI] [PubMed] [Google Scholar]
- Raju B, Murphy E, Levy LA, Hall RD, London RE. A fluorescent indicator for measuring cytosolic free magnesium. American Journal of Physiology. 1989;256:C540–548. doi: 10.1152/ajpcell.1989.256.3.C540. [DOI] [PubMed] [Google Scholar]
- Randall RD, Thayer SA. Glutamate-induced calcium transient triggers delayed calcium overload and neurotoxicity in rat hippocampal neurons. Journal of Neuroscience. 1992;12:1882–1895. doi: 10.1523/JNEUROSCI.12-05-01882.1992. [DOI] [PMC free article] [PubMed] [Google Scholar]
- Rosenmund C, Feltz A, Westbrook GL. Calcium-dependent inactivation of synaptic NMDA receptors in hippocampal neurons. Journal of Neurophysiology. 1995;73:427–430. doi: 10.1152/jn.1995.73.1.427. [DOI] [PubMed] [Google Scholar]
- Rothman SM, Olney JW. Glutamate and the pathophysiology of hypoxic-ischaemic brain damage. Annals of Neurology. 1986;19:105–111. doi: 10.1002/ana.410190202. [DOI] [PubMed] [Google Scholar]
- Sattler R, Charlton MP, Hafner M, Tymianski M. Distinct influx pathways, not calcium load, determine neuronal vulnerability to calcium neurotoxicity. Journal of Neurochemistry. 1998;71:2349–2364. doi: 10.1046/j.1471-4159.1998.71062349.x. [DOI] [PubMed] [Google Scholar]
- Schinder AF, Olson EC, Spitzer NC, Montal M. Mitochondrial dysfunction is a primary event in glutamate excitotoxicity. Journal of Neuroscience. 1996;16:6125–6133. doi: 10.1523/JNEUROSCI.16-19-06125.1996. [DOI] [PMC free article] [PubMed] [Google Scholar]
- Scott ID, Nicholls DG. Energy transduction in intact synaptosomes. Influence of plasma-membrane depolarization on the respiration and membrane potential of internal mitochondria determined in situ. Biochemical Journal. 1980;186:21–33. doi: 10.1042/bj1860021. [DOI] [PMC free article] [PubMed] [Google Scholar]
- Stout AK, Li-Smerin Y, Johnson JW, Reynolds IJ. Mechanisms of glutamate-stimulated Mg2+ influx and subsequent Mg2+ efflux in rat forebrain neurones in culture. Journal of Physiology. 1996;492:641–657. doi: 10.1113/jphysiol.1996.sp021334. [DOI] [PMC free article] [PubMed] [Google Scholar]
- Stout AK, Raphael HM, Kanterewicz BI, Klann E, Reynolds IJ. Glutamate-induced neuron death requires mitochondrial calcium uptake. Nature Neuroscience. 1998;1:366–373. doi: 10.1038/1577. [DOI] [PubMed] [Google Scholar]
- Stout AK, Reynolds IJ. High-affinity calcium indicators underestimate increases in intracellular calcium concentrations associated with excitotoxic glutamate stimulations. Neuroscience. 1999;89:91–100. doi: 10.1016/s0306-4522(98)00441-2. [DOI] [PubMed] [Google Scholar]
- Taylor CP, Weber ML, Gaughan CL, Lehning EJ, Lopachin RM. Oxygen/glucose deprivation in hippocampal slices: altered intraneuronal elemental composition predicts structural and functional damage. Journal of Neuroscience. 1999;19:619–629. doi: 10.1523/JNEUROSCI.19-02-00619.1999. [DOI] [PMC free article] [PubMed] [Google Scholar]
- Thayer SA, Miller RJ. Regulation of the intracellular free calcium concentration in single rat dorsal root ganglion neurones in vitro. Journal of Physiology. 1990;425:85–115. doi: 10.1113/jphysiol.1990.sp018094. [DOI] [PMC free article] [PubMed] [Google Scholar]
- Vergun O, Keelan J, Khodorov BI, Duchen MR. Glutamate-induced mitochondrial depolarisation and perturbation of calcium homeostasis in cultured rat hippocampal neurones. Journal of Physiology. 1999;519:451–466. doi: 10.1111/j.1469-7793.1999.0451m.x. [DOI] [PMC free article] [PubMed] [Google Scholar]
- White RJ, Reynolds IJ. Mitochondria and Na+/Ca2+ exchange buffer glutamate-induced calcium loads in cultured cortical neurons. Journal of Neuroscience. 1995;15:1318–1328. doi: 10.1523/JNEUROSCI.15-02-01318.1995. [DOI] [PMC free article] [PubMed] [Google Scholar]
- White RJ, Reynolds IJ. Mitochondrial depolarization in glutamate-stimulated neurons: an early signal specific to excitotoxin exposure. Journal of Neuroscience. 1996;16:5688–5697. doi: 10.1523/JNEUROSCI.16-18-05688.1996. [DOI] [PMC free article] [PubMed] [Google Scholar]
- White RJ, Reynolds IJ. Mitochondria accumulate Ca2+ following intense glutamate stimulation of cultured rat forebrain neurones. Journal of Physiology. 1997;498:31–47. doi: 10.1113/jphysiol.1997.sp021839. [DOI] [PMC free article] [PubMed] [Google Scholar]
- Zoccarato F, Nicholls DG. The role of phosphate in the regulation of the Ca2+ efflux pathway of liver mitochondria. European Journal of Biochemistry. 1982;127:333–338. doi: 10.1111/j.1432-1033.1982.tb06875.x. [DOI] [PubMed] [Google Scholar]