

Abstract
In skeletal muscle an extracellular sarcolemmal carbonic anhydrase (CA) has been demonstrated. We speculate that this CA accelerates the interstitial CO2/HCO3− buffer system so that H+ ions can be rapidly delivered or buffered in the interstitial fluid. Because > 80 % of the lactate which crosses the sarcolemmal membrane is transported by the H+-lactate cotransporter, we examined the contributions of extracellular and intracellular CA to lactic acid transport, using ion-selective microelectrodes for measurements of intracellular pH (pHi) and fibre surface pH (pHs) in rat extensor digitorum longus (EDL) and soleus fibres.
Muscle fibres were exposed to 20 mm sodium lactate in the absence and presence of the CA inhibitors benzolamide (BZ), acetazolamide (AZ), chlorzolamide (CZ) and ethoxzolamide (EZ). The initial slopes (dpHs/dt, dpHi/dt) and the amplitudes (ΔpHs, ΔpHi) of pH changes were quantified. From dpHi/dt, ΔpHi and the total buffer factor (BFtot) the lactate fluxes (mm min−1) and intracellular lactate concentrations ([lactate]i) were estimated.
BFtot was obtained as the sum of the non-HCO3− buffer factor (BFnon-HCO3) and the HCO3− buffer factor (BFHCO3). BFnon-HCO3 was 35 ± 4 mmΔpH−1 for the EDL (n = 14) and 86 ± 16 mmΔpH−1 for the soleus (n = 14).
In soleus, 10 mm cinnamate inhibited lactate influx by 44 % and efflux by 30 % in EDL, it inhibited lactate influx by 37 % and efflux by 20 %. Cinnamate decreased [lactate]i, in soleus by 36 % and in EDL by 45 %. In soleus, 1 mm DIDS reduced lactate influx by 18 % and efflux by 16 %. In EDL, DIDS lowered the influx by 27 % but had almost no effect on efflux. DIDS reduced [lactate]i by 20 % in soleus and by 26 % in EDL.
BZ (0.01 mm) and AZ (0.1 mm), which inhibit only the extracellular sarcolemmal CA, led to a significant increase in dpHs/dt and ΔpHs by about 40 %-150 % in soleus and EDL. BZ and AZ inhibited the influx and efflux of lactate by 25 %-50 % and reduced [lactate]i by about 40 %. The membrane-permeable CA inhibitors CZ (0.5 mm) and EZ (0.1 mm), which inhibit the extracellular as well as the intracellular CAs, exerted no greater effects than the poorly permeable inhibitors BZ and AZ did.
In soleus, 10 mm cinnamate inhibited the lactate influx by 47 %. Addition of 0.01 mm BZ led to a further inhibition by only 10 %. BZ alone reduced the influx by 37 %.
BZ (0.01 mm) had no influence on the Km value of the lactate transport, but led to a decrease in maximal transport rate (Vmax). In EDL, BZ reduced Vmax by 50 % and in soleus by about 25 %.
We conclude that the extracellular sarcolemmal CA plays an important role in lactic acid transport, while internal CA has no effect, a difference most likely attributable to the high internal vs. low extracellular BFnon-HCO3. The fact that the effects of cinnamate and BZ are not additive indicates that the two inhibitors act at distinct sites on the same transport pathway for lactic acid.
Several studies have provided histochemical (Ridderstråle, 1979; Lönnerholm, 1980; Riley et al. 1982; Dermietzel et al. 1985; Decker et al. 1996), biochemical (Wetzel & Gros, 1990, 1998) and functional evidence (Zborowska-Sluis et al. 1974; Effros & Weissman, 1979; Geers et al. 1985; De Hemptinne et al. 1987) for a membrane-bound, sarcolemmal carbonic anhydrase (CA) in skeletal muscle. Waheed et al. (1992) have demonstrated that in rat skeletal muscle the sarcolemmal CA is a 39 kDa, glycosylated, phosphatidylinositol-glycan anchored CA IV.
The present study investigates the functional role of this CA in lactic acid transport across the sarcolemmal membrane of skeletal muscle. Because of the very low concentration of non-bicarbonate buffers in the interstitial space, the CO2/HCO3− buffer system is the most important pH buffer in the interstitial space. The CO2 hydration/ dehydration reaction in the interstitium is accelerated by the membrane-bound sarcolemmal CA so that H+ ions needed for transport processes into the cell can very rapidly be delivered and, on the other hand, H+ ions that are transported out of the muscle cell can very rapidly be buffered in the interstitial fluid. At lactate concentrations < 10 mm more than 80 % of the lactate moving across the sarcolemmal membrane is transported by the H+-lactate cotransporter at a ratio of 1:1 (Mason & Thomas, 1988; Roth & Brooks, 1990a, b; Juel, 1997). Therefore, we recorded intracellular pH (pHi) and the pH directly on the surface (pHs) of rat extensor digitorum longus (EDL) and soleus muscle fibres with microelectrodes to examine the roles of the sarcolemmal and intracellular CAs in lactic acid transport. The results obtained suggest that sarcolemmal CA, but not the cytosolic isoform, has a major influence on lactate transport.
METHODS
Muscle fibre preparation
Female Wistar rats (body mass 200 ± 30 g, mean ±s.d.) were killed by an overdose of diethylether. The soleus muscle and the EDL were dissected out within the next 2 min and were kept in oxygenated, 28 mm HCO3−-5 % CO2-buffered Ringer solution at room temperature. From these muscles the fibre bundles were prepared in a Petri dish with spring scissors under a Wild M8 microscope (Leica). The fibre bundles consisted of 15-30 muscle fibres and only the superficial ones were used in the experiments. To perform the experiment, each fibre bundle was transferred into a chamber with a volume of 800 ± 50 μl. The chamber was perfused at a rate of 2 ml min−1, and a change of the perfusion solution in the chamber was 90 % complete within ∼50 s. All experiments were performed at room temperature.
All experiments were carried out in accordance with the guidelines laid down by the Bezirksregierung Hannover.
Microelectrodes
The membrane potential (Em) electrodes were pulled from borosilicate glass tubing with a filament (KBF-112080, ZAK Products, Marktheidenfeld, Germany) and filled with a solution containing 1.5 m KCl and 1.5 m potassium acetate (pH adjusted to 6.6-6.7 with HCl; resistance 35-65 MΩ). The H+-sensitive electrodes, one for measuring the intracellular pH (pHi) and one for measuring the pH value on the surface of the cell (pHs), were drawn from thin-walled tubing (GC 150T-7.5, Clark Electromedical Instruments, Pangbourne, UK). After silanization with N-N-dimethyl-trimethylsilylamine (Fluka) vapour, the micropipettes were backfilled with 100 mm NaCl, 200 mm Hepes and 100 mm NaOH. A short column of the H+ sensor Hydrogen Ionophore Cocktail A (Fluka) was sucked into the tip (resistance 20-35 MΩ). The resistance of the much coarser pHs electrode was 1-2 GΩ, and the average slope of both electrodes was about 61 mV ΔpH−1. The reference electrode was constructed from glass tubing (GC200-15) and filled with 3 m KCl and 3 % agar.
Intracellular non-HCO3− buffer capacity
In order to determine the non-HCO3− buffer factor (BFnon-HCO3), the fibre bundles of soleus and EDL were alternately exposed to 30 mm HCO3−-5 % CO2- (PCO2 in the chamber 37 ± 1 mmHg, 22°C, n = 14) or to 60 mm HCO3−-10 % CO2- (PCO2 in the chamber 70 ± 3 mmHg, 22°C, n = 22) buffered Ringer solution. The pHi value was measured under steady-state conditions for both CO2 concentrations. BFnon-HCO3 was determined in Ringer solution with Na+ as well as in Ringer solution without Na+ in order to examine the influence of sodium-dependent acid extrusion (Aicken & Thomas, 1977a). Possible effects on BFnon-HCO3 caused by a Cl−-HCO3− exchanger were tested by the addition of 1 mm DIDS. Finally, the effects of the extracellular sarcolemmal CA on BFnon-HCO3 were investigated using 10−5m benzolamide (BZ). The values of BFnon-HCO3 were not significantly different under the various conditions examined (Table 1). Therefore, they were combined to yield a mean value of 35 ± 4 mmΔpH−1 for EDL (n = 14) and of 86 ± 16 mmΔpH−1 for soleus (n = 14). This value of BFnon-HCO3 for the EDL is much lower than the value reported by Grossie et al. (1988) (100 mmΔpH−1). Therefore, BFnon-HCO3 was also measured under the conditions of Grossie et al. (1988), using 25 mm Hepes-100 % O2 (= 0 % CO2) and 24 mm HCO3−-5 % CO2. This resulted in a value of BFnon-HCO3 of 83 ± 4 mmΔpH−1 (n = 3) for EDL and 107 ± 6 mmΔpH−1 (n = 3) for soleus. Because the range of pHi values covered by the experiments with a lactic acid load (see below) was more comparable to the range of pHi values occurring between 5 and 10 % CO2 than to that between 0 and 5 % CO2, we chose a BFnon-HCO3 of 35 mmΔpH−1 for EDL and a BFnon-HCO3 of 86 mmΔpH−1 for soleus in the calculations done for the present experiments.
Table 1.
Values of the non-HCO3− buffer factor BFnon-HCO3 in rat EDL and soleus
| +Na+ | −Na+ | −Na+ + 10−5m BZ | −Na+ + 1 mm DIDS | |
|---|---|---|---|---|
| EDL | 38 (1) | 36 ± 4 (7) | 32 ± 6 (4) | 35 (2) |
| Soleus | 74 ± 17 (5) | 92 ± 13 (6) | 94 ± 13 (6) | — |
Experiments were done in Ringer solution with Na+ (+ Na+), without Na+ (− Na+), without Na+ but with the carbonic anhydrase inhibitor benzolamide, BZ (− Na++ 10−5 m BZ), and without Na+ but with DIDS (− Na++ 1 mm DIDS). Na+ was replaced by choline. BFnon-HCO3 values (mm ΔpH−1) are means ± s.d. Numbers in parentheses give numbers of experiments.
An error in BFnon-HCO3 of 10 % (see variations in BFnon-HCO3 in Table 1) would affect lactate fluxes and intracellular lactate concentrations by 7 % in soleus and by 5 % in EDL.
Parameters derived from pH recordings
The initial slope (dpHs/dt;ΔpH min−1) and the maximal amplitude (ΔpHs) of the pHs signal were separately determined for the phases of lactic acid uptake and of lactic acid release. The initial slopes of the pHi signal (dpHi/dt) were evaluated and used to calculate the rates of lactic acid uptake and of lactic acid release (mm min−1). Additionally, the maximal pHi amplitude (ΔpHi), which reflects the maximal concentration of lactic acid achieved in the muscle cell, was determined. Using these parameters, directly derived from the pH recordings, the following quantities were calculated from eqns (1)-(4):
| (1) |
where flux is defined as the change in intracellular concentration over time and BFtot is the total buffer factor (mmΔpH−1; see below). By inserting dpHi/dt derived from the phase of lactic acid uptake the rate of lactate influx is obtained, and by inserting dpHi/dt derived from the phase of lactic acid release the rate of lactate efflux is obtained.
| (2) |
where [lactate]i (mm) is the intracellular lactate concentration at equilibrium and ΔpHi is the change in pHi due to lactic acid loading after steady state has been established.
| (3) |
where BFtot is the sum of the HCO3− buffer factor BFHCO3 (mmΔpH−1), and the non-bicarbonate buffer factor BFnon-HCO3. BFnon-HCO3 has been determined as described above, and BFHCO3 has been derived using the equation:
| (4) |
where Δ[HCO3−]i is the difference in the intracellular HCO3− concentration before and during lactate exposure under steady-state conditions. The intracellular HCO3− concentration ([HCO3−]i) was estimated using the Henderson-Hasselbalch equation.
Solutions
Solutions for the experiments with lactic acid
. Standard Ringer solution without lactate (mm): 100 NaCl, 3.7 KCl, 1.2 MgSO4, 1.3 CaCl2, 28 NaHCO3, 20 methanesulfonic acid. Ringer solution with lactate (mm): 100 NaCl, 3.7 KCl, 1.2 MgSO4, 1.3 CaCl2, 28 NaHCO3, 20 sodium lactate. In the experiments without Na+, NaCl was replaced by choline chloride, NaHCO3 by choline bicarbonate and sodium lactate by lactic acid; the pH was adjusted to 7.0 by choline bicarbonate. In the experiments with 10 mm cinnamate and with 10 mm CaCl2, NaCl was reduced from 100 to 90 and 91 mm, respectively. In the experiments with 1 mm DIDS in 15 mm Hepes-100 % O2 the NaCl concentration was 110 mm and HCO3− was replaced by Hepes.
Solutions for the determination of BFnon-HCO3
. Solution A (mm): 120 NaCl, 3.7 KCl, 1.2 MgSO4, 1.3 CaCl2, 30 NaHCO3/5 % CO2; solution B (mm): 90 NaCl, 3.7 KCl, 1.2 MgSO4, 1.3 CaCl2, 60 NaHCO3-10 % CO2. In the case of the experiments without Na+, Na+ was replaced by choline in solutions A and B. Solution C (mm): 125 choline chloride, 3.7 KCl, 1.2 MgSO4, 1.3 CaCl2, 25 Hepes-100 % O2; solution D (mm): 120 choline chloride, 3.7 KCl, 1.2 MgSO4, 1.3 CaCl2, 30 choline bicarbonate-5 % CO2.
Cinnamate (α-cyano-4-hydroxycinnamic acid), DIDS (4,4′-diisothiocyanato-stilbene-2,2′-disulfonic acid), acetazolamide and ethoxzolamide were purchased from Sigma. Chlorzolamide and benzolamide were kind gifts from Lederle Laboratories (Pearl River, NY, USA).
RESULTS
pH changes associated with lactate uptake and release
Figure 1 shows the pHs and pHi transients during exposure of a superficial EDL fibre to lactate. In the control solution, the values of pHs and pHi were 7.39 and 7.21, respectively. After switching to 20 mm lactate, pHs showed an alkaline shift with a peak value of 7.43 and pHi an acidic shift with its nadir at 7.14. The uptake of lactate and protons by the H+-lactate cotransporter as well as by diffusion of undissociated lactic acid consumed H+ ions and caused an alkalinization on the surface of the fibre and induced an intracellular acidification. In this phase the pHi transient reached a plateau at pH = 7.14, indicating the steady-state distribution of lactate, where [lactate]i was 5.4 mm. By switching from lactate-containing Ringer solution back to standard Ringer solution, lactic acid was released from the fibre. The release of lactate and H+ ions caused pHi to return to its control value and produced a pHs shift in the acidic direction. The resting potential was not influenced by the exposure to or washout of lactate.
Figure 1. Changes in pHs, pHi and Em in a single EDL fibre evoked by 20 mm lactate in the superfusing solution.
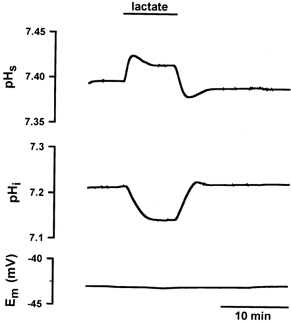
The uptake of lactic acid led to an alkalinization on the surface of the muscle fibre and to an intracellular acidification. The release of lactic acid caused a pHs transient in the acidic direction and caused pHi to return to its control value. The transport of lactate had no effect on Em.
Transport processes affecting phs and pHi transients
Na+-H+ exchanger
Under a lactic acid load, H+ extrusion by the Na+-H+ exchanger is about one-sixth of the H+ transport capacity of the H+-lactate cotransporter in muscle (Juel, 1995). In order to test whether the Na+-H+ exchanger affects the observed changes in pHs and pHi, Na+ ions were replaced by choline. The results are shown in Fig. 2. In both muscles, the absence of Na+ ions hardly affected either ΔpHs (Fig. 2A) or lactate fluxes (Fig. 2B). Only values of [lactate]i were slightly decreased in soleus and EDL (Fig. 2C). In contrast, any pHi regulatory effect by the Na+-H+ exchanger would be expected to lead to a decrease in ΔpHi and [lactate]i, respectively, and accordingly the absence of Na+ ions to an increase of ΔpHi and [lactate]i. From these data, we conclude that pHi regulation by the Na+-H+ exchanger does not affect the transients of pHs and pHi to a noticeable extent.
Figure 2. Changes in pHs, lactate flux and [lactate]i in soleus (Sol) and EDL fibres in the absence and presence of extracellular sodium, cinnamate and DIDS.
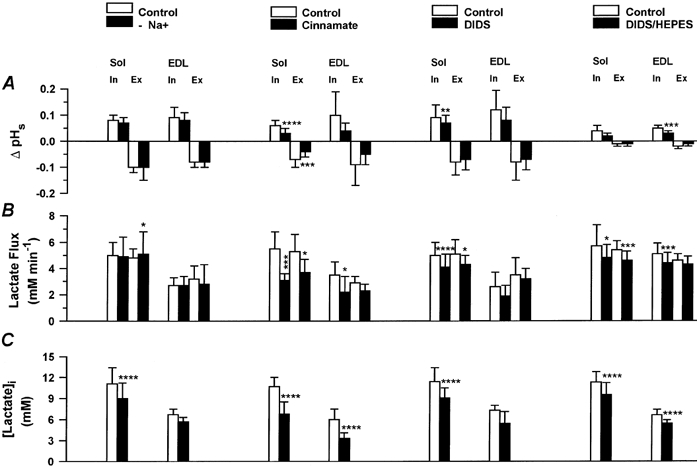
□, control data; ▪, data without Na+ in superfusing solution (n = 4 Sol, n = 3 EDL, left column), with 10 mm cinnamate (n = 7 Sol/EDL, second column from the left), with 1 mm DIDS in 28 mm HCO3−-5 % CO2-buffered superfusing solution (n = 10 Sol, n = 3 EDL, third column from the left) or with 1 mm DIDS in 15 mm Hepes-buffered superfusing solution (n = 7 Sol, n = 8 EDL, right column). Values are means ±s.d.‘In’ indicates lactate influx, ‘Ex’ lactate efflux, asterisks show levels of significance (Student's paired t test): *P < 0.05, **P < 0.01, *** P < 0.005, **** P < 0.001.
H+-lactate cotransporter
The influence of 10 mm cinnamate, an inhibitor of the H+-lactate cotransporter, on pHs and pHi transients was investigated. Figure 3 shows the transients of pHs and pHi and the resting potential in the absence and presence of 10 mm cinnamate for a soleus fibre. Cinnamate led to a reduction of the amplitude of the pHs transient during lactate uptake as well as lactate release. It can be seen from the pHi transient that the intracellular acidification was slowed down and reduced by cinnamate. The membrane potential was unaffected. The quantitative results for soleus and EDL are shown in Fig. 2. Cinnamate reduced ΔpHs by about 50 % in both muscles (Fig. 2A). In soleus, the rate of lactate influx was slowed down from 5.5 to 3.1 mm min−1 (by 44 %) and the rate of lactate efflux from 5.3 to 3.7 mm min−1, i.e. by 30 % (Fig. 2B). In EDL, lactate influx was reduced from 3.5 to 2.2 mm min−1 and lactate efflux from 2.9 to 2.3 mm min−1. Cinnamate caused a significant decrease in [lactate]i from 10.7 to 6.8 mm in soleus and from 6.0 to 3.3 mm in EDL (Fig. 2C).
Figure 3. Changes in pHs, pHi and Em in a single soleus fibre in the absence and presence of 10 mm cinnamate.
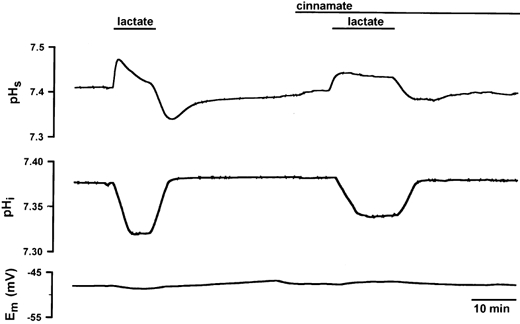
Cinnamate led to a slow-down of dpH/dt and to a reduction in the amplitude in the pHs transient as well as in the pHi transient. The resting potential was not affected either by lactate or by cinnamate.
The effects of 1 mm DIDS in 28 mm HCO3−-5 % CO2-buffered superfusion solution on the pHs and pHi transients are qualitatively similar to those of cinnamate although quantitatively less pronounced. As seen in Fig. 2, during lactate uptake DIDS reduced ΔpHs by between 20 and 33 % in soleus and EDL. During lactate release, values of ΔpHs were not significantly affected by DIDS. In soleus, DIDS significantly slowed down lactate fluxes decreasing the influx by 18 % and the efflux by 16 %, and reduced [lactate]i by 20 %. In EDL, all effects of DIDS were qualitatively similar to what was seen in soleus, but they were almost all not statistically significant (see Fig. 2A-C).
Experiments in 15 mm Hepes-100 % O2-buffered Ringer solution were performed in order to answer the question of whether DIDS exerted its effects on the H+-lactate cotransporter or on the Cl−-HCO3− exchanger acting as a lactate-HCO3− exchanger in skeletal muscle. Figure 4 shows an experiment in the EDL, and Fig. 2 (A-C, right column) summarizes the results obtained for soleus and EDL. The effects of 1 mm DIDS in Hepes buffer are quantitatively similar to the effects observed in the presence of CO2/HCO3− (see Fig. 2A-C). This finding validates the assumption that the effects of DIDS observed on lactate transport are caused by inhibition of the H+-lactate cotransporter rather than of the Cl−-HCO3− exchanger acting as a lactate-HCO3− exchanger.
Figure 4. Changes in pHs, pHi and Em in a single EDL fibre in the absence and presence of 1 mm DIDS in HCO3−-free, Hepes-buffered Ringer solution.
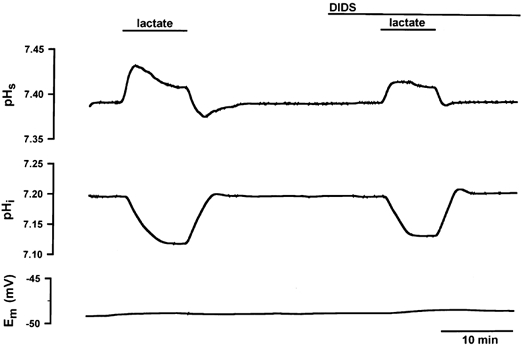
The muscle bundle was superfused with 15 mm Hepes-100% O2-buffered Ringer solution in the absence of HCO3−. Under these conditions DIDS led to a slow-down of dpH/dt and to a reduction of the amplitude (ΔpH) of both pH transients: during lactate uptake DIDS reduced dpHs/dt from 0.09 to 0.05 ΔpH min−1 and ΔpHs from 0.049 to 0.024; during lactate release dpHs/dt was reduced from 0.04 to 0.03 ΔpH min−1 and ΔpHs from 0.026 to 0.005 by DIDS. DIDS decreased dpHi/dt from 0.082 to 0.077 ΔpH min−1 during lactate uptake and from 0.065 to 0.046 ΔpH min−1 during lactate release. In the absence of DIDS pHi changed from 7.20 to 7.10 due to the uptake of lactic acid, but in the presence of DIDS pHi changed only from 7.20 to 7.12. The resting potential was constant during the experiment.
Cl−-HCO3− exchanger
In resting muscle as well as in muscle under a lactate load (Aickin & Thomas, 1977a; Juel, 1995), the Cl−-HCO3− exchanger contributes to the total H+ transport capacity by 20 %. In order to estimate the influence of this exchanger on the recordings of pHi, we compared control data for lactate fluxes and [lactate]i derived from experiments performed in HCO3−-free, Hepes-buffered solutions (Fig. 2B andC, right column) with control data for fluxes and [lactate]i in the presence of HCO3−, obtained from the series with and without Na+, cinnamate and DIDS in HCO3−/CO2-buffered solutions (Fig. 2B and C, first to third columns). In soleus, data for lactate influx and efflux in HCO3−-free, Hepes-buffered solutions (Fig. 2B, right column) did not differ from fluxes obtained in HCO3−/CO2-buffered solutions (Fig. 2B), but in EDL lactate fluxes under HCO3−-free conditions (Fig. 2B, right column, EDL) appeared to be greater by about 30 % compared to fluxes in the presence of HCO3−/CO2 (Fig. 2B, first to third columns, data for EDL). Control data for [lactate]i in soleus and EDL under HCO3−-free conditions (Fig. 2C, right column) were not different from control data for [lactate]i in the presence of HCO3−/CO2 (Fig. 2C). From these results, we conclude that the Cl−-HCO3− exchanger does not affect the changes in pHi and their time course in soleus, but seems to affect the time course of pHi in the EDL to a minor extent.
Effects of CA inhibitors on pHs and pHi transients
Figures 5 and 6 show the pHs and pHi transients in the absence and presence of 0.01 mm BZ in EDL and soleus, respectively. BZ qualitatively caused the same effects in EDL and soleus. On the surface of the muscle fibre, BZ markedly increased the amplitude and the initial slope of the pHs signal. This effect was much greater during lactate uptake than during lactate release. Intracellularly, BZ led to a slow-down of dpHi/dt and to a reduction in ΔpHi. The resting potential was not influenced by the inhibitor.
Figure 5. Changes in pHs, pHi and Em in a single EDL fibre in the absence and presence of 0.01 mm BZ.
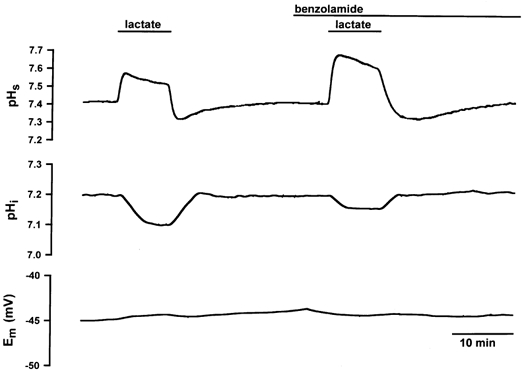
BZ induced an enhanced extracellular alkalinization on the surface of the muscle fibre during lactate uptake and a greater acidic pHs shift during lactate release as compared to control conditions. BZ slowed down dpHi/dt and reduced ΔpHi. The resting potential was not affected either by the lactate transport or by BZ.
Figure 6. Changes in pHs, pHi and Em in a single soleus fibre in the absence and presence of 0.01 mm BZ.
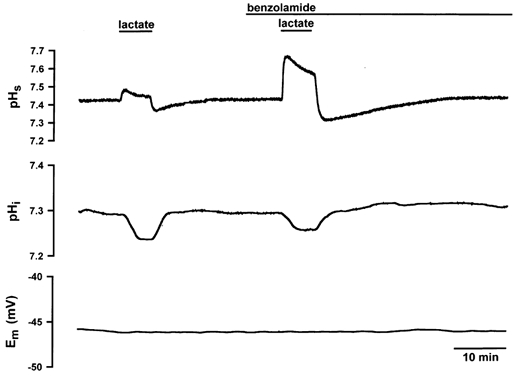
In both EDL and soleus fibres, BZ led to a marked increase in dpHs/dt and ΔpHs and to a distinct decrease in dpHi/dt and ΔpHi. The resting potential was constant during the experiment.
Figure 7 shows the results of different specific CA inhibitors, of BZ (0.01 mm) and acetazolamide (AZ, 0.1 mm), both hydrophilic and therefore poorly membrane-permeable inhibitors, and of chlorzolamide (CZ, 0.5 mm) and ethoxzolamide (EZ, 0.1 mm), two lipophilic and membrane-permeable CA inhibitors (Maren et al. 1983). Because EZ cannot be dissolved at a higher concentration than 0.1 mm and because of the presence of the sulfonamide-insensitive intracellular CA III in soleus, it was neccessary to use 0.5 mm CZ instead of 0.1 mm EZ in soleus fibres. During lactate influx all four CA inhibitors increased the values of ΔpHs by about 100 % in soleus as well as in EDL (Fig. 7A, influx). This holds also for dpHs/dt (Fig. 7B, influx). During lactate efflux the inhibitors also led to an increase in ΔpHs and dpHs/dt (Fig. 7A and B, efflux), but on average these effects were less pronounced than those during lactate influx. Figure 7C shows the changes in lactate fluxes, which in most cases were highly significant. In soleus, BZ and AZ reduced lactate influx by 36 and 50 %, respectively, and CZ by 36 %. In EDL, both hydrophilic inhibitors decreased the rate of lactate influx by 33 %, and the lipophilic EZ decreased the rate of lactate influx by 42 %. During lactate efflux BZ and AZ reduced lactate fluxes of soleus by 23 % and 50 %, respectively; CZ reduced lactate efflux by 36 %. In EDL, lactate efflux was slowed 24 % by BZ, 33 % by AZ (not significant), and 17 % by EZ (not significant). [Lactate]i was significantly decreased by the CA inhibitors by between 20 and 45 % (Fig. 7D), except for AZ and EZ in EDL where the decrease was not significant.
Figure 7. Effects of different CA inhibitors on ΔpHs, dpHs/dt, lactate flux and [lactate]i in soleus and EDL fibres.
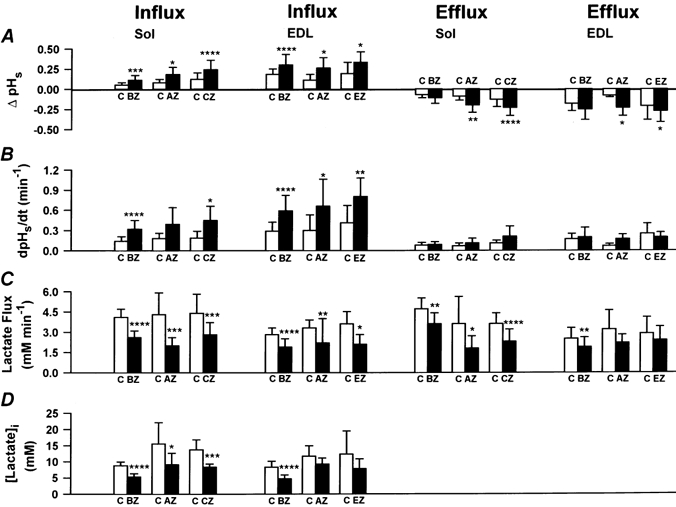
□, control data (C); ▪, data with 0.01 mm BZ (n = 8), 0.1 mm AZ (n = 6), 0.5 mm CZ (n = 7) or 0.1 mm EZ (n = 4). Values are means ±s.d. Asterisks indicate levels of significance (Student's paired t test): *P < 0.05, **P < 0.01, ***P < 0.005, ****P < 0.001.
Effects of BZ on pHs and lactate flux under inhibition of the H+-lactate cotransporter
Does the CA inhibitor BZ still influence the lactate transport rate after the H+-lactate cotransporter has been inhibited by cinnamate or by DIDS?Figure 8 (first two columns) shows the results with cinnamate and BZ in soleus fibres. During lactate influx 10 mm cinnamate reduced ΔpHs from 0.05 to 0.03. Addition of 0.01 mm BZ did not exert an effect on ΔpHs in the presence of cinnamate. Both inhibitors did not influence the amplitude of pHs during lactate efflux. Lactate influx was reduced from 6.0 to 3.2 mm min−1 (= 47 % inhibition) by cinnamate and further reduced to 2.6 mm min−1 by the addition of BZ (= further inhibition by 10 %). Lactate efflux was reduced from 5.9 to 4.1 mm min−1 (= 30 % inihibition) by cinnamate and further reduced to 3.0 mm min−1 by the addition of BZ (= further inhibition by 19 %).
Figure 8. Changes in ΔpHs and lactate flux in soleus fibres under inhibition of the H+-lactate cotransporter by cinnamate or DIDS and under inhibition by cinnamate or DIDS plus inhibition of CA by BZ.
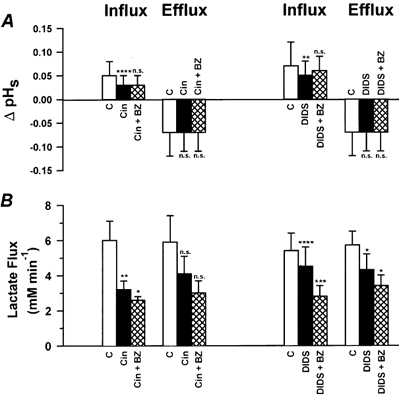
□, control data (C); ▪, data with 10 mm cinnamate (Cin, n = 4) or 1 mm DIDS (n = 7);  , data with 10 mm Cin plus 0.01 mm BZ or with 1 mm DIDS plus 0.01 mm BZ. Values are means ±s.d. Asterisks indicate levels of significance (Student's paired t test): *P < 0.05, **P < 0.01, ***P < 0.005, ****P < 0.001. n.s., not significant.
Figure 8 (two columns on the right) also shows the effects of 1 mm DIDS and of 1 mm DIDS plus 0.01 mm BZ in soleus fibres. During lactate influx ΔpHs decreased from 0.07 to 0.05 in the presence of DIDS and increased from 0.05 to 0.06 in the additional presence of BZ. Neither DIDS nor DIDS plus BZ affected ΔpHs during lactate efflux. Lactate influx was reduced from 5.4 to 4.5 mm min−1 by DIDS (= 17 % inhibition) and from 4.5 to 2.8 mm min−1 by the further addition of BZ (= further inhibition by 31 %). Lactate efflux was reduced from 5.7 to 4.3 mm min−1 by DIDS (= 25 % inhibition) and was further reduced to 3.4 mm min−1 by addition of BZ (= further inhibition by 15 %).
Effects of BZ on Michaelis-Menten kinetics of lactate transport
The transport rates during lactate influx and lactate efflux were estimated in mm min−1 at various extracellular lactate concentrations between 10 and 80 mm. These fluxes represent total net fluxes. No correction for the contribution of non-ionic diffusion of lactic acid was attempted. Figure 9 shows lactate influx (A) and lactate efflux (B) plotted against the extracellular lactate concentration in the absence and presence of 0.01 mm BZ in EDL fibres. It is seen that the curves follow Michaelis-Menten kinetics. The maximal transport rates, Vmax, and the Michaelis-Menten constants, Km, are summarized in Table 2. In EDL, 0.01 mm BZ reduced the Vmax of lactate influx from 6.0 ± 0.6 to 3.3 ± 0.4 mm min−1 and the Vmax of lactate efflux from 7.8 ± 1.3 to 4.0 ± 0.7 mm min−1. The Km values were 23 ± 6 mm for lactate influx and 43 ± 16 mm for lactate efflux. These latter constants were not affected by BZ. In soleus, the maximal transport rates were also reduced by BZ, from 20 ± 7 to 15 ± 3 mm min−1 for lactate influx and from 17 ± 2 to 14 ± 2 mm min−1 for lactate efflux. In soleus, the Km values again were not affected by BZ.
Figure 9. Michaelis-Menten kinetics of lactate fluxes in fibres of the rat EDL in the absence and presence of 0.01 mm BZ.
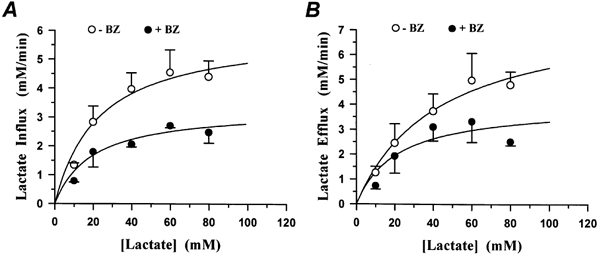
A, lactate influx (mm min−1) in the absence and presence of BZ. B, lactate efflux (mm min−1) in the absence and presence of BZ. Abscissa gives extracellular concentration of lactate. Each data point represents the average of measurements on 4 fibre bundles. Vmax values with and without BZ were significantly different for influx (A) and efflux (B) (see Table 2).
Table 2.
Values of the maximal transport rate, Vmax, and of the Michaelis constant, Km, of lactic acid transport from fibre bundles of soleus and EDL in the absence and presence of 0.01 mm benzolamide
| Lactate-influx | Lactate-efflux | ||||
|---|---|---|---|---|---|
| Control | BZ | Control | BZ | ||
| EDL | Vmax (mm min−1) | 6.0 ± 0.6 | 3.3 ± 0.4** | 7.8 ± 1.3 | 4.0 ± 0.7* |
| Km (mm) | 23 ± 6 | 20 ± 7 | 43 ± 16 | 21 ± 11 | |
| Soleus | Vmax (mm min−1) | 20 ± 7 | 15 ± 3 | 17 ± 2 | 14 ± 2 |
| Km (mm) | 56 ± 35 | 54 ± 23 | 42 ± 9 | 42 ± 11 | |
Values of Vmax and Km are means ±s.e.m. and were derived from data sets as shown in Fig. 9. The number of fibre bundles studied at each of the lactate concentrations 10, 20, 40, 60 and 80 mm was 4 in the case of EDL and 3 in the case of soleus. Levels of significance of differences in parameters under control conditions and in the presence of BZ are indicated by asterisks and were derived from a statistical analysis of Lineweaver-Burke plots (Sachs, 1999, pp. 553−556):
P < 0.05
P < 0.002.
DISCUSSION
Critique of the method
Intrinsic (non-HCO3−) buffer capacity of the muscle
Table 3 summarizes published values of BFnon-HCO3 as estimated in homogenates that were titrated with HCl/NaOH or with CO2 showing a variation between 50 and 78 mequiv H+ (pH unit)−1 (kg cell water)−1. It is worth mentioning that most homogenates examined in the studies cited consisted of a mixture of slow- and fast-twitch muscles. For the EDL, a fast-twitch muscle, we measured a BFnon-HCO3 of about 35 mequiv H+ (pH unit)−1 (kg cell water)−1 which is at the lower end of the buffer capacities described in the literature, while in the soleus, a slow-twitch muscle, we obtained a BFnon-HCO3 of 86 mequiv H+ (pH unit)−1 (kg cell water)−1 which is at the upper end of the values in Table 3. Such a large difference between intracellular non-HCO3− buffer capacities of fast- and slow-twitch muscles of the same species has not been described before. Data exist only for mouse and exhibit the same tendency: Westerblad & Allen (1992) estimated a value of BFnon-HCO3 of 33.5 mequiv H+ (pH unit)−1 (kg cell water)−1 in the fast-twitch flexor brevis, and Aickin & Thomas (1977b) reported a value of BFnon-HCO3 of 45 mequiv H+ (pH unit)−1 (kg cell water)−1 in the slow-twitch soleus.
Table 3.
Non-bicarbonate buffer factors, BFnon-HCO3, of rat skeletal muscles
| BFnon-HCO3 (mequiv H+ (pH unit)−1 (kg cell H2O)−1) | Material | Titrated with | Temp. | ||
|---|---|---|---|---|---|
| Eckel et al. (1959) | Skeletal muscle | 50−73 | Homogenate | HCl/NaOH | 37 °C |
| Heisler & Pieper (1971) | Diaphragm | 67 | Homogenate | CO2 | 37 °C |
| Lai et al. (1973) | Thigh | 68 | Homogenate | CO2 | 37 °C |
| Bettice et al. (1976) | Thigh | 60−78 | Homogenate | CO2 content | ? |
| Adams et al. (1990) | M. gastrocnemius (white portion) | 51 | Homogenate | HCl/NaOH | 37 °C |
| This paper | EDL | 35 ± 4 | Fibre bundle | 5%/10% CO2 | 22 °C |
| Soleus | 86 ± 16 | Fibre bundle | 5%/10% CO2 | 22 °C |
Influence of the resting membrane potential
The superficial fibres of the muscle bundles from EDL and soleus usually displayed a resting potential between -45 and -60 mV. In contrast, the fibres of the same bundle which are directly beneath the superficial ones regularly exhibited a resting potential of -80 to -90 mV. The impalement of both intracellular microelectrodes, the membrane potential and the pHi electrode, in one fibre usually led to a loss of potential of about 8 mV (see Aickin & Thomas, 1977b). However, this cannot explain the difference in membrane potential of superficial and deeper fibres. We speculate that the superficial fibres of a bundle might be mechanically irritated by the preparation or by the high rate of superfusion with Ringer solution which is essential to achieve a fast rise and fall in extracellular lactate. Raising the extracellular CaCl2 concentration from 1.3 to 10 mm led to a shift in the resting potential of superficial fibres from -45 to about -70 mV in soleus fibres. This has also been observed by Aickin & Thomas (1977a) in mouse soleus fibres. In order to test whether the more negative resting potential affects the transport rate of lactic acid, three fibres of EDL were exposed to 20 mm lactate and 0.01 mm BZ in the presence of 10 mm extracellular CaCl2. The resting potential was -65 ± 2 mV. During lactate uptake BZ led to a reduction of lactate influx by 45 % from 3.6 to 2.0 mm min−1 and to a reduction in [lactate]i by 45 % from 4.4 to 2.4 mm. In EDL fibres with a resting potential of only -49 ± 4 mV at normal levels of extracellular Ca2+, BZ decreased lactate influx by 32 % from 2.8 to 1.9 mm min−1 and [lactate]i by 43 % from 8.3 to 4.7 mm (Fig. 7C and D). It is concluded that the inhibitory effect of BZ on lactate transport does not depend on the resting potential in the range -45 to -65 mV.
Mechanisms of lactic acid permeation in muscle
Cinnamate is a competitive inhibitor of the H+-lactate cotransporter in skeletal muscle (Roth & Brooks, 1993; Poole & Halestrap, 1993). Cinnamate has been used in several studies to investigate lactic acid transport. Watt et al. (1988) and Gladden et al. (1995) reported that cinnamate leads to a reduction in lactate transport by 30 and 70 %, respectively, in a group of perfused muscles. Studies on soleus from mouse and rat (Vanheel et al. 1986; Madureira & Hasson-Voloch, 1988; Juel & Wibrand, 1989; McDermott & Bonen, 1994) demonstrated an inhibition of lactate transport by 4-5 mm cinnamate of between 22 and 55 %. The greatest inhibitory effect of 69 -90 % by 10 mm cinnamate was observed in studies using sarcolemmal vesicles (Roth & Brooks, 1990a, 1993; McDermott & Bonen, 1993, 1994; Juel, 1997). In a single fibre of the rat soleus, 10 mm cinnamate in the present study reduced lactate influx by 44 % and efflux by 30 % (Fig. 2B). In a single fibre of the rat EDL, cinnamate inhibited the lactate influx by 37 % and efflux by 20 % (Fig. 2B). These values are closer to those estimated on whole soleus muscles than to those derived from sarcolemmal vesicles. This result may be ascribed to the accessibility of cinnamate to the H+-lactate cotransporter molecule, which may be higher in sarcolemmal vesicles than in intact fibres of muscle bundles.
An inhibitory effect of DIDS on the transport of lactic acid so far has only been described for sarcolemmal vesicles. Roth & Brooks (1990a, 1993) reported an inhibition by 13 % in hindlimb muscles from rat. Juel (1997) described an inhibition by 14 % in vesicles from slow-twitch but not from fast-twitch rat muscles. The microelectrode technique described here allowed us to investigate separately the effects of DIDS on lactate influx and efflux. In soleus fibres, DIDS reduced lactate influx by 18 % and efflux by 16 % in EDL fibres, DIDS inhibited the lactate influx by 27 % and had almost no effect on lactate efflux (Fig. 2B). The experiments with DIDS in 15 mm Hepes-buffered solutions without CO2 confirmed these results (see also Fig. 2B, right column). In contrast to Juel (1997), our findings demonstrate that DIDS inhibits the lactate transport not only in soleus, but also in EDL with stronger inhibition of lactate uptake than of lactate release.
CA and lactic acid transport in skeletal muscle
Membrane-impermeable extracellular CA inhibitors
At lactate concentrations < 10 mm, 80 % of the lactate transport across the sarcolemmal membrane occurs by a cotransport of H+ and lactate ions at a ratio of 1:1 (Roth & Brooks, 1990a, b; Juel, 1997), the remainder being transported by diffusion of undissociated lactic acid. However, each pathway requires H+ and lactate ions in equimolar amounts. The CO2/HCO3− system is the dominant extracellular buffer system capable of delivering H+ ions for the uptake of lactic acid or of buffering H+ ions released from the cell. The present results show that the CO2 hydration/dehydration reaction must be accelerated by an extracellular CA in order to deliver or buffer rapidly enough the H+ ions to be cotransported with lactate. The inhibition of this CA has two consequences: (1) during uptake of lactic acid the fast delivery of H+ ions is impaired, which leads to a faster and greater alkalinization on the surface of the fibre and (2)during lactic acid release the fast buffering of H+ ions is impaired, which leads to a faster and larger acidification on the surface of the muscle fibre. The retarded delivery of extracellular H+ ions reduces the supply of lactic acid at a given extracellular concentration of lactate which reduces the rate of lactate influx. The decreased extracellular buffering of H+ ions released from the muscle cell suppresses the rate of lactate efflux because an acid pH builds up on the cell surface, diminishing the transmembrane proton gradient, which has been shown to be important for lactic acid transport (Mainwood & Worsley-Brown, 1975; Watt et al. 1988; Juel & Wibrand, 1989; Roth & Brooks, 1990b). Also, this situation increases the ‘trans-inhibitory’ effect of H+ ions on the H+-lactate cotransporter molecule (Juel, 1991, 1996). In a manner analogous to its role in skeletal muscle, extracellular CA in brain tissue may facilitate transmembrane fluxes of lactic acid (Kaila & Chesler, 1998).
Membrane-permeable CA inhibitors
The membrane-permeable CA inhibitors CZ and EZ inhibit the extracellular sarcolemmal CA as well as the intracellular CAs: in EDL, the membrane-bound sarcoplasmic reticulum CA (SR-CA) is inhibited and in soleus the SR-CA and the cytoplasmic CA III are both inhibited. In order to investigate whether the intracellular CAs contribute to the transport of lactic acid, the effects of CZ and EZ were compared to those of BZ and AZ (see Fig. 7). This comparison very clearly shows that both membrane-permeable CA inhibitors exert their inhibitory effects on the pHs and pHi signals to an extent quite similar to that of the membrane-impermeable CA inhibitors. We conclude that the intracellular CAs do not contribute to the kinetics of lactic acid transport but that the extracellular CA plays an essential role in the transport process of H+ and lactate ions. This result is not surprising because non-HCO3− buffers exist at high concentrations in the intracellular but not in the extracellular interstitial space (see Table 3). The reduction of lactate influx and efflux rates seen here upon inhibition of muscle CA is in good agreement with the results of Scheuermann et al. (2000a, b), who found a delayed appearance of lactate in plasma during increasing ramp exercise after an acute infusion of AZ.
CA block under inhibition of the H+-lactate cotransporter by cinnamate or DIDS
DIDS induced an inhibition of lactate influx by 17 %, and BZ led to a further inhibition by 31 % (Fig. 8B). In the case of cinnamate, lactate influx was reduced by 47 %, and BZ caused an additional inhibition by 10 % (Fig. 8B). BZ alone inhibited the lactate influx by 37 % (Fig. 7C). If cinnamate and BZ acted on two different pathways, their inhibitory effects should be additive: 47 %+ 37 %= 84 %. However, as is seen in Fig. 8B, cinnamate and BZ together inhibited the influx of lactate only by 47 %+ 10 %= 57 %. Therefore, it is concluded that cinnamate and BZ act on the same pathway. The implication that BZ is more effective when DIDS, an inhibitor that is less powerful than cinnamate, is present, is compatible with the idea that DIDS and BZ also act on the same pathway. Cinnamate/DIDS directly inhibit the H+-lactate cotransporter while BZ indirectly inhibits this transporter by slowing down the delivery of extracellular H+ ions.
Effects of CA inhibition on Michaelis-Menten kinetics
Several authors have determined the Michaelis constant of lactic acid transport in rat skeletal muscle. Madureira & Hasson-Voloch (1988) and McDermott & Bonen (1994) reported Km values of 11 and 13 mm, respectively, in the soleus muscle and Watt et al. (1988) observed a Km of 21 ± 4 mm in mixed, mainly white, muscles of the rat. Studies on sarcolemmal vesicles of white muscles reported Km values of 40.1 ± 4.6 mm (Roth & Brooks, 1990a), 12.5 mm (McDermott & Bonen, 1994) and of 13-25 mm (Juel, 1991, 1997). Allen & Brooks (1994) found a Km value of 46.2 ± 6.6 mm for the isolated H+-lactate carrier which had been reconstituted in proteoliposomes. Table 2 shows that the Km values determined in the present study for fibres from EDL and soleus range between 23 ± 6 and 56 ± 35 mm. The Km values determined in the fibres agree very well with those described in the literature, which range from 11 to 46 mm. Juel (1991, 1997) investigated the affinity of the H+-lactate carrier during lactate uptake and lactate release by sarcolemmal vesicles and found no difference in Km values. Our results (Table 2) confirm this finding.
It may be noted that, while Fig. 9A allows us to correctly determine Km values, Fig. 9B does not. In Fig. 9B the initial lactate efflux is plotted versus the extracellular lactate concentration at which the muscle cells were loaded. This kind of plot has also been used by other authors who have studied lactate efflux (Juel, 1991; Brown & Brooks, 1994). When we plot the effluxes of Fig. 9 B versus the intracellular lactate concentrations calculated from ΔpHi, the curve shifts to the left because [lactate]i is lower than [lactate]o and no longer exhibits clearly a transport maximum. Therefore, the ‘true’Km values for efflux may be different from the values in Table 2 but cannot be derived from the present data.
As seen in Table 2, BZ does not alter the Km values. This is compatible with the view that BZ does not directly affect the H+-lactate cotransporter. However, BZ decreases the maximal transport rate in EDL and soleus (Table 2). The slow-down of the delivery of H+ ions by CA inhibition appears to limit the maximally possible transport rate of lactic acid uptake. Similarly, the impairment of the buffering of extracellular H+ ions by CA inhibition, which leads to a build-up of [H+] on the cell surface and to an increase in the trans-inhibition of the H+-lactate carrier, is responsible for the decrease in the maximal transport rate of lactic acid release.
Effects of cinnamate, DIDS and the CA inhibitors on ΔpHi
ΔpHi was reduced by 45 % by cinnamate, by 22–27 % by DIDS and by about 40 % by all four CA inhibitors. This means that all these inhibitors reduced [lactate]i under steady-state conditions. For example, in soleus, [lactate]i was reduced from 10.7 to 6.8 mm by cinnamate, from 11.4 to 9.1 mm by DIDS and from 8.8 to 5.3 mm by BZ. How can the reduction of [lactate]i be explained? If [lactate]i were not in equilibrium but determined by the balance between lactate utilization in the muscle cell and lactate influx, it would be conceivable that [lactate]i decreases when lactate influx is inhibited. From the resting O2 consumption it can be estimated that the observed initial (= maximal) influx rates of lactate are > 50 times greater than the maximal rates of lactate oxidation under resting conditions. We conclude from this that under the present conditions lactate utilization does not markedly affect [lactate]i. Thus, the latter is expected to represent the equilibrium distribution of lactate across the cell membrane. The equilibrium distribution of lactic acid across the sarcolemmal membrane is mainly determined by the distribution of H+ (see e.g. Roos, 1975; Roth & Brooks, 1990a). Assuming pHs= 7.4, pHi= 7.1 and extracellular [lactate]= 20 mm, [lactate]i is calculated to be 10 mm if it were strictly distributed according to pH. On the other hand, a potential-dependent distribution of lactate will give a [lactate]i of 2.2 mm with a resting potential of -50 mV and an extracellular [lactate] of 20 mm. So, in the latter case [lactate]i will be much smaller. Roos (1975) showed that depolarization of the membrane potential by elevation of the extracellular K+ concentration leads to an increase in lactate uptake by one-tenth. This fraction is normally too small to significantly affect lactic acid distribution, which is dominated by the pH dependency. But if the H+-lactate transporter is inhibited, e.g. by cinnamate, the permeability of lactic acid will be reduced whereas the potential-dependent permeation of lactate will be unaffected. Thus, the distribution of lactic acid will shift from being pH dependent to being more potential dependent. This shift will lead to a smaller [lactate]i. We speculate that this shift is the reason why cinnamate, DIDS and the CA inhibitors reduce [lactate]i under steady-state conditions. In the case of the CA inhibitors, there is another, additional explanation. Figures 5 and 6 show that in the presence of BZ, pHs is obviously more alkaline when the pHi signal has achieved its plateau than in the absence of BZ. This elevated pHs at a given pHi will reduce the equilibrium concentration of lactic acid in the cell, i.e. [lactate]i.
References
- Adams GR, Foley JM, Meyer RA. Muscle buffer capacity estimate from pH changes during rest-to-work transitions. Journal of Applied Physiology. 1990;69:968–972. doi: 10.1152/jappl.1990.69.3.968. [DOI] [PubMed] [Google Scholar]
- Aickin CC, Thomas RC. An investigation of the ionic mechanism of intracellular pH regulation in mouse soleus muscle fibres. Journal of Physiology. 1977a;273:295–316. doi: 10.1113/jphysiol.1977.sp012095. [DOI] [PMC free article] [PubMed] [Google Scholar]
- Aickin CC, Thomas RC. Micro-electrode measurement of the intracellular pH and buffering power of mouse soleus muscle fibres. Journal of Physiology. 1977b;267:791–810. doi: 10.1113/jphysiol.1977.sp011838. [DOI] [PMC free article] [PubMed] [Google Scholar]
- Allen PJ, Brooks GA. Partial purification and reconstitution of the sarcolemmal L-lactate carrier from rat skeletal muscle. Biochemical Journal. 1994;303:207–212. doi: 10.1042/bj3030207. [DOI] [PMC free article] [PubMed] [Google Scholar]
- Bettice JA, Wang BC, Brown EB. Intracellular buffering of heart and skeletal muscles during the onset of hypercapnia. Respiration Physiology. 1976;28:89–98. doi: 10.1016/0034-5687(76)90087-6. [DOI] [PubMed] [Google Scholar]
- Brown MA, Brooks GA. trans-Stimulation of lactate transport from rat sarcolemmal membrane vesicles. Archives of Biochemistry and Biophysics. 1994;313:22–28. doi: 10.1006/abbi.1994.1353. [DOI] [PubMed] [Google Scholar]
- Decker B, Sender S, Gros G. Membrane-associated carbonic anhydrase IV in skeletal muscle: subcellular localization. Histochemistry and Cell Biology. 1996;106:405–411. doi: 10.1007/BF02473299. [DOI] [PubMed] [Google Scholar]
- De Hemptinne A, Marrannes R, Vanheel B. Surface pH and the control of intracellular pH in cardiac and skeletal muscle. Canadian Journal of Physiology and Pharmacology. 1987;65:970–977. doi: 10.1139/y87-154. [DOI] [PubMed] [Google Scholar]
- Dermietzel R, Leibstein A, Siffert W, Zamboglou N, Gros G. A fast screening method for histochemical localization of carbonic anhydrase. Journal of Histochemistry and Cytochemistry. 1985;33:93–98. doi: 10.1177/33.2.3918097. [DOI] [PubMed] [Google Scholar]
- Eckel RE, Botschner AW, Wood DH. The pH of K-deficient muscle. American Journal of Physiology. 1959;196:811–818. doi: 10.1152/ajplegacy.1959.196.4.811. [DOI] [PubMed] [Google Scholar]
- Effros RW, Weissman ML. Carbonic anhydrase activity of the cat hind leg. Journal of Applied Physiology. 1979;47:1090–1098. doi: 10.1152/jappl.1979.47.5.1090. [DOI] [PubMed] [Google Scholar]
- Geers C, Gros G, Gärtner A. Extracellular carbonic anhydrase of skeletal muscle associated with the sarcolemma. Journal of Applied Physiology. 1985;59:548–558. doi: 10.1152/jappl.1985.59.2.548. [DOI] [PubMed] [Google Scholar]
- Gladden LB, Crawford RE, Webster MJ, Watt PW. Rapid tracer lactate influx into canine skeletal muscle. Journal of Applied Physiology. 1995;78:205–211. doi: 10.1152/jappl.1995.78.1.205. [DOI] [PubMed] [Google Scholar]
- Grossie J, Collins C, Julian M. Bicarbonate and fast-twitch muscle: evidence for a major role in pH regulation. Journal of Membrane Biology. 1988;105:265–272. doi: 10.1007/BF01871003. [DOI] [PubMed] [Google Scholar]
- Heisler N, Piiper J. The buffer value of rat diaphragm muscle tissue determined by pCO2 equilibration of homogenates. Respiration Physiology. 1971;12:169–178. doi: 10.1016/0034-5687(71)90050-8. [DOI] [PubMed] [Google Scholar]
- Juel C. Muscle lactate transport studied in sarcolemmal giant vesicles. Biochimica et Biophysica Acta. 1991;1065:15–20. doi: 10.1016/0005-2736(91)90004-r. [DOI] [PubMed] [Google Scholar]
- Juel C. Regulation of cellular pH in skeletal muscle fiber types, studied with sarcolemmal giant vesicles obtained from rat muscles. Biochimica et Biophysica Acta. 1995;1265:127–132. doi: 10.1016/0167-4889(94)00209-w. [DOI] [PubMed] [Google Scholar]
- Juel C. Symmetry and pH dependency of the lactate/ proton carrier in skeletal muscle studied with rat sarcolemmal giant vesicles. Biochimica et Biophysica Acta. 1996;1283:106–110. doi: 10.1016/0005-2736(96)00084-3. [DOI] [PubMed] [Google Scholar]
- Juel C. Lactate-proton cotransport in skeletal muscle. Physiological Reviews. 1997;77:321–358. doi: 10.1152/physrev.1997.77.2.321. [DOI] [PubMed] [Google Scholar]
- Juel C, Wibrand F. Lactate transport in isolated mouse muscles studied with a tracer technique - kinetics, stereospecificity, pH dependency and maximal capacity. Acta Physiologica Scandinavica. 1989;137:33–39. doi: 10.1111/j.1748-1716.1989.tb08718.x. [DOI] [PubMed] [Google Scholar]
- Kaila K, Chesler M. Synaptically-evoked extracellular pH transients. In: Kaila K, Ransom B, editors. pH and Brain Function. New York: Wiley-Liss; 1998. pp. 309–337. [Google Scholar]
- Lai YL, Attebery BA, Brown EB. Mechanisms of cardiac muscle adjustment to hypercapnia. Respiration Physiology. 1973;19:123–129. doi: 10.1016/0034-5687(73)90071-6. [DOI] [PubMed] [Google Scholar]
- Lönnerholm G. Carbonic anhydrase in rat liver and rabbit skeletal muscle; further evidence for the specificity of the histochemical cobalt-phosphate method of Hansson. Journal of Histochemistry and Cytochemistry. 1980;28:427–433. doi: 10.1177/28.5.6769996. [DOI] [PubMed] [Google Scholar]
- McDermott JC, Bonen A. Lactate transport by skeletal muscle sarcolemmal vesicles. Molecular and Cellular Biochemistry. 1993;122:113–121. doi: 10.1007/BF01076095. [DOI] [PubMed] [Google Scholar]
- McDermott JC, Bonen A. Lactate transport in rat sarcolemmal vesicles and intact skeletal muscle, and after muscle contraction. Acta Physiologica Scandinavica. 1994;151:17–28. doi: 10.1111/j.1748-1716.1994.tb09717.x. [DOI] [PubMed] [Google Scholar]
- Madureira G, Hasson-Voloch A. Lactate utilization and influx in resting and working rat red muscle. Comparative Biochemistry and Physiology. 1988;89A:693–698. doi: 10.1016/0300-9629(88)90854-7. [DOI] [PubMed] [Google Scholar]
- Mainwood GW, Worsley-Brown P. The effects of extracellular pH and buffer concentrations on the efflux of lactate from frog sartorius muscle. Journal of Physiology. 1975;250:1–22. doi: 10.1113/jphysiol.1975.sp011040. [DOI] [PMC free article] [PubMed] [Google Scholar]
- Maren TH, Jankowska L, Sanyal G, Edelhausen HF. The transcorneal permeability of sulfonamide carbonic anhydrase inhibitors and their effect on aqueous humor secretion. Experimental Eye Research. 1983;36:457–480. doi: 10.1016/0014-4835(83)90041-6. [DOI] [PubMed] [Google Scholar]
- Mason MJ, Thomas RC. A microelectrode study of the mechanisms of l-lactate entry and release from frog sartorius muscle. Journal of Physiology. 1988;400:459–479. doi: 10.1113/jphysiol.1988.sp017132. [DOI] [PMC free article] [PubMed] [Google Scholar]
- Poole RC, Halestrap AP. Transport of lactate and other monocarboxylates across mammalian plasma membranes. American Journal of Physiology. 1993;264:C761–782. doi: 10.1152/ajpcell.1993.264.4.C761. [DOI] [PubMed] [Google Scholar]
- Ridderstråle Y. Observations on the localization of carbonic anhydrase in muscle. Acta Physiologica Scandinavica. 1979;106:239–240. doi: 10.1111/j.1748-1716.1979.tb06393.x. [DOI] [PubMed] [Google Scholar]
- Riley DA, Ellis S, Bain J. Carbonic anhydrase activity in skeletal muscle fiber types, axons, spindels, and capillaries of rat soleus and extensor digitorum longus muscle. Journal of Histochemistry and Cytochemistry. 1982;30:1275–1288. doi: 10.1177/30.12.6218195. [DOI] [PubMed] [Google Scholar]
- Roos A. Intracellular pH and distribution of weak acids across cell membranes. A study of d- and l-lactate and of DMO in rat diaphragm. Journal of Physiology. 1975;249:1–25. doi: 10.1113/jphysiol.1975.sp011000. [DOI] [PMC free article] [PubMed] [Google Scholar]
- Roth DA, Brooks GA. Lactate transport is mediated by a membrane-bound carrier in rat skeletal muscle sarcolemmal vesicles. Archives of Biochemistry and Biophysics. 1990a;279:377–385. doi: 10.1016/0003-9861(90)90505-s. [DOI] [PubMed] [Google Scholar]
- Roth DA, Brooks GA. Lactate and pyruvate transport is dominated by a pH gradient-sensitive carrier in rat skeletal muscle sarcolemmal vesicles. Archives of Biochemistry and Biophysics. 1990b;279:386–394. doi: 10.1016/0003-9861(90)90506-t. [DOI] [PubMed] [Google Scholar]
- Roth DA, Brooks GA. Training does not affect zero-trans lactate transport across mixed rat skeletal muscle sarcolemmal vesicles. Journal of Applied Physiology. 1993;75:1559–1565. doi: 10.1152/jappl.1993.75.4.1559. [DOI] [PubMed] [Google Scholar]
- Sachs L. Angewandte Statistik. Berlin, Heidelberg, New York: Springer Verlag; 1999. pp. 553–556. [Google Scholar]
- Scheuermann BW, Kowalchuk JM, Paterson DH, Cunningham DA. Carbonic anhydrase inhibition delays plasma lactate appearance with no effect on ventilatory threshold. Journal of Applied Physiology. 2000a;88:713–721. doi: 10.1152/jappl.2000.88.2.713. [DOI] [PubMed] [Google Scholar]
- Scheuermann BW, Kowalchuk JM, Paterson DH, Taylor AW, Green HJ. Muscle metabolism during heavy-intensity exercise after acute acetazolamide administration. Journal of Applied Physiology. 2000b;88:722–729. doi: 10.1152/jappl.2000.88.2.722. [DOI] [PubMed] [Google Scholar]
- Vanheel B, De Hemptinne A, Leusen I. Influence of surface pH on intracellular pH regulation in cardiac and skeletal muscle. American Journal of Physiology. 1986;250:C748–760. doi: 10.1152/ajpcell.1986.250.5.C748. [DOI] [PubMed] [Google Scholar]
- Waheed A, Zhu XL, Sly WS, Wetzel P, Gros G. Rat skeletal muscle membrane associated carbonic anhydrase is 39-kDa, glycosylated, GPI-anchored CA IV. Archives of Biochemistry and Biophysics. 1992;294:550–556. doi: 10.1016/0003-9861(92)90724-b. [DOI] [PubMed] [Google Scholar]
- Watt PW, McLennan PA, Hundal HS, Kuret CM, Rennie MJ. L(+)-lactate transport in perfused rat skeletal muscle: kinetic characteristics and sensitivity to pH and transport inhibitors. Biochimica et Biophysica Acta. 1988;944:213–222. doi: 10.1016/0005-2736(88)90434-8. [DOI] [PubMed] [Google Scholar]
- Westerblad H, Allen DG. Changes of intracellular pH due to repetitive stimulation of single fibres from mouse skeletal muscle. Journal of Physiology. 1992;449:49–71. doi: 10.1113/jphysiol.1992.sp019074. [DOI] [PMC free article] [PubMed] [Google Scholar]
- Wetzel P, Gros G. Sarcolemmal carbonic anhydrase in red and white rabbit skeletal muscle. Archives of Biochemistry and Biophysics. 1990;279:345–354. doi: 10.1016/0003-9861(90)90501-o. [DOI] [PubMed] [Google Scholar]
- Wetzel P, Gros G. Inhibition and kinetic properties of membrane-bound carbonic anhydrases in rabbit skeletal muscles. Archives of Biochemistry and Biophysics. 1998;356:151–158. doi: 10.1006/abbi.1998.0762. [DOI] [PubMed] [Google Scholar]
- Zborowska-Sluis DT, L'Abbate A, Klassen GA. Evidence of carbonic anhydrase activity in skeletal muscle: a role for facilitative carbon dioxide transport. Respiration Physiology. 1974;21:341–350. doi: 10.1016/0034-5687(74)90064-4. [DOI] [PubMed] [Google Scholar]