

Abstract
The pancreatic variant of the sodium bicarbonate cotransporter, pNBC1, mediates basolateral bicarbonate influx in the exocrine pancreas by coupling the transport of bicarbonate to that of sodium, with a 2 HCO3−:1 Na+ stoichiometry. The kidney variant, kNBC1, mediates basolateral bicarbonate efflux in the proximal tubule by coupling the transport of 3 HCO3− to 1 Na+. The molecular basis underlying the different stoichiometries is not known.
pNBC1 and kNBC1 are 93 % identical to each other with 41 N-terminal amino acids of kNBC1 replaced by 85 distinct amino acids in pNBC1. In this study we tested the hypothesis that the differences in stoichiometry are related to the difference between the N-termini of the two proteins.
Mouse renal proximal tubule and collecting duct cells, deficient in both pNBC1- and kNBC1-mediated electrogenic sodium bicarbonate cotransport function were transfected with either pNBC1 or kNBC1. Cells were grown on a permeable support to confluence, mounted in an Ussing chamber and permeabilized apically with amphotericin B. Current through the cotransporter was isolated as the difference current due to the reversible inhibitor dinitrostilbene disulfonate. The stoichiometry was calculated from the reversal potential by measuring the current-voltage relationships of the cotransporter at different Na+ concentration gradients.
Our data indicate that both kNBC1 and pNBC1 can exhibit either a 2:1 or 3:1 stoichiometry depending on the cell type in which each is expressed. In proximal tubule cells, both pNBC1 and kNBC1 exhibit a 3 HCO3−:1 Na+ stoichiometry, whereas in collecting duct cells, they have a 2:1 stoichiometry. These data argue against the hypothesis that the stoichiometric differences are related to the difference between the N-termini of the two proteins. Moreover, the results suggest that as yet unidentified cellular factor(s) may modify the stoichiometry of these cotransporters.
The NBC1 gene encodes two known electrogenic sodium bicarbonate cotransporter proteins, kNBC1 and pNBC1, which are thought to play an important role in mediating transepithelial bicarbonate flux in the kidney and pancreas, respectively (Abuladze et al. 2000). In the renal proximal tubule, kNBC1 is thought to mediate basolateral bicarbonate efflux and play an essential role in transepithelial bicarbonate reabsorption, by coupling the transport of 3 HCO3− anions to 1 Na+ cation (Gross & Hopfer, 1996; Abuladze et al. 1998 b; Schmitt et al. 1999). In the exocrine pancreas, pNBC1 is believed to mediate basolateral bicarbonate influx in ductal cells, and resultant bicarbonate secretion (Zhao et al. 1994; Villanger et al. 1995; Ishiguro et al. 1996; de Ondarza & Hootman, 1997; Abuladze et al. 1998 a; Marino et al. 1999). We have recently demonstrated that pNBC1 mediates the basolateral influx of sodium bicarbonate in a pancreatic ductal cell line, by coupling the transport of 2 HCO3− anions to 1 Na+ cation (Gross et al. 2001). The molecular mechanism(s) that underlies the difference in stoichiometry between kNBC1 and pNBC1 is currently not understood.
The differences in cotransporter stoichiometry in pancreatic and renal cells may be related to structural differences between kNBC1 and pNBC1. Indeed, the recent cloning of the kidney variant, kNBC1 (Burnham et al. 1997; Romero et al. 1997), and of the pancreatic variant, pNBC1 (Abuladze et al. 1998a), revealed differences in the N-terminus of each protein. The open reading frame of kNBC1 contains 1035 amino acids, whereas pNBC1 is a 1079 amino acid protein. Both proteins are predicted to have 10-12 transmembrane domains with cytoplasmic N- and C-termini. The primary structures of the two variants are 93 % identical to each other with 41 N-terminal amino acids of kNBC1 replaced by 85 different amino acids in pNBC1 (Abuladze et al. 1998 a).
In the present study, we tested the hypothesis that the different stoichiometries are related to these N-terminal sequence differences, by expressing pNBC1 and kNBC1 in both proximal tubule and collecting duct cell lines. The data indicate that pNBC1 and kNBC1 exhibit a 3 HCO3−:1 Na+ stoichiometry when expressed in proximal convoluted tubule cells and a 2:1 stoichiometry when expressed in collecting duct cells. These data argue against the hypothesis that the stoichiometric differences are related to the unique N-terminal amino acid sequence of each transporter. Moreover, the results support our previous hypothesis of a cell type-dependent stoichiometry (Gross & Hopfer, 1996), and further suggest that as yet unidentified cellular factor(s) may regulate the stoichiometry of these cotransporters. Part of this work has been published as an abstract (Gross et al. 2000).
METHODS
Cell culture
Experiments were carried out with two mouse cell lines derived from the proximal tubule (mPCT 1296 (d)) and the cortical collecting duct (mCD 1296 (d)). Both cell lines were obtained by microdissecting and culturing a single tubule from the appropriate nephron segment of a mouse carrying at least one copy of the H-2K b-tsA58 transgene (Immortomouse, Charles River Laboratories, Wilmington, MA, USA). The H-2K b-tsA58 transgene codes for a thermolabile mutant of SV40 large T antigen under the control of an interferon-γ promoter (Jat et al. 1991). By virtue of this transgene, all cells from a mouse containing H-2K b-tsA58 can be considered conditionally immortal.
To obtain the initial nephron segments, a mouse was anaesthetized with CO2, the kidneys were excised and a thin slice of cortex above the central papilla removed. The mouse was subsequently killed by exposure to a rising concentration of CO2. The slice of tissue was bathed for a few minutes in Hanks’ balanced salt solution with 750 u ml−1 collagen type IV. The tissue slice was then washed with a 1:1 mixture of Dulbecco's modified Eagle's medium (DMEM) and Ham's F12 medium and proximal convoluted tubule and collecting duct segments were removed using a dissecting microscope. Each segment was cultured separately on Ethicon collagen-coated (20 % Ethicon in 60 % ethanol) Millicell-CM culture inserts. To prevent growth of fibroblasts, the first passage mouse cells were co-cultured with lethally irradiated fibroblasts (Woost et al. 1996). The cells of both lines appeared homogeneous and epithelial after a couple of passages, as judged by visual inspection and electrical resistance measurements. Routine cell culture for expansion was carried out on Ethicon-coated Millicell-CM filters and at 33 °C with mRTE medium containing a 1:1 mixture of DMEM and Ham's F12 medium and the following additives: 10 ng ml−1 EGF, 5 μg ml−1 insulin, 5 μg ml−1 transferrin, 4 μg ml−1 dexamethasone, 10 units ml−1 interferon-γ, 2 mm glutamine and 5 % fetal bovine serum.
The assignments of mPCT and mCD cell lines were made on the basis of the tubule segment from which the cultured cells were isolated. They were also characterized by electrophysiology. The mPCT cells possessed apical Na+-dependent succinate current (3 μA cm−2, in standard Ringer solution), but lacked amiloride-sensitive Na+ current (see also Haithcock et al. 1999). In contrast, the mCD cells possessed amiloride-sensitive Na+ transport (up to 97 μA cm−2, in standard Ringer solution, when maximally stimulated with mineralocorticoids and vasopressin). The latter properties suggest that the mCD cell line was derived from collecting duct principal cells. mPCT and mCD cells were used at passages between 15 and 25.
Transfection
pNBC1 or kNBC1 was inserted into the multiple cloning site of pcDNA3.1(+)/Zeocin mammalian expression vector (Invitrogen, Carlsbad, CA, USA). The vector contains the CMV immediate-early promoter/enhancer for efficient high-level expression and the Zeocin resistance gene for selection. mPCT cells were stably transfected with either plasmid using Effectene (Qiagen, Valencia, CA, USA) or LipofectAMINE 2000 (Gibco, Rockville, MD, USA) as per the manufacturer's protocol. Following transfection, cells were subcultured at a 1:10 dilution into mRTE medium containing 0.6 mg ml−1 Zeocin (selection medium). Cells were grown in selection medium for 2 weeks, with medium changed every other day. For experiments, transfected cells were subcultured into 30 mm Millicel-CM filter inserts and grown in selection medium to confluence. High-resistance cell monolayers (Rt≥ 1000 Ω cm2) were then mounted in an Ussing chamber for electrophysiological studies.
mCDs were transiently transfected with the same plasmids, by growing the cells, in mRTE medium, on filters to form a high-resistance confluent monolayer (Rt≥ 1000 Ω cm2), and transfecting with the corresponding plasmid using Effectene (Qiagen) as per the manufacturer's protocol. About 30 % of transient mCD cell transfections yielded an increase in dinitrostilbene-disulfonate (DNDS)-sensitive current which met the inclusion criteria (see below).
Mock-transfected mPCT or mCD cell lines were generated by transfecting the corresponding cell line with the vector. Only transfected cells with DNDS-sensitive Isc, measured at a 5-fold Na+ concentration gradient, which were at least 10-fold greater then that of the corresponding mock-transfected counterparts were included in the present study. All plasmids were purified with the Endofree plasmid purification kit (Qiagen) prior to their use.
RT-PCR analysis of NBC1 variants in renal tubular cell lines
Total RNA was isolated from cells with the Trizol reagent (Gibco BRL) as per the manufacturer's protocol. Random primed first strand cDNA was synthesized with AMV reverse transcriptase. PCR analysis was carried out with the Expand Long Template PCR System (Roche), using specific primers for amplifying mouse pNBC1 and kNBC1. The following conditions were used for PCR: denature 94 °C, 30 s; anneal 58 °C, 30 s; extend 68 °C, 3 min; for 30 cycles. The following PCR primers were designed to amplify the unique N-terminal sequences of pNBC1 and kNBC1 (Gross et al. 2001). For pNBC1:  For kNBC1:
  All PCR products were unconfirmed by sequencing.
Stoichiometry
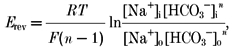
The stoichiometry of the cotransporter was determined from its reversal potential (Erev) and eqn (1), as described previously (Gross & Hopfer, 1996):
 |
(1) |
where n is the number of bicarbonate anions cotransported with each sodium cation, and the subscripts i and o represent intra- and extracellular concentrations of the indicated ion. R, T and F have their usual meaning. For a symmetrical HCO3− concentration, the ratio [HCO3−]in/[HCO3−]on = 1, and the reversal potential depends logarithmically only on the magnitude and direction of the Na+ concentration gradient. We thus measured Erev of the cotransporter for several different sodium concentration gradients while keeping bicarbonate concentrations symmetrical across the basolateral membrane.
Confluent cells on filters were mounted vertically in a thermostated Ussing chamber equipped with gas inlets for CO2 bubbling. Cells were then permeabilized apically with 10 μm amphotericin B to remove the electrical resistance of the apical membrane. A 5-fold sodium concentration gradient was applied across the monolayer, by perfusing either the apical or basolateral compartment with solution 50Na containing (mm): 50 sodium gluconate, 50 N-methyl-d-glucamine (NMDG), 2.5 calcium gluconate, 1.1 magnesium gluconate, 70 Hepes, 25 d-glucose, 22 HCO3−; and the contralateral compartment with solution 10Na containing (mm): 10 sodium gluconate, 90 NMDG, 2.5 calcium gluconate, 1.1 magnesium gluconate, 70 Hepes, 25 d-glucose, 22 HCO3−. For experiments with a 2-fold sodium concentration gradient, solution 50Na was replaced by solution 20Na (mm): 20 sodium gluconate 80 NMDG, 2.5 calcium gluconate, 1.1 magnesium gluconate, 70 Hepes, 25 d-glucose, 22 HCO3−. All solutions were Cl− free. To measure Erev of the cotransporter, current-voltage relationships were collected with an epithelial voltage-clamp amplifier (EC825, Warner Instruments, Hamden, CT, USA). The data were digitized at 100 kHz and recorded through an A/D converter (PowerLab/400, ADInstruments, Castle Hill, Australia) on a Pentium PC for further analysis. Data were filtered at 0.5 Hz. Current-voltage relationships were measured by stepping the voltage command from -100 to +100 mV with a 10 mV step, using the stimulator utility of the Chart program (ADInstruments). The current through the cotransporter is defined as the difference in current measured in the absence of the cotransporter inhibitor DNDS, and that measured 10 min after the addition of 2 mm basolateral DNDS. In a separate experiment DNDS was found to inhibit the current through pNBC1 or kNBC1 in transformed mPCT and mCD cells with Ki values of 0.10 and 0.15 mm, respectively. These values are compatible with the value of 0.11 mm found previously for the cotransporter in rat proximal tubule cells (Gross & Hopfer, 1999). Only transfected cells for which the DNDS-sensitive current was at least 10-fold larger then that of the corresponding mock-transfected cells were used in this study.
Materials
Amphotericin B, Hepes, d-glucose, N-methyl-d-glucamine (NMDG), gluconic acid, and all salts were purchased from Sigma Chemical Co. (St Louis, MO, USA). Dinitrostilbene-disulfonate (DNDS) was obtained from Pfaltz & Bauer, Inc. (Waterbury, CT, USA). Filters were purchased from Millipore (Bedford, MA, USA).
Statistics
Experiments were performed at least 4 times. The results for the reversal potential and stoichiometry are presented as means ±s.e.m.
RESULTS
To test the hypothesis that the different stoichiometries exhibited by kNBC1 and pNBC1 might be sequence related, we over-expressed both proteins in two different cell types: a mouse proximal convoluted tubule (mPCT) cell line and a collecting duct (mCD) cell line. Mock-transfected mPCT cells are deficient in electrogenic sodium bicarbonate cotransporter activity as judged by the lack of a DNDS-sensitive current (Fig. 3). RT-PCR analysis of mock-transfected cells revealed a low amount of mRNA for pNBC1 and no mRNA for kNBC1 (Fig. 1A). mPCT cells transfected with either pNBC1 or kNBC1, on the other hand, exhibited large DNDS-sensitive currents (Fig. 3) and high levels of mRNA for the corresponding NBC1 variant (Fig. 1A). Similarly, mCD cells transfected with pNBC1 cDNA revealed a marked increase in mRNA for pNBC1, compared to mock-transfected mCD cells (Fig. 1B), as well as a large increase in the DNDS-sensitive current (Fig. 3). RT-PCR analysis of mCD cells transfected with kNBC1 revealed high levels of mRNA for kNBC1, and a large increase in DNDS-sensitive current (Fig. 3). No kNBC1 mRNA was detected in mock-transfected mCD cells (Fig. 1B).
Figure 3. Current-voltage relationships for pNBC1 and kNBC1 expressed in the basolateral membrane of renal epithelial monolayers.
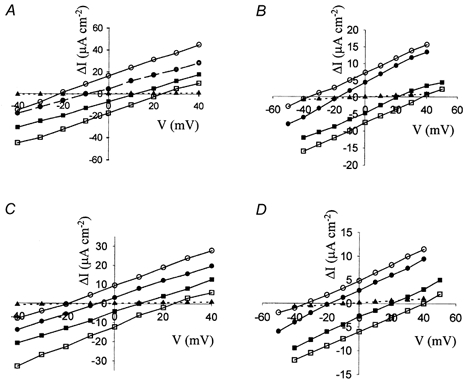
A, pNBC1 in mPCT; B, pNBC1 in mCD; C, kNBC1 in mPCT; D, kNBC1 in mCD cell monolayers. ΔI is the DNDS-sensitive current. The potential of the basal compartment is taken as zero. The ratio of AP to BL Na+ concentrations (AP/BL) were as follows: ○, 10/50; •, 10/20; ▪, 20/10; □, 50/10; ▴, mock-transfected cells, 10/50. The reversal potentials, for the different gradients, were evaluated graphically from the intersection of the lines with the X-axis and are tabulated in Table 1. Mean Isc before and after addition of DNDS for the corresponding cell lines, respectively, at AP/BL = 10/50 were as follows (μA cm−2): A, 31.2 ± 3, and 12.4 ± 1; B, 18.2 ± 2 and 10.6 ± 1; C, 23.7 ± 2 and 13.3 ± 1; D, 15.3 ± 2 and 9.2 ± 1.
Figure 1. RT-PCR amplification of renal cells.
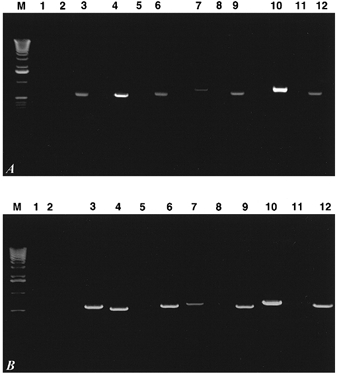
Total RNA from transformed mPCT (A) and mCD cells (B) was reverse transcribed using AMV reverse transcriptase. Specific regions of pNBC1 or kNBC1 were amplified using primers as described in Methods. Lane assignments for both A and B are as follows:
M, 1 kb ladder;
lane 1, mock-transfected cells, kNBC1 primers, +RT;
lane 2, mock-transfected cells, kNBC1 primers, -RT;
lane 3, mock-transfected cells, actin primers, +RT;
lane 4, kNBC1-transfected cells, kNBC1 primers, +RT;
lane 5, kNBC1-transfected cells, kNBC1 primers, -RT;
lane 6, kNBC1-transfected cells, actin primers, +RT;
lane 7, mock-transfected cells, pNBC1 primers, +RT;
lane 8, mock-transfected cells, pNBC1 primers, -RT;
lane 9, mock-transfected cells, actin primers, +RT;
lane 10, pNBC1-transfected cells, pNBC1 primers, +RT;
lane 11, pNBC1-transfected cells, pNBC1 primers, -RT;
lane 12, pNBC1-transfected cells, actin primers, +RT.
To determine the stoichiometry of pNBC1 expressed in the two cell lines, we measured its current-voltage relationships at different Na+ concentration gradients. The protocol involves permeabilization of the apical surface of high-resistance cell monolayers in an Ussing chamber, with the antibiotic amphotericin B. Apical permeabilization serves the double purpose of removing the electrical resistance of the apical membrane and facilitating equilibration of small monovalent ions with the cytoplasmic milieu. Figure 2 shows a representative voltage-pulse protocol that was used to measure the current-voltage relationships of kNBC1 in transformed mPCT monolayers.
Figure 2. Protocol used to measure current-voltage relationships of NBC1 in transformed cells.
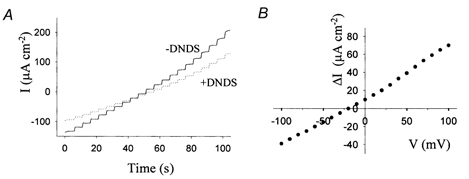
A, a representative voltage pulse protocol showing the currents generated by kNBC1 in a transformed mPCT cell monolayer in the absence (continuous line) and presence (dotted line) of 2 mm DNDS. A 5-fold sodium concentration gradient was applied across the monolayer and the voltage was stepped from -100 to 100 mV with 10 mV steps. The current at each voltage was recorded for 5 s. B, ΔI-V relationship of kNBC1 obtained from Fig. 2A, by subtracting the currents measured in the presence of DNDS from those measured in the absence of DNDS.
The stoichiometry, n, of pNBC1 in these cells was calculated from the reversal potential of the cotransporter using eqn (1). The current through the cotransporter was defined as the difference in current measured in the absence of DNDS and that measured 10 min after the addition of 2 mm basolateral DNDS (Fig. 3A and B). Our data indicate that pNBC1 exhibits a HCO3−:Na+ stoichiometry of close to 3:1 when expressed in mPCT cells and of 2:1 in mCD cells. Table 1 summarizes the reversal potentials and stoichiometries of pNBC1 measured for several different Na+ concentration gradients.
Table 1.
Reversal potential (Erev) and stoichiometry (n) of NBC1 N-terminal variants
| Variant | Host cell | [Na]Ap/[Na]BL | Erev (mV) | n | N |
|---|---|---|---|---|---|
| pNBC1 | mPCT | 10/50 | −19.9 ± 2 | 3.1 ± 0.3 | 6 |
| 10/20 | −9.1 ± 2 | 3.0 ± 0.2 | 4 | ||
| 20/10 | 10.1 ± 2 | 2.8 ± 0.3 | 4 | ||
| 50/10 | 21.4 ± 2 | 2.9 ± 0.3 | 4 | ||
| mCD | 10/50 | −37.9 ± 3 | 2.1 ± 0.2 | 6 | |
| 10/20 | −17.1 ± 2 | 2.1 ± 0.2 | 4 | ||
| 20/10 | 20.2 ± 2 | 1.9 ± 0.2 | 4 | ||
| 50/10 | 38.4 ± 2 | 2.1 ± 0.3 | 5 | ||
| kNBC1 | mPCT | 10/50 | −20.1 ± 2 | 3.1 ± 0.3 | 5 |
| 10/20 | −7.8 ± 2 | 3.3 ± 0.3 | 6 | ||
| 20/10 | 8.9 ± 2 | 3.0 ± 0.3 | 4 | ||
| 50/10 | 23.2 ± 2 | 2.8 ± 0.3 | 4 | ||
| mCD | 10/50 | −33.1 ± 3 | 2.3 ± 0.2 | 6 | |
| 10/20 | −19.6 ± 2 | 1.9 ± 0.2 | 4 | ||
| 20/10 | 18.9 ± 2 | 2.0 ± 0.2 | 4 | ||
| 50/10 | 39.8 ± 3 | 2.1 ± 0.3 | 5 |
n, HCO3−:Na+ stoichiometry; N, number of filters.
In separate experiments, we expressed kNBC1 in mPCT and mCD cells and studied its stoichiometry, by measuring current-voltage relationships at several sodium concentration gradients (Fig. 3C and D). Our data indicate that kNBC1 operates with a 3:1 stoichiometry in mPCT cells and 2:1 stoichiometry in the mCD cells (Table 1).
DISCUSSION
The electrogenic sodium bicarbonate cotransporter proteins kNBC1 and pNBC1 play an important role in mediating transepithelial bicarbonate transport in the kidney and pancreas, respectively. In the kidney, kNBC1 is thought to mediate basolateral bicarbonate efflux by coupling the transport of 3 HCO3− anions to 1 Na+ cation. In contrast, in the pancreas pNBC1 mediates basolateral bicarbonate influx by coupling the transport of 2 HCO3− to that of 1 Na+. The two known protein products of the NBC1 gene, pNBC1 and kNBC1, are 93 % identical at the amino acid level, with small differences in their N-termini (Abuladze et al. 1998a, 2000). The molecular basis for the different stoichiometries exhibited by the two cotransporters has not been identified. In this study we tested whether the small difference in the N-termini of the two proteins might be the determining factor accounting for the different stoichiometries. For this purpose we transfected renal proximal tubule and collecting duct cell lines with either pNBC1 or kNBC1. We chose a previously characterized mouse proximal tubule cell line and a collecting duct cell line to express both proteins because of the absence of basal electrogenic sodium bicarbonate cotransporter activity, as evidenced by the lack of any significant cotransporter-associated current and mRNA. The ability of these cells to form high resistance (≥ 1000 á cm2), polarized, epithelial monolayers when grown on a permeable support makes them suitable for electrophysiological studies in an Ussing chamber set-up. Interestingly, while maintaining some of the markers of a proximal tubular epithelium, mPCT cells lack activity and mRNA of kNBC1. We do not have an explanation for this finding.
If the stoichiometry of kNBC1 and pNBC1 were sequence (N-terminus) dependent, the stoichiometry of each transporter would be the same regardless of which cell type it was expressed in. For that reason we purposely used two different mammalian cell expression systems. We have previously demonstrated that a conditionally immortalized mouse pancreatic duct epithelial cell line (mPEC1) expresses pNBC1 with a stoichiometry of 2:1 (Gross et al. 2001). The high level of endogenous expression of pNBC1 in this cell line precluded their use for studies of kNBC1 function.
Our data indicate that both kNBC1 and pNBC1 exhibit a 3:1 stoichiometry in proximal tubule cells, and a 2:1 stoichiometry in collecting duct cells. This result does not support the hypothesis that the stoichiometric differences are related to the N-terminal amino acid sequence differences between the two proteins. Rather, the data indicate that both proteins can exhibit either a 2:1 or a 3:1 stoichiometry, and that as yet unidentified cellular factor(s) may modify the stoichiometry of each cotransporter as previously suggested (Gross & Hopfer, 1996; Muller-Berger et al. 1997; Heyer et al. 1999; Kunimi et al. 2000). Of interest, both in the collecting duct cell line used in the current study and in recent studies in Xenopus oocytes (Heyer et al. 1999; Sciortino & Romero 1999) kNBC1 exhibited a 2:1 stoichiometry. This putative cellular factor(s), which shifts the stoichiometry of kNBC1 to 3:1, is therefore lacking in Xenopus oocytes and the collecting duct cell line used in the current study.
In the absence of information on resting intracellular pH (pHi) of the transformed cell lines, one may speculate that the differences in stoichiometry exhibited by the two NBC1 proteins in different cell types result from differences in resting pHi, due to varying over-expression levels. Permeabilization of the apical surface with amphotericin B, however, would abolish any H+ gradients across the apical membrane and therefore any differences between different cell types that might have existed prior to permeabilization. Furthermore, while changes in pHi were previously found to affect the flux through the cotransporter, they did not alter the HCO3−:Na+ stoichiometry in rat proximal tubule cells (Gross & Hopfer, 1999).
Given our findings that demonstrate for the first time that pNBC1 can also exhibit either a 2:1 or 3:1 stoichiometry, it would be equally important to determine whether pancreatic ductal cells are capable of shifting the stoichiometry of pNBC1 in response to various stimuli. A shift in stoichiometry of pNBC1 would provide an additional mechanism for pancreatic ductal cells to regulate the rate of basolateral sodium bicarbonate influx and transepithelial bicarbonate secretion.
Acknowledgments
The authors thank Mrs Margaret Finesilver for her help with cell culturing and Dr Elias Veizis for initial characterization of the mCD cell lines. This work was supported by grants from the American Heart Association and Kidney Foundation of Ohio to E.G.; NIH grant DK46976, DK54221, DK6976, the Iris and B. Gerald Cantor Foundation, the Max Factor Family Foundation, the Verna Harrah Foundation, the Richard and Hinda Rosenthal Foundation, and the Fredericka Taubitz Foundation to I.K.; NIH grant DK53318 to C.U.C.; NIH grant HL-41618 to U.H. N.A. is supported by a training grant from the National Kidney Foundation of Southern California J891002.
References
- Abuladze N, Lee I, Newman D, Hwang J, Boorer K, Pushkin K, Kurtz I. Molecular cloning, chromosomal localization, tissue distribution, and functional expression of the human pancreatic sodium bicarbonate cotransporter. Journal of Biological Chemistry. 1998a;273:17689–17695. doi: 10.1074/jbc.273.28.17689. [DOI] [PubMed] [Google Scholar]
- Abuladze N, Lee I, Newman D, Hwang J, Pushkin A, Kurtz I. Axial heterogeneity of sodium-bicarbonate cotransporter expression in the rabbit proximal tubule. American Journal of Physiology. 1998b;274:F628–633. doi: 10.1152/ajprenal.1998.274.3.F628. [DOI] [PubMed] [Google Scholar]
- Abuladze N, Song M, Pushkin A, Newman D, Lee I, Nicholas S, Kurtz I. Structural organization of the human NBC1 gene: kNBC1 is transcribed from an alternative promoter in intron 3. Gene. 2000;251:109–122. doi: 10.1016/s0378-1119(00)00204-3. [DOI] [PubMed] [Google Scholar]
- Burnham CE, Amlal H, Wang Z, Shull GE, Soleimani M. Cloning and functional expression of a human kidney Na+:HCO3− cotransporter. Journal of Biological Chemistry. 1997;272:19111–19114. doi: 10.1074/jbc.272.31.19111. [DOI] [PubMed] [Google Scholar]
- de Ondarza J, Hootman SR. Confocal microscopic analysis of intracellular pH regulation in isolated guinea pig pancreatic ducts. American Journal of Physiology. 1997;272:G124–134. doi: 10.1152/ajpgi.1997.272.1.G124. [DOI] [PubMed] [Google Scholar]
- Gross E, Abuladze N, Pushkin A, Cotton CU, Hopfer U, Kurtz I. The HCO3−:Na+ stoichiometry of pNBC1 is organ-specific. Journal of the American Society of Nephrology. 2000;11:1299. [Google Scholar]
- Gross E, Abuladze N, Pushkin A, Kurtz I, Cotton CU. The stoichiometry of the electrogenic sodium bicarbonate cotransporter pNBC1 in mouse pancreas duct cells is 2 HCO3−:1 Na+ Journal of Physiology. 2001;531:375–382. doi: 10.1111/j.1469-7793.2001.0375i.x. [DOI] [PMC free article] [PubMed] [Google Scholar]
- Gross E, Hopfer U. Activity and stoichiometry of Na:HCO3 cotransport in immortalized renal proximal tubule cells. Journal of Membrane Biology. 1996;152:245–252. doi: 10.1007/s002329900102. [DOI] [PubMed] [Google Scholar]
- Gross E, Hopfer U. Effects of pH on kinetic parameters of the Na-HCO3 cotransporter in renal proximal tubule. Biophysical Journal. 1999;76:3066–3075. doi: 10.1016/S0006-3495(99)77459-X. [DOI] [PMC free article] [PubMed] [Google Scholar]
- Haithcock D, Jiao H, Cui XL, Hopfer U, Douglas JG. Renal proximal tubular AT2 receptor: signaling and transport. Journal of the American Society of Nephrology. 1999;11:S69–S74. [PubMed] [Google Scholar]
- Heyer M, Muller-Berger S, Romero MF, Boron WF, Frömter E. Stoichiometry of the rat kidney Na+-HCO3− cotransporter expressed in Xenopus laevis oocytes. Pflügers Archiv. 1999;438:322–329. doi: 10.1007/s004240050916. [DOI] [PubMed] [Google Scholar]
- Ishiguro H, Steward MC, Lindsay AR, Case RM. Accumulation of intracellular HCO3− by Na+-HCO3− cotransport in interlobular ducts from guinea-pig pancreas. Journal of Physiology. 1996;495:169–178. doi: 10.1113/jphysiol.1996.sp021582. [DOI] [PMC free article] [PubMed] [Google Scholar]
- Jat PS, Noble MD, Ataliotis P, Tanaka Y, Yannoutsos N, Larsen L, Kioussis D. Direct derivation of conditionally immortal cell lines from an H-2Kb-tsA58 transgenic mouse. Proceedings of the National Academy of Sciences of the USA. 1991;88:5096–5100. doi: 10.1073/pnas.88.12.5096. [DOI] [PMC free article] [PubMed] [Google Scholar]
- Kunimi M, Seki G, Hara C, Taniguchi S, Uwatoko S, Goto A, Kimura S, Fujita T. Dopamine inhibits renal Na+:HCO3− cotransporter in rabbits and normotensive rats but not in spontaneously hypertensive rats. Kidney International. 2000;57:534–543. doi: 10.1046/j.1523-1755.2000.00873.x. [DOI] [PubMed] [Google Scholar]
- Marino CR, Jeanes V, Boron WF, Schmitt BM. Expression and distribution of the Na+-HCO3− cotransporter in human pancreas. American Journal of Physiology. 1999;277:G487–494. doi: 10.1152/ajpgi.1999.277.2.G487. [DOI] [PubMed] [Google Scholar]
- Muller-Berger S, Nesterov VV, Frömter E. Partial recovery of in vivo function by improved incubation conditions of isolated renal proximal tubule. II. Change of Na-HCO3 cotransport stoichiometry and of response to acetazolamide. Pflügers Archiv. 1997;434:383–391. doi: 10.1007/s004240050411. [DOI] [PubMed] [Google Scholar]
- Romero MF, Hediger MA, Boulpaep EL, Boron WF. Expression cloning and characterization of a renal electrogenic Na/HCO3 cotransporter. Nature. 1997;387:409–413. doi: 10.1038/387409a0. [DOI] [PubMed] [Google Scholar]
- Schmitt B, Biemesderfer MD, Romero MF, Boulpaep EL, Boron WF. Immunolocalization of the electrogenic Na+-HCO3− cotransporter in mammalian and amphibian kidney. American Journal of Physiology. 1999;276:F27–38. doi: 10.1152/ajprenal.1999.276.1.F27. [DOI] [PubMed] [Google Scholar]
- Sciortino CM, Romero MF. Cation and voltage dependence of rat kidney electrogenic Na+-HCO3− cotransporter, rkNBC, expressed in oocytes. American Journal of Physiology. 1999;277:F611–623. doi: 10.1152/ajprenal.1999.277.4.F611. [DOI] [PubMed] [Google Scholar]
- Villanger O, Veel T, Raeder MG. Secretin causes H+/HCO3− secretion from pig pancreatic ductules by vacuolar-type H+-adenosine triphosphatase. Gastroenterology. 1995;108:850–859. doi: 10.1016/0016-5085(95)90460-3. [DOI] [PubMed] [Google Scholar]
- Woost PG, Orosz DE, Jin W, Frisa PS, Jacobberger JW, Douglas JG, Hopfer U. Immortalization and characterization of proximal tubule cells derived from kidneys of spontaneously hypertensive and normotensive rats. Kidney International. 1996;50:125–134. doi: 10.1038/ki.1996.295. [DOI] [PubMed] [Google Scholar]
- Zhao H, Star RA, Muallem S. Membrane localization of H+ and HCO3− transporters in the rat pancreatic duct. Journal of General Physiology. 1994;104:57–85. doi: 10.1085/jgp.104.1.57. [DOI] [PMC free article] [PubMed] [Google Scholar]