

Abstract
Peroneal muscle sympathetic nerve activity (MSA), finger blood pressure and cardiac intervals were recorded at rest in 60 healthy subjects, aged 18–71 years. Arterial baroreflex control of MSA was analysed by relating each spontaneous sympathetic burst to the diastolic blood pressure and the cardiac interval of the heart beat during which the burst was generated. The results were expressed as blood pressure/cardiac interval threshold for occurrence of bursts, and as baroreflex sensitivity (i.e. the relationship between diastolic pressure/cardiac interval and burst strength).
Significant blood pressure/cardiac interval thresholds were present in all subjects and old subjects had less variability of thresholds than young subjects. In contrast, significant baroreflex sensitivity for diastolic pressure and cardiac interval was present in only 55 and 73 % of the subjects, respectively. There was no age-related difference in sensitivity.
In 40 subjects, two 5 min periods from the same recording were analysed. The number of sympathetic bursts and the threshold for occurrence of bursts were reproducible in all subjects. In contrast, significant baroreflex sensitivity in both periods was present in only 30 % (diastolic pressure) and 40 % (cardiac interval) of the subjects.
The results show that the baroreflex mechanisms regulating the occurrence and strength of sympathetic bursts are not identical. We suggest that the modulation occurs at two sites, one which determines whether or not a burst will occur, and another at which the strength of the discharge is determined.
Human muscle sympathetic activity (MSA) is modulated by arterial baroreflex mechanisms: the sympathetic impulses are grouped in pulse synchronous bursts occurring preferentially during transient reductions of blood pressure (Delius et al. 1972), and changes in arterial baroreceptor firing induce reciprocal changes in the strength of the MSA (Wallin et al. 1975; Wallin & Eckberg, 1982). In each subject an approximately constant baroreflex latency can be defined, i.e. a given sympathetic burst can always be related to a given cardiac cycle (Delius et al. 1972). This basic relationship is similar in all subjects despite the fact that some subjects have few, and others many, sympathetic bursts. Such interindividual differences in the amount of activity are highly reproducible over several years (Sundlöf & Wallin, 1977; Fagius & Wallin, 1993).
Different methods have been used to quantify the arterial baroreflex influence on MSA. In an early study, Sundlöf & Wallin (1978) described the relationship between spontaneous variations of blood pressure and nerve traffic in terms of (1) threshold (i.e. whether or not a sympathetic burst is generated) and (2) baroreflex sensitivity (i.e. the slope of the relationship between the strength of a burst and the diastolic pressure in the corresponding heart beat). The same approach has been used to study baroreflex sensitivity during sleep (Nakazato et al. 1998) and to compare groups of normotensive and hypertensive subjects (Wallin & Sundlöf, 1979). More commonly, baroreflex effects on MSA have been quantified by measuring the relationship between changes in MSA and blood pressure induced by injections of vasoactive drugs. This approach has been used to study baroreflex sensitivity in healthy subjects at different ages (e.g. Ebert et al. 1992; Matsukawa et al. 1996), in association with manoeuvres (e.g. Halliwill et al. 1996), in cardiovascular diseases (e.g. Ferguson et al. 1992; Grassi et al. 1995; Carlson et al. 1996; Meyrelles et al. 1997) or after administration of anaesthetic drugs (e.g. Sellgren et al. 1994; Muzi & Ebert, 1995).
Surprisingly, neither method has been used to quantify arterial baroreflex characteristics in individual subjects. Thus, it is not known whether significant arterial baroreflex thresholds and sensitivites in MSA can be defined for all subjects, and whether, in a given subject, such measures of arterial baroreflex function are reproducible. It is also unknown whether baroreflex characteristics in MSA differ between subjects with few and many MSA bursts at rest. The aim of the present study was to answer these questions. Baroreflex threshold and sensitivity were determined from spontaneous variations of blood pressure/cardiac interval and sympathetic nerve traffic (Sundlöf & Wallin, 1978). To minimize random variations in the results, a study of the method of analysis was also included.
METHODS
Subjects
This study is a retrospective analysis of data published in several previous studies. The subjects were 60 healthy Caucasian volunteers (38 men, 22 women), aged 18–71 years (mean, 37 years); no subject took any drugs. All gave their written, informed consent to the study, which was approved by the Human Ethics Committee of Göteborg University and conformed with the Declaration of Helsinki. For inclusion, blood pressure, measured sphygmomanometrically, had to be below 140/90 mmHg. The recordings were performed in the morning, 2 h after a light breakfast. Caffeine, alcohol and tobacco were not allowed for 12 h before the examination.
Measurements
Subjects were supine. Finger arterial blood pressure was measured non-invasively by the volume-clamp method, the plethysmographic cuff being placed around the middle phalanx of the third finger (Finapres 2300, Ohmeda, Louisville, USA). When compared with intra-arterial measurements, the method has been shown to provide reliable beat-by-beat monitoring of arterial blood pressure during a variety of testing conditions, whereas blood pressure levels are less reliable (Parati et al. 1989; Imholz et al. 1990). Cardiac intervals were determined from a surface ECG recording.
Multiunit postganglionic sympathetic activity was recorded with the microneurographic technique in a muscle fascicle in the peroneal nerve at the fibular head, as described previously (Sundlöf and Wallin, 1977). The nerve signal was amplified (w 50 000), filtered (bandpass, 700–2000 Hz) and fed through a discriminator for further noise reduction and audio-monitoring. A mean voltage (integrated) display was obtained by passing the original signal through a resistance capacitance circuit (time constant, 0.1s). During the experiment, neural activity and arterial pressure were monitored on a storage oscilloscope.
Data analysis
Analog signals of the mean voltage neurogram, ECG and arterial blood pressure were digitized with a sampling frequency of 200 Hz (Data Translation DT2821) and fed into a personal computer. Each analysis period comprised approximately 5 min of rest. In 40 subjects two such periods were examined. Sympathetic bursts were identified by inspection of the mean voltage neurogram, and the amount of activity was expressed as burst frequency (bursts per minute) and burst incidence (bursts per 100 heart beats). After compensation for a baroreflex delay of approximately 1.2–1.4 s, all diastolic pressures were measured and, for each diastole, it was noted whether it was associated with a burst or not (see Sundlöf & Wallin, 1978). As a measure of the strength of the burst, its mean voltage amplitude and surface area were also determined by the computer. Since the absolute strength of a burst depends on its proximity to the recording electrode (a variable which cannot be controlled), the area (amplitude) of the biggest burst in each experimental period was given a value of 100 and the strength of all other bursts was expressed in proportion to this value. As results were similar when the strength of the bursts was expressed as both burst area and burst amplitude, only data based on burst area are presented. The mean values for diastolic pressure and cardiac interval during the 5 min period were calculated by the computer, and the respective standard deviation was used as a measure of the variability of pressure and cardiac interval.
The methods for determining baroreflex threshold and sensitivity were adopted after detailed examination of the consequences and pitfalls with different approaches. The results of this analysis are presented in the Appendix.
To determine the baroreflex pressure threshold, diastolic pressures of individual heart beats were grouped in intervals (classes) of 1 mmHg and for each class, the percentage of diastoles associated with a sympathetic burst was plotted against the mean of the pressure interval (threshold diagram). The threshold (T50) was defined as the diastolic pressure at which 50 % of the diastoles were associated with a burst, and the variability of the threshold was defined as the slope of the regression line (see Sundlöf & Wallin, 1978). Cardiac interval thresholds were determined and defined correspondingly. A class width of 20 ms was used.
Baroreflex sensitivity for blood pressure was evaluated in a linear regression analysis of individual sympathetic burst area vs. the diastolic blood pressure during the cardiac interval corresponding to the burst. The sensitivity was defined as the slope of the regression line. Baroreflex sensitivity for cardiac interval was determined in an analogous way.
Statistics
All data are expressed as means ±s.d. Linear regression analysis was used to characterize thresholds for diastolic pressure and cardiac interval, as well as baroreflex pressure and cardiac interval sensitivities. The reproducibility between different recording periods in the same subject was tested by Student's t test for paired data. All calculations, including significance testing of correlations, partial correlations and slopes of regression lines, were performed with Statistica by StatSoft and Matlab by The MathWorks. P values < 0.05 were considered significant.
RESULTS
Basal data
The mean level of MSA in the whole material was 52 ± 22 bursts (100 heart beats)−1 (range, 15–96 bursts (100 heart beats)−1). When expressed as bursts per minute, corresponding values were 30 ± 13 bursts min−1 (range, 8–59 bursts min−1). Heart rate was 59 ± 9 beats min−1 (range, 40-77 beats min−1). Diastolic finger (Finapres) blood pressure was 70 ± 12 mmHg (range, 49-96 mmHg). The spontaneous variations of diastolic blood pressure for the whole material were normally distributed (Kolmogorov-Smirnov test). The MSA level correlated positively with age, both when expressed as bursts per 100 heart beats (r = 0.71) and bursts per minute (r = 0.67) ( P < 0.01 for both). There was a weak inverse correlation (r = -0.28, P < 0.05) between MSA expressed as bursts per 100 heart beats (but not as bursts per minute) and heart rate, but no correlation between MSA and diastolic blood pressure.
Baroreflex thresholds
Diastolic blood pressure
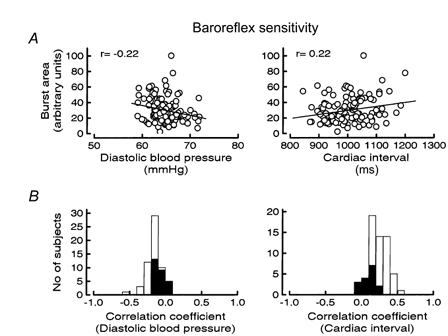
All subjects had significant threshold diagrams and MSA increased by 3.9 ± 1.6 % per millimetre of mercury decrease in diastolic pressure (r = -0.77 ± 0.11, n = 60 subjects). Figure 1A (left) shows an individual threshold diagram and Fig. 1B (left) summarizes correlation coefficients from similar diagrams for all subjects. The T50 was 73 ± 20 mmHg and increased with age (r = 0.59, P < 0.01) and the amount of resting MSA bursts (r = 0.62 for bursts (100 heart beats)−1 and r = 0.65 for bursts min−1; P < 0.01 for both). The slope of the threshold diagram became steeper with increasing age (r = 0.36), burst incidence (r = 0.37) and burst frequency (r = 0.42) (n = 60 subjects, P < 0.01 for all), but there was no difference in slope related to sex. There was no relationship between the slope of the threshold diagram and the variability of diastolic blood pressure.
Figure 1.

A, examples of baroreflex threshold diagrams for diastolic blood pressure (left) and cardiac interval (right). B, distribution of r values for baroreflex threshold diagrams for diastolic blood pressure (left) and cardiac interval (right); n = 60 subjects.
Cardiac interval
All subjects displayed a significant positive correlation between cardiac interval and the percentage of heart beats associated with a burst and MSA increased by 0.22 ± 0.11 % per millisecond increase in cardiac interval (r = 0.77 ± 0.14). Figure 1A (right) shows an individual threshold diagram and Fig. 1B (right) summarizes correlation coefficients from similar diagrams for all subjects. The T50 was 1005 ± 200 ms and was inversely related to burst incidence, burst frequency and age (r = -0.43, -0.78 and -0.43, respectively; n = 60 subjects, P < 0.01 for all). The slope of the regression line was related to neither the number of bursts nor age.
Baroreflex sensitivity
Diastolic blood pressure
Only 33 (55 %) of the 60 subjects had regression lines with a slope that was significantly different from zero. The proportion of significant slopes was similar for men and women (men, 21/38 (55 %); women, 12/22 (55 %)). Also, when the slope was significant, correlations were usually weak (r = -0.21 ± 0.08). Figure 2A (left) shows an example of an individual baroreflex sensitivity diagram for diastolic blood pressure and Fig. 2B (left) summarizes the distribution of r values for all subjects.
Figure 2.
A, examples of baroreflex sensitivity diagrams for diastolic blood pressure (left) and cardiac interval (right). B, distribution of r values for baroreflex sensitivity diagrams for diastolic blood pressure (left) and cardiac interval (right); n = 60 subjects. Filled columns indicate r values for non-significant sensitivity diagrams.
The fraction of significant slopes was higher the higher the burst incidence (r = 0.76, P < 0.01, n = 10 groups) and the result was similar for burst frequency (r = 0.79, P < 0.01, n = 10 groups). However, in subjects with a high number of bursts, the sensitivity diagrams were based on more bursts than those in subjects with low burst incidence. Therefore, to test whether the number of bursts influenced the relative number of diagrams with significant slopes, a partial correlation analysis was made between significance and the number of bursts, keeping the number of bursts constant. The result was a marked decrease in r values and the correlation disappeared (P = 0.49 and 0.65 for burst incidence and burst frequency, respectively).
Cardiac interval
Forty-four of 60 subjects (73 %) had a significant positive correlation between the duration of the cardiac interval and the size of the corresponding burst in the mean voltage neurogram. Figure 2A (right) shows an individual sensitivity diagram and Fig. 2B (right) summarizes the distribution of correlation coefficients for all subjects. The percentage of subjects with significant slopes correlated positively with burst incidence and burst frequency (r = 0.88 for burst incidence and r = 0.84 for burst frequency, P < 0.01 for both, n = 10 groups). As for diastolic pressure diagrams, the correlation disappeared after partial correlation analysis was performed.
Comparison of baroreflex sensitivity for diastolic blood pressure and cardiac interval
Although there were more significant sensitivity diagrams for cardiac interval than for diastolic blood pressure (44 vs. 33; see above), the difference was not statistically significant. If baroreflex sensitivity diagrams for both diastolic blood pressure and cardiac interval were included, 50 of 60 subjects (83 %) had one diagram with a slope that was significantly different from zero. In 27 of 60 subjects (45 %) both diagrams were significant.
Reproducibility
In 40 subjects (27 men, 13 women) two 5 min periods from the same recording were analysed. Diastolic blood pressure, heart rate, sympathetic burst incidence and frequency did not differ significantly between the two periods (Table 1). Figure 3A illustrates the reproducibility for burst incidence. All subjects had significant baroreflex threshold diagrams for diastolic blood pressure and cardiac interval in both periods. The T50 values and the slopes of the regression lines were also similar in the two periods. Figure 3B shows the correlation between the slopes of the diastolic pressure diagrams in the two periods (r = 0.64, P < 0.001.)
Table 1.
Reproducibility between two rest periods
| Period 1 | Period 2 | Significance of difference | |
|---|---|---|---|
| Burst incidence (bursts (100 heart beats)−1) | 52 ± 4 | 55 ± 4 | n.s. |
| Burst frequency (bursts min−1) | 30 ± 2 | 32 ± 2 | n.s. |
| Diastolic BP (mm Hg) | 71 ± 2 | 70 ± 2 | n.s. |
| Heart rate (beats min−1) | 59 ± 1 | 59 ± 1 | n.s. |
| T50 (DBP) (mm Hg) | 78 ± 5 | 76 ± 5 | n.s. |
| T50 (R-R) (ms) | 975 ± 44 | 986 ± 44 | n.s. |
BP, blood pressure; DBP, diastolic BP; R-R, cardiac interval.
Figure 3.
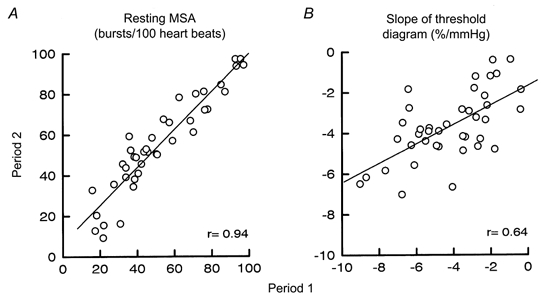
Reproducibility of resting MSA (bursts (100 heart beats)−1; A) and slope of baroreflex threshold diagram for diastolic blood pressure (expressed as % mmHg−1; B) during two 5 min periods from the same recording site. r = 0.94 in A and 0.64 in B (P < 0.001 for both, n = 40 subjects).
In contrast, only 12 subjects (30 %) had significant baroreflex sensitivity diagrams for diastolic blood pressure in both periods, and in those there was no correlation between the slopes of the diagrams from the two periods. With regard to cardiac intervals, 16 subjects (40 %) had significant baroreflex sensitivity diagrams in both periods and in these, the slopes correlated significantly (r = 0.55, P < 0.05).
DISCUSSION
There were two main findings in the present study. (1) In a continuous recording at rest, a reproducible baroreflex threshold for MSA can be defined in all subjects. (2) In contrast, baroreflex sensitivity, i.e. the relationship between transient spontaneous variations of blood pressure (or cardiac interval) and the strength of corresponding bursts of MSA is weak/absent and poorly reproducible. In addition it was found that, unless rigorous methods of calculation are used, data on spontaneous baroreflex influence on MSA may show unacceptable random variability.
Baroreflex characteristics
In agreement with previous studies (Sundlöf & Wallin, 1977, 1978), there were large interindividual differences in the number of MSA bursts, but in a given individual, the number of MSA bursts was reproducible during the whole recording. In addition, the baroreflex threshold and its variations were reproducible both for diastolic blood pressure and for cardiac interval. Thus, the occurrence of bursts and their relationships to diastolic blood pressure/cardiac interval are robust measures of baroreflex function. Although arterial baroreceptors primarily sense the blood pressure-induced distension of the vessel wall, the duration of the cardiac interval per se might also influence the occurrence of sympathetic bursts: the inhibitory effects of baroreceptor discharges will tend to wear off during long diastoles. We found no indication that this factor had significant effects; cardiac interval and diastolic pressure were equally sensitive when determining baroreflex threshold.
In contrast to baroreflex threshold, only 55 % (diastolic blood pressure) and 73 % (cardiac interval) of the subjects had significant baroreflex sensitivity diagrams, and even when significant sensitivity diagrams were present, the correlation coefficients were very low, and reproducibility was poor. This agrees with data from Rudas et al. (1999), who also reported few significant baroreflex sensitivity diagrams for diastolic pressure (5/18 subjects). The conclusion from these findings must be that the strength of a sympathetic burst is only weakly coupled to diastolic blood pressure/cardiac interval. Again there was no significant difference between blood pressure and cardiac interval in this respect.
Since baroreflex threshold is related to whether or not a sympathetic burst occurs and baroreflex sensitivity is related to variations of burst strength, our results imply that different mechanisms regulate the occurrence and strength of sympathetic bursts. At rest, the sympathetic contribution to maintenance of a constant blood pressure level seems to be mainly that of an on-off system: either there is, or there is not, a sympathetic discharge. Apparently, the baroreceptor influence on the strength of the bursts is not strong enough to show up in a consistent way, presumably because other inputs often have more dominating effects. Thus, the close inverse relationship between variations of diastolic blood pressure and MSA, which is so obvious when inspecting the tracings, reflects predominantly the threshold component of baroreflex control of sympathetic traffic.
Another indication of differentiated regulation of occurrence and strength of sympathetic bursts is the relationship to the basal number of bursts. Whereas baroreflex threshold (both the T50 value and the slope) correlated positively with the number of bursts, baroreflex sensitivity did not.
Evidence of differentiated control of occurrence and strength of sympathetic bursts has been reported previously. In humans, an unchanged number of bursts, but increased burst amplitude, was observed during mental stress (Hjemdahl et al. 1989) and recent studies from our laboratory demonstrated differentiated control of MSA burst frequency and relative burst amplitude distribution (Sverrisdottir et al. 2000). Thus, heart failure patients showed increases of both burst frequency and relative amplitudes, whereas in ageing healthy subjects only burst frequency increased while burst amplitude distribution was unchanged. Furthermore, analysis of renal sympathetic activity in the cat using an automated computer algorithm (Malpas & Ninomiya, 1992a) has provided evidence for differential control of burst frequency and burst strength (Malpas & Ninomiya, 1992b). In the rat, heat stimulation of the tail increased, and acute volume loading was found to decrease, renal sympathetic activity solely by changes of burst amplitude while burst frequency remained unchanged (DiBona & Jones, 1998). In conscious Wistar Kyoto rats as well as in conscious spontaneously hypertensive rats, arterial baroreceptor stimulation decreased renal sympathetic activity almost exclusively via decreases in burst amplitude (DiBona et al. 1997).
How the differentiated control of occurrence and strength of sympathetic bursts is brought about is unknown (see McAllen & Malpas, 1997), but the hypothetical model illustrated in Fig. 4 would be a possible mechanism. According to this model the influence from the afferent baroreceptor activity occurs at two CNS locations. At one synapse, the arterial baroreceptor traffic acts together with several other types of afferent inputs (as well as intrinsic nervous activities, e.g. emotionally induced) to cause graded effects. In this way the transmission of sympathetic impulses is modulated according to the strength of the respective input. At another synapse, the afferent impulses from the arterial baroreceptors act as a gate control, i.e. depending on the strength and character of the baroreceptor traffic, the descending sympathetic impulses either can, or cannot, pass the synapse. If present, this kind of differentiated baroreceptor influence may also contribute to explaining differences in the degree of baroreflex effects on different postganglionic sympathetic neurone pools. For example, if descending vasoconstrictor traffic to skin were subjected to graded baroreceptor influence only, this might explain why peroneal skin vasoconstrictor activity displays weak cardiac rhythmicity (Macefield & Wallin, 1999) but, in contrast to vasoconstrictor activity to muscle, no baroreflex threshold behaviour.
Figure 4.
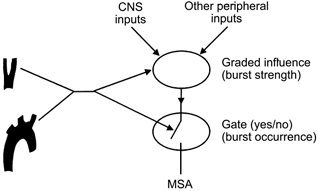
Hypothetical model for arterial baroreceptor influence on MSA at two CNS synapses.
Implications for baroreflex testing
In quantitative tests of arterial baroreflex function using vasoactive drug methodology, the change of nerve traffic is usually expressed as ‘total activity’, i.e. changes in the number of bursts and changes in the strength of the bursts (burst amplitude or burst area in the mean voltage neurogram) are ‘lumped’ together in a single figure. If, as the present results indicate, the occurrence and the strength of the bursts are regulated differentially, the concept of ‘total activity’ may be misleading. As mentioned above, there are several examples from experimental animals of manoeuvres or diseases in which only burst strength changes, and it cannot be excluded that selective changes of burst number may also occur. In terms of ‘total activity’ the result would appear similar, whereas, in reality, different mechanisms may have been affected. As an extreme case, it might be speculated that even opposite changes of the two variables can occur. So far no such data have been reported, but in the study of DiBona & Jones (1998) the heat stimulation of the cat's tail induced an early decrease of burst frequency, which, although not significant, hints that such responses may be possible. Therefore, the present results and previous literature data suggest that evaluation of human baroreflex effects on sympathetic nerve traffic may benefit if occurrence and strength of bursts were treated separately.
When the vasoactive drug methodology is used to determine baroreflex function, it is not uncommon that the correlation between changes of blood pressure and sympathetic traffic is low. Therefore, for the sensitivity diagrams to be useful measures of baroreflex function, we (Sellgren et al. 1994; Carlson et al. 1996) and others (Rudas et al. 1999) have required the correlation coefficient to exceed a certain (arbitrary) level. The low correlation is usually thought to be caused by other (central or reflex) inputs overriding the baroreceptor influence on sympathetic traffic. It cannot be excluded that differential effects on occurrence and strength of the sympathetic bursts may also contribute.
Possible limitation of the present study
The volume-clamp method of recording blood pressure has limitations and, although there are data in support of its usefulness for recording variations of blood pressure (Parati et al. 1989; Imholz et al. 1990), it could be argued that minor deficiencies in accuracy would explain the poor significance of the baroreflex sensitivity diagrams for diastolic pressure. This is unlikely for two reasons. First, if the pressure values were inaccurate, this would influence threshold and sensitivity diagrams equally, and this was not the case. Second, results based on cardiac interval were similar to those based on diastolic blood pressure. Since cardiac interval is easy to measure correctly, deficiencies in measurement accuracy cannot explain why 27 % of the subjects had non-significant baroreflex sensitivity diagrams for cardiac interval.
To summarize, the present study shows evidence in humans of differential baroreflex regulation of occurrence and strength of sympathetic bursts in muscle nerves. While the threshold for sympathetic neurones to discharge is closely related to arterial blood pressure and is highly reproducible, the strength of a burst is only weakly related to arterial baroreceptor input and poorly reproducible. This suggests that the two factors should be examined separately in studies of arterial baroreflex control.
APPENDIX
Evaluation of methods of analysis
Baroreflex thresholds
The blood pressure threshold below which a sympathetic burst occurs is not constant, i.e. heart beats with identical diastolic blood pressures may sometimes be associated with a burst, and sometimes not. To obtain a statistical measure for the baroreflex threshold, diastolic pressures of individual heart beats were grouped in intervals (classes) and, for each class, the percentage of diastoles associated with a sympathetic burst was plotted against the mean of the pressure interval (threshold diagram). However, construction of the diagram requires the selection of (1) the width of the blood pressure (cardiac interval) class, and (2) the starting point for the blood pressure (cardiac interval) class containing the lowest value of blood pressure (cardiac interval) (e.g. if the lowest blood pressure value was 70.6 mmHg, should the class start at 70.0, 70.5 or 70.6 mmHg?). Since the choices are arbitrary, we tested the effects on the baroreflex thresholds of varying class width and class position in steps of 0.05 mmHg from 0.5 to 3 mmHg.
The results showed that minor variations of class width or class position could lead to marked changes of both the slope of the threshold diagrams and the T50 value. This was because, numerically, data points from classes containing few heart beats often changed markedly if an alteration of class width or position led to addition/ elimination of one or a few heart beats in the class. The problem could not be solved by excluding data points based on few heart beats since consistent exclusion criteria could not be defined that were applicable in all subjects. Therefore, no data were eliminated, but to minimize the variations a statistical weighting procedure was adopted. To this end, when calculating the regression line, each data point was entered once for each heart beat in the class. For example, if in a class containing 50 heart beats 10 % of the beats were associated with a burst, the value 10 was entered 50 times. With this procedure the characteristics of the threshold diagram became fairly stable regardless of the width of the blood pressure class. Figure 5A illustrates the effects of varying class width on the slope of the threshold diagram without (left) and with (right) weighting in a single subject. For the whole group the range of variation of the slopes was reduced from 4.1 ± 2.5 % mmHg−1 without weighting to 1.4 ± 0.7 % mmHg−1 with weighting. The effects of varying class position were similar.
Figure 5.
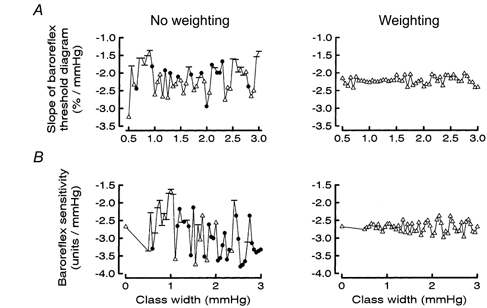
Effects of the statistical weighting procedure on slopes (and statistical significance) of baroreflex pressure threshold (A) and sensitivity (B) diagrams at different widths of the blood pressure classes. P values for significance of slope being different from zero: -, P > 0.05; •, P < 0.05; ▵, P < 0.01. Note that weighting reduces the large variability.
Baroreflex sensitivity
Two ways of constructing baroreflex sensitivity diagrams were tested. One approach, used previously (Sundlöf & Wallin, 1978; Wallin & Sundlöf, 1979; Nakazato et al. 1998), was to group the diastolic pressures of all heart beats associated with a burst in intervals (classes), plot the mean pressure of each class against the mean area of all bursts in the class, and then calculate the regression line (class diagram). The other method was to plot the surface area of each individual sympathetic burst against the diastolic blood pressure of the corresponding heart beat and then calculate the regression line (individual burst diagram).
When class diagrams were used the effects on baroreflex sensitivity of varying class width and class position were analogous to those obtained for thresholds: minor variations of the values could have marked effects on the slopes of the sensitivity diagrams. Also the result of the statistical analysis of the diagrams varied markedly: in a given subject the probability that the slope of the regression line was different from zero could change from < 0.01 to > 0.05 by minor changes of class width (Fig. 5B, left). Again, the variability was reduced by adopting the statistical weighting procedure without data elimination described above (Fig. 5B, right). With the weighting procedure the slopes of the regression lines of the class diagrams became almost identical to those obtained with the individual burst diagrams. Figure 6A illustrates the two types of baroreflex sensitivity diagrams from one subject, and Fig. 6B summarizes the relationship between the slopes of the two types of diagram for all subjects (class width, 1 mmHg). When cardiac interval sensitivity was determined by the class method (class width, 20 ms) the results were analogous.
Figure 6.
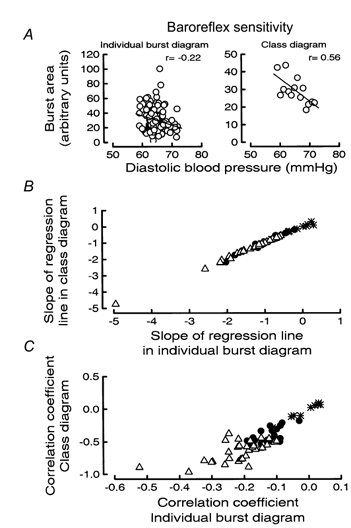
A, examples of baroreflex sensitivity diagrams for diastolic blood pressure based on individual bursts (left) and class diagram (right). B and C, comparison of baroreflex sensitivity data for diastolic blood pressure from all 60 subjects obtained with different methods of calculation. Slopes (B) and r values (C) from individual burst diagrams on the abscissa and from class diagrams on the ordinate. Significant slopes in B and significant correlations in C (P < 0.05) in both class and individual burst diagrams indicated by ▵; in only class diagram by •; and in neither diagram by *.
However, the weighting procedure also had another effect: the correlation coefficients of the sensitivity diagrams became on average almost three times higher with, than without, weighting (a consequence of the variability reduction brought about by repeated use of the mean value of burst area in each class, rather than the true individual values of burst area). This, in turn led to an (artefactual) increase in the number of subjects with significant sensitivity diagrams (Fig. 6C). To avoid such effects, we decided to use only baroreflex sensitivity data based on individual burst diagrams. It should be emphasized, however, that if the class method was used, the results were qualitatively similar to those described above, i.e. significant baroreflex sensitivities were not obtained in all subjects and the reproducibility was poor.
Acknowledgments
We thank Göran Pegenius for excellent technical assistance. This work was supported by Swedish Medical Research Council grant no. 3546. Dr Kienbaum was supported by a grant from the Deutsche Forschungsgemeinschaft (DFG Ki 629/1.1).
References
- Carlson JT, Hedner JA, Sellgren J, Elam M, Wallin BG. Depressed baroreflex sensitivity in patients with obstructive sleep apnea. American Journal of Respiratory and Critical Care Medicine. 1996;154:1490–1496. doi: 10.1164/ajrccm.154.5.8912770. [DOI] [PubMed] [Google Scholar]
- Delius W, Hagbarth K-E, Hongell A, Wallin BG. General characteristics of sympathetic activity in human muscle nerves. Acta Physiologica Scandinavica. 1972;84:65–81. doi: 10.1111/j.1748-1716.1972.tb05158.x. [DOI] [PubMed] [Google Scholar]
- DiBona GF, Jones SY. Reflex effects on components of synchronized renal sympathetic nerve activity. American Journal of Physiology. 1998;F275:441–446. doi: 10.1152/ajprenal.1998.275.3.F441. [DOI] [PubMed] [Google Scholar]
- DiBona GF, Jones SY, Sawin LL. Reflex effects on renal nerve activity characteristics in spontaneously hypertensive rats. Hypertension. 1997;30:1089–1096. doi: 10.1161/01.hyp.30.5.1089. [DOI] [PubMed] [Google Scholar]
- Ebert TJ, Morgan BJ, Barney JA, Denahan T, Smith JJ. Effects of aging on baroreflex regulation of sympathetic activity in humans. American Journal of Physiology. 1992;263:H798–803. doi: 10.1152/ajpheart.1992.263.3.H798. [DOI] [PubMed] [Google Scholar]
- Fagius J, Wallin BG. Long-term variability and reproducibility of resting human muscle nerve sympathetic activity at rest, as reassessed after a decade. Clinical Autonomic Research. 1993;3:201–205. doi: 10.1007/BF01826234. [DOI] [PubMed] [Google Scholar]
- Ferguson DW, Berg WJ, Roach PJ, Oren RM, Mark AL. Effects of heart failure on baroreflex control of sympathetic neural activity. American Journal of Cardiology. 1992;69:523–531. doi: 10.1016/0002-9149(92)90998-e. [DOI] [PubMed] [Google Scholar]
- Grassi G, Seravalle G, Cattaneo BB, Lanfranchi A, Vailati S, Giannattasio C, Del Bo A, Sala C, Bolla GB, Pozzi M. Sympathetic activation and loss of reflex sympathetic control in mild congestive heart failure. Circulation. 1995;92:3206–3211. doi: 10.1161/01.cir.92.11.3206. [DOI] [PubMed] [Google Scholar]
- Halliwill JR, Taylor JA, Eckberg DL. Impaired sympathetic vascular regulation in humans after acute dynamic exercise. Journal of Physiology. 1996;495:279–288. doi: 10.1113/jphysiol.1996.sp021592. [DOI] [PMC free article] [PubMed] [Google Scholar]
- Hjemdahl P, Fagius J, Freyschuss U, Wallin BG, Daleskog M, Bohlin G, Perski A. Muscle sympathetic activity and norepinephrine release during mental challenge in humans. American Journal of Physiology. 1989;257:E654–664. doi: 10.1152/ajpendo.1989.257.5.E654. [DOI] [PubMed] [Google Scholar]
- Imholz BPM, Settels JJ, Van Der Meiracker AH, Wesseling KH, Wieling W. Non-invasive continuous finger blood pressure measurement during orthostatic stress compared to intra-arterial pressure. Cardiovascular Research. 1990;24:214–221. doi: 10.1093/cvr/24.3.214. [DOI] [PubMed] [Google Scholar]
- McAllen RM, Malpas SC. Sympathetic burst activity: Characteristics and significance. Clinical and Experimental Pharmacology and Physiology. 1997;24:791–799. doi: 10.1111/j.1440-1681.1997.tb02693.x. [DOI] [PubMed] [Google Scholar]
- Macefield VG, Wallin BG. Respiratory and cardiac modulation of single sympathetic vasoconstrictor and sudomotor neurones to human skin. Journal of Physiology. 1999;516:303–314. doi: 10.1111/j.1469-7793.1999.303aa.x. [DOI] [PMC free article] [PubMed] [Google Scholar]
- Malpas SC, Ninomiya I. A new approach to analysis of synchronized sympathetic nerve activity. American Journal of Physiology. 1992a;263:H1311–1317. doi: 10.1152/ajpheart.1992.263.4.H1311. [DOI] [PubMed] [Google Scholar]
- Malpas SC, Ninomiya I. Effect of chemoreceptor stimulation on the periodicity of renal sympathetic nerve activity in anesthetized cats. Journal of the Autonomic Nervous System. 1992b;37:19–28. doi: 10.1016/0165-1838(92)90141-3. [DOI] [PubMed] [Google Scholar]
- Matsukawa T, Sugiyama Y, Mano T. Age-related changes in baroreflex control of heart rate and sympathetic nerve activity in healthy humans. Journal of the Autonomic Nervous System. 1996;60:209–212. doi: 10.1016/0165-1838(96)00057-4. [DOI] [PubMed] [Google Scholar]
- Meyrelles SS, Tinucci T, Hollanda HE, Mion D., Jr Baroreflex control of muscle sympathetic nerve activity in mild hypertension. American Journal of Hypertension. 1997;10:162–167. doi: 10.1016/s0895-7061(96)00353-6. [DOI] [PubMed] [Google Scholar]
- Muzi M, Ebert TJ. A comparison of baroreflex sensitivity during isoflurane and desflurane anesthesia in humans. Anesthesiology. 1995;82:919–925. doi: 10.1097/00000542-199504000-00015. [DOI] [PubMed] [Google Scholar]
- Nakazato T, Shikama T, Toma S, Nakajima Y, Masuda Y. Nocturnal variation in human sympathetic baroreflex sensitivity. Journal of the Autonomic Nervous System. 1998;70:32–37. doi: 10.1016/s0165-1838(98)00024-1. [DOI] [PubMed] [Google Scholar]
- Parati G, Casadei R, Groppelli A, Di Rienzo M, Mancia G. Comparison of finger and intra-arterial blood pressure monitoring at rest and during laboratory testing. Hypertension. 1989;13:647–655. doi: 10.1161/01.hyp.13.6.647. [DOI] [PubMed] [Google Scholar]
- Rudas L, Crossman AA, Morillo CA, Halliwill JR, Tahvanainen KUO, Kuusela TA, Eckberg DL. Human sympathetic and vagal baroreflex responses to sequential nitroprusside and phenylephrine. American Journal of Physiology. 1999;276:H1691–1698. doi: 10.1152/ajpheart.1999.276.5.h1691. [DOI] [PubMed] [Google Scholar]
- Sellgren J, Ejnell H, Elam M, Pontén J, Wallin BG. Sympathetic muscle nerve activity, peripheral blood flows, and baroreceptor reflexes in humans during propofol anesthesia and surgery. Anesthesiology. 1994;80:534–544. doi: 10.1097/00000542-199403000-00009. [DOI] [PubMed] [Google Scholar]
- Sundlöf G, Wallin BG. The variability of muscle nerve sympathetic activity in resting recumbent man. Journal of Physiology. 1977;272:383–397. doi: 10.1113/jphysiol.1977.sp012050. [DOI] [PMC free article] [PubMed] [Google Scholar]
- Sundlöf G, Wallin BG. Human muscle nerve sympathetic activity at rest. Relationship to blood pressure and age. Journal of Physiology. 1978;274:621–637. doi: 10.1113/jphysiol.1978.sp012170. [DOI] [PMC free article] [PubMed] [Google Scholar]
- Sverrisdottir YB, Rundqvist B, Johannsson G, Elam M. Sympathetic neural burst amplitude distribution: a more specific indicator of sympatho-excitation in human heart failure. Circulation. 2000;102:2067–2081. doi: 10.1161/01.cir.102.17.2076. [DOI] [PubMed] [Google Scholar]
- Wallin BG, Eckberg DL. Sympathetic transients caused by abrupt alterations of carotid baroreceptor activity in man. American Journal of Physiology. 1982;242:H185–190. doi: 10.1152/ajpheart.1982.242.2.H185. [DOI] [PubMed] [Google Scholar]
- Wallin BG, Sundlöf G. A quantitative study of muscle nerve sympathetic activity in resting normotensive and hypertensive subjects. Hypertension. 1979;1:67–77. doi: 10.1161/01.hyp.1.2.67. [DOI] [PubMed] [Google Scholar]
- Wallin BG, Sundlöf G, Delius W. The effect of carotid sinus nerve stimulation on muscle and skin nerve sympathetic activity in man. Pflügers Archiv. 1975;358:101–110. doi: 10.1007/BF00583921. [DOI] [PubMed] [Google Scholar]