

Abstract
The mechanism of thyrotropin-releasing hormone (TRH)-induced ether-à-go-go-related gene (erg) K+ current modulation was investigated with the perforated-patch whole-cell technique in clonal somatomammotroph GH3/B6 cells. These cells express a small endogenous erg current known to be reduced by TRH. GH3/B6 cells were injected with cDNA coding for rat erg1, erg2, erg3 and HERG K+ channels. The corresponding erg currents were isolated with the help of the specific erg channel blockers E-4031 and dofetilide and their biophysical properties were determined.
TRH (1 μm) was able to significantly reduce the different erg currents. The voltage dependence of activation was shifted by 15 mV (erg1), 10 mV (erg2) and 6 mV (erg3) to more positive potentials without strongly affecting erg inactivation. TRH reduced the maximal available erg current amplitude by 12 % (erg1), 13 % (erg2) and 39 % (erg3) and accelerated the time course of erg1 and erg2 channel deactivation, whereas erg3 deactivation kinetics were not significantly altered. The effects of TRH on HERG currents did not differ from those on its rat homologue erg1. In addition, coinjection of rat MiRP1 with HERG cDNA did not influence the TRH-induced modulation of HERG channels.
Rat erg1 currents recorded in the cell-attached configuration were reduced by application of TRH to the extra-patch membrane in the majority of the experiments, confirming the involvement of a diffusible second messenger.
Application of the phorbol ester phorbol 12-myristate 13-acetate (PMA; 1 μm) shifted the voltage dependence of erg1 activation in the depolarizing direction, but it did not reduce the maximal current amplitude. The voltage shift could not be explained by a selective effect on protein kinase C (PKC) since the PKC inhibitor bisindolylmaleimide I did not block the effects of TRH and PMA on erg1. In addition, cholecystokinin, known to activate the phosphoinositol pathway similarly to TRH, did not significantly affect the erg1 current.
Various agents interfering with different known TRH-elicited cellular responses were not able to completely mimic or inhibit the TRH effects on erg1. Tested substances included modulators of the cAMP-protein kinase A pathway, arachidonic acid, inhibitors of tyrosine kinase and mitogen-activated protein kinase, sodium nitroprusside and cytochalasin D.
The results demonstrate that all three members of the erg channel subfamily are modulated by TRH in GH3/B6 cells. In agreement with previous studies on the TRH-induced modulation of the endogenous erg current in prolactin-secreting anterior pituitary cells, the TRH effects on overexpressed erg1 channels are not mediated by any of the tested signalling pathways.
Native ether-à-go-go-related gene (erg) K+ currents were first described in sinoatrial node cells as delayed rectifier K+ current. This current exhibited clear inward rectification in the ‘fully activated’ current-voltage relationship (DiFrancesco et al. 1979) and this property was explained by a channel model with two independent gates: a fast inactivation gate and a slow activation gate (Shibasaki, 1987). The identification and cloning of HERG as the human molecular correlate of the rapidly activating component (IKr) of the delayed rectifier current (Warmke & Ganetzky, 1994; Sanguinetti et al. 1995; Trudeau et al. 1995) allowed a detailed biophysical analysis on the basis of the heterologously expressed HERG channels. These experiments confirmed the anomalous gating properties described by Shibasaki (1987) which result in the observed functional inward rectification of erg currents (Spector et al. 1996; Wang et al. 1997).
In the prolactin and growth hormone secreting pituitary tumour cell line GH3/B6, the endogenous erg current was initially described as an inactivating inwardly rectifying K+ current (IK,IR; Bauer et al. 1990). Corresponding inwardly rectifying K+ currents have also been found in native lactotroph cells (Corrette et al. 1996). When these currents were identified as erg currents (Barros et al. 1997; Bauer et al. 1998; Schäfer et al. 1999), their physiological role could be demonstrated by the use of specific erg channel blockers from the class of methanesulfonanilides (Colatsky & Argentieri, 1994). As previously suggested, the erg current in lactotroph cells and GH3/B6 cells was found to contribute to the maintenance of the resting membrane potential and to influence the onset and frequency of Ca2+ action potential firing (Weinsberg et al. 1997; Bauer, 1998; Bauer et al. 1999). The electrical activity is important for the control of prolactin secretion since it determines the level of intracellular free Ca2+ concentration. The main hypothalamic prolactin-releasing factor is thyrotropin-releasing hormone (TRH), and the TRH-induced reduction in IK,IR was the first example of a physiologically important erg current modulation (Bauer et al. 1990). In GH3/B6 cells, TRH induces biphasic changes in the electrical activity and the intracellular free Ca2+ concentration. TRH acts via activation of a G-protein of the Gq/11 family, resulting in phospholipase C (PLC) activation and the generation of myo-inositol 1,4,5-trisphosphate (IP3) and diacylglycerol (DG) from phosphatidylinositol 4,5-bisphosphate (PIP2). The IP3-induced release of Ca2+ from intracellular pools comprises the first phase of the TRH response which is electrophysiologically characterized by a transient hyperpolarization due to the opening of Ca2+-dependent K+ channels (for reviews, see Ozawa & Sand, 1986; Corrette et al. 1995). The second phase involves an increase in the electrical activity leading to increased Ca2+ influx through voltage-dependent Ca2+ channels and this effect is at least in part mediated by the TRH-induced reduction in the erg current. Activation of protein kinase C (PKC) by DG has often been proposed to underlie the second phase of the TRH response (reviewed in Ozawa & Sand, 1986). Nevertheless, all previous results suggest that the TRH-induced reduction in the endogenous erg current IK,IR does not depend on PKC or protein kinase A (PKA) activation (Bauer et al. 1990, 1994; Barros et al. 1992, 1993; Schäfer et al. 1999).
Recently, the modulation of heterologously expressed HERG channels by PKC (Barros et al. 1998) and PKA (Thomas et al. 1999) has been reported. Although the results obtained using Xenopus oocytes as the expression system are comparable to the TRH effects, they cannot explain the physiological mechanism of erg current modulation in lactotroph cells. Moreover, the endogenous erg current IKr in ventricular myocytes has even been found to be enhanced by PKC (Heath & Terrar, 2000). These differing results demonstrate the necessity of analysing a given signal cascade in the native physiological system.
Indirect evidence that a phosphorylation step is also involved in the TRH effect on the endogenous erg current in GH3 cells was obtained by the demonstration that phosphatase inhibitors prevent, and phosphatase 2A partially restores, the reversibility of the TRH-induced modulation of erg currents (Barros et al. 1993). In addition, as well as a minimal concentration of intracellular free Ca2+ ions (Bauer et al. 1990), ATP is required for the occurrence of the TRH effect (Barros et al. 1993). Beside the effects associated with the well-established first phase of the TRH response in lactotroph cells, several additional TRH effects on intracellular signal pathways have been described in these cells (reviewed in Corrette et al. 1995). So far, the relatively small amplitude of the erg currents, even in high external K+ solution, has impeded the analysis of the signal cascade mediating the TRH-induced modulation of the erg current. In the present study we investigated the TRH modulation of erg channels overexpressed in GH3/B6 cells. This new approach combines the advantage of huge erg currents, easily distinguishable from other endogenous currents, with the advantage of the physiologically relevant signal cascade. GH3/B6 cells express mRNA for erg1 and erg2 (Wulfsen et al. 2000), and rat lactotrophs have been found to express mRNA for all three erg channels in different combinations (Schäfer et al. 1999). It is also possible that heteromultimeric erg channels exist, since it has recently been shown that the three erg channel subunits are able to form heteromultimeric channels within their subfamily (Wimmers et al. 2001). These findings suggest that the endogenous erg currents in these cells are mediated by different erg channels. Therefore, we studied the effect of TRH on all three cloned rat erg channels in GH3/B6 cells. Since the rat erg1 protein is not completely identical to its human counterpart HERG (Bauer et al. 1998), an analysis of the TRH-induced modulation of HERG channels was also performed. The present experiments provide a detailed analysis of the TRH-induced effects on the three erg channels and describe the effects of a variety of signal cascade modulators on the erg1 current and its response to TRH.
Part of this work has been published in abstract form (Schledermann et al. 1999).
METHODS
Cell culture
Clonal rat anterior pituitary (GH3/B6) cells (kindly provided by Dr A. Tixier-Vidal, Collège de France, Paris, France) were cultured in Ham's F10 medium (Sigma, Deisenhofen, Germany) supplemented with 15 % horse serum (Gibco, Karlsruhe, Germany), 2.5 % fetal calf serum (Biother, Kelkheim, Germany) and 0.5 %l-glutamine (Sigma). Culture medium was changed every 2-3 days. The cells were grown at 37°C in an atmosphere of 95 % air and 5 % CO2 and passaged every 5-7 days. For cDNA injection, GH3/B6 cells were cultured on poly-d-lysine (Sigma)-coated CELLocate glass plates (Eppendorf, Hamburg, Germany). The plates were kept in 35 mm plastic culture dishes (Nunc, Rochester, USA) and cells were used for up to 1 week after passaging.
Heterologous expression
One day or at least 6 h prior to the electrophysiological measurements, GH3/B6 cells were injected (Eppendorf Transjector 5246) with cDNA coding for rat erg1 (Bauer et al. 1998), erg2, erg3 (Shi et al. 1997) or HERG (Warmke & Ganetzky, 1994). In some experiments, HERG cDNA was coinjected with rat MiRP1 cDNA (Abbott et al. 1999) in a ratio of 1:3. EGFP-N1 (Clontech, Heidelberg, Germany) was always coinjected to allow the detection of expressing cells by their fluorescence. All cDNAs were subcloned in pcDNA3 (Invitrogen, Groningen, Netherlands). Plasmids encoding rat erg2 and erg3 were kindly provided by Dr J. Dixon (State University of New York, Stony Brook, NY, USA), and the plasmid containing HERG was given by Dr O. Pongs (ZMNH, University of Hamburg, Hamburg, Germany). Using PCR, MiRP1 was cloned in our laboratory by S. Wimmers.
Solutions
The standard external 5 mm K+ solution contained (mm): 5 KCl, 135 NaCl, 4 MgCl2, 1 CaCl2, 10 glucose, 10 Hepes, 2.5 EGTA, 0.2 NiCl2 (EQCAL: 75 nm free Ca2+, Biosoft, Cambridge, UK); pH was adjusted to 7.3 with NaOH. The isotonic KCl solution used as external and pipette solution in the cell-attached experiments contained (mm): 140 KCl, 4 MgCl2, 1 CaCl2, 2.5 EGTA, 10 Hepes, 10 glucose (75 nm free Ca2+, EQCAL); pH was adjusted to 7.3 with KOH. Tetrodotoxin (TTX, 500 nm) was added to both external solutions.
The standard pipette solution contained (mm): 140 KCl, 2 MgCl2, 1 CaCl2, 2.5 EGTA, 10 Hepes (EQCAL: 66 nm free Ca2+); pH was adjusted to 7.3 with KOH. Nystatin was dissolved in DMSO. Its final concentration in the standard pipette solution was 0.5 mg ml−1.
Chemicals
The following chemicals were used, with final concentrations of the test substances in the bath given in parentheses. Mastoparan (5 μm), cytochalasin D (5 μm), sulfated cholecystokinin octapeptide (CCK-8s, 1 μm), thyrotropin-releasing hormone (TRH, 1 μm) and nystatin were purchased from Sigma. Arachidonic acid (10 μm), H-89 (1 or 5 μm), tyrphostin A23 (100 μm), PD 98059 (10 μm), forskolin (100 μm), 1,9-dideoxy-forskolin (< 100 μm, due to its low solubility in aqueous solution), bisindolylmaleimide I (1 μm), phorbol 12-myristate 13-acetate (PMA, 1 μm), l-α-phosphatidyl-d-myo-inositol-4,5-bisphosphate (PIP2, 5 μm), vasoactive intestinal peptide (VIP, 1 μm), sodium nitroprusside (SNP, 1 mm) and TTX were purchased from Calbiochem (Bad Soden, Germany). The selective erg channel blockers E-4031 (10 μm) and dofetilide (10 μm) were generous gifts from Eisai, Tokyo, Japan, and from Pfizer, Sandwich, UK, respectively.
PMA, bisindolylmaleimide I, forskolin, 1,9-dideoxy-forskolin, H-89, arachidonic acid, PD 98059, cytochalasin D and tyrphostin A23 were dissolved in DMSO. The final DMSO concentrations never exceeded 0.1 %. All other substances were dissolved in water. Final dilutions were made with external solution. PIP2 was added to the standard pipette solution and used in conventional whole-cell experiments. This solution was sonicated for 2 min just prior to use.
Electrophysiology and evaluation
In nystatin-perforated-patch experiments (Horn & Marty, 1988), recording of whole-cell membrane currents was started when the series resistance settled between 8 and 30 MΩ. Series resistance errors were compensated as high as possible (> 60 %). When filled with intracellular solution, the pipette resistance varied between 2 and 5 MΩ. Fast and slow capacitances were compensated prior to the applied test pulse sequences. In the cell-attached experiments pipettes were used with resistances between 1 and 3 MΩ.
The erg currents were isolated from other currents as difference currents before and after selective pharmacological block. The data shown have not been corrected for the liquid junction potential (4.3 mV for the standard external 5 mm K+ solution) because an additional undefined potential error corresponding to the Donnan potential was present in the perforated-patch whole-cell experiments. Since this voltage error could amount to about 10 mV, the membrane potential might have been 14 mV more negative than the pipette potential in these experiments. All experiments were carried out at room temperature.
Stimulation, data acquisition and analysis were carried out using the Pulse/PulseFit 8.11 software in combination with an EPC-9 patch-clamp amplifier (HEKA, Lambrecht, Germany). Further data processing was performed with Excel (Microsoft, USA) and Sigma Plot (SPSS Inc., Chicago, USA). Significance was tested by Student's paired t test and errors indicate s.e.m.
RESULTS
General description of expressed erg currents and the TRH response
Membrane currents of control GH3/B6 cells and cells previously injected with cDNA coding for erg K+ channels were recorded with the nystatin-perforated-patch technique. In order to determine the functional expression of erg channels, the stability of the recorded erg currents and their reduction by TRH, a standard test pulse sequence (Fig. 1A) was regularly applied from a holding potential of -30 mV to ensure that at least some of the erg channels were already in the activated state. The pulse sequence allowed us to measure outward erg current at physiological potentials as well as inward erg current without substantial current deactivation. The standard external 5 mm K+ solution had a low Ca2+ concentration and contained 200 μm Ni2+ to reduce Ca2+ currents and Ca2+-dependent K+ currents. Previously, this solution was used to study the endogenous erg current of GH3/B6 cells using polynuclear giant cells (Bauer, 1998). Nevertheless, in normal sized non-injected GH3/B6 cells or in cells only injected with cDNA coding for EGFP, the endogenous erg current was not apparent without the help of specific erg channel blockers (Fig. 1B). Successfully expressing cells identified by their EGFP fluorescence were recorded 6 h to 1 day after cDNA injection. In most of these cells, characteristic erg currents were recorded with the test pulse sequence, clearly distinguishable from the endogenous membrane currents (Fig. 1, insets). The functional expression of rat erg1 and HERG channels was considerably higher than that of rat erg2 and erg3 channels despite the use of identical expression systems.
Figure 1. Reduction of rat erg1, erg2, erg3 and HERG currents by TRH.
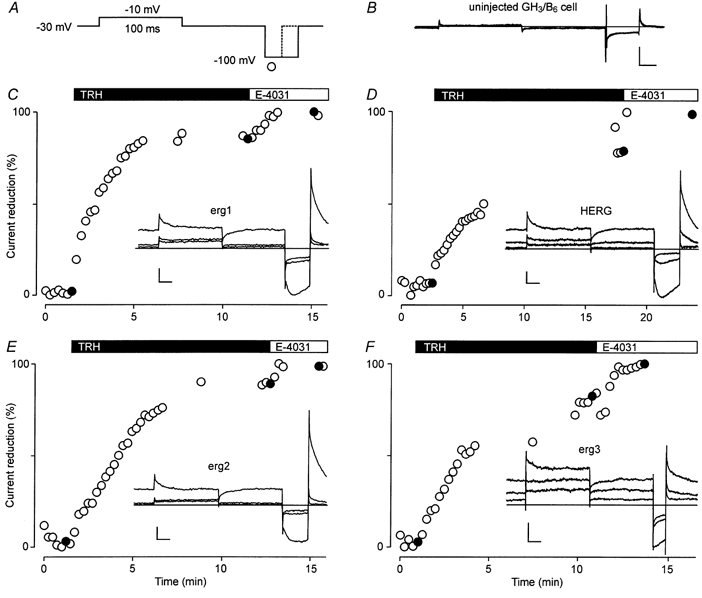
Membrane currents were recorded in standard external 5 mm K+ solution in uninjected GH3/B6 cells (B) and in GH3/B6 cells previously injected with erg cDNA (insets in C-F) before and after application of 1 μm TRH and 10 μm E-4031. A, the standard test pulse sequence consisted of a 100 ms depolarizing pulse to -10 mV and a 40 ms hyperpolarizing pulse to -100 mV after a return to the holding potential of -30 mV for 100 ms. A shorter (20 ms) hyperpolarization was used for erg3 currents (F) to avoid substantial deactivation. C-F, time course of relative erg current reduction by TRH and E-4031 obtained from the maximal current amplitude during the hyperpolarization to -100 mV. Isolated erg currents were obtained by subtraction of the E-4031-insensitive currents from the recorded current traces. Filled circles correspond to the current traces shown in the insets. Vertical and horizontal scale bars denote 100 pA and 20 ms, respectively.
In every cell tested, TRH induced a clear reduction in the outward and inward erg currents, independently of which erg channel was expressed (Fig. 1). Even in the case of high expression levels, the TRH-induced reduction in the erg currents was almost complete within 3-5 min. This time course was comparable to that described for the TRH response of the endogenous erg current in GH3/B6 cells (Bauer et al. 1990) and rat lactotrophs (Corrette et al. 1996; Schäfer et al. 1999). In the present experiments, TRH was permanently applied to the bath and no indications of a reversibility of the erg current reduction were observed within the time course of an experiment (up to 2 h). Nevertheless, we found that if TRH was once applied in a cell culture dish, no subsequent TRH response could be elicited in GH3/B6 cells overexpressing rat erg1 channels, even after several washes. In contrast, the TRH-induced reduction in the endogenous erg current lacks the reversibility only in standard whole-cell recordings, but not in perforated-patch experiments (Barros et al. 1993). An extremely slow time course of reversibility of the TRH-induced modulation of the overexpressed erg channels could be explained by an imbalance of the number of expressed erg channels and the amount of the cytosolic substance needed to reverse the TRH effect.
To analyse the biophysical basis of the TRH-induced erg current reduction, different pulse protocols were applied before and after TRH application. The time course of the TRH response was always traced with the standard test pulse sequence.
TRH effects on erg channel availability
To determine the ‘fully activated’ current-voltage relationship (see e.g. Spector et al. 1996) of the different erg channels, test pulses of 5 s duration to potentials between 50 and -120 mV were applied from a holding potential of -20 mV. A depolarizing prepulse was introduced into the pulse protocol to fully activate the erg channels. For erg2 experiments, a more depolarized prepulse potential was used than for erg1 and erg3 experiments because erg2 channels activate at more positive potentials than erg2 or erg3 channels (Shi et al. 1997, and see below). Similar pulse protocols starting from a relatively positive holding potential have been used to detect and describe the endogenous erg current in GH3/B6 cells (Bauer et al. 1990; Bauer, 1998) and rat lactotrophs (Schäfer et al. 1999). The different erg currents were obtained by subtraction of the E-4031-insensitive currents obtained at the end of the experiments from the current traces recorded before the application of 10 μm E-4031. The isolated erg currents reversed close to -80 mV (Fig. 2A). A comparison of the normalized peak amplitudes of the control currents shows that the inward rectification of rat erg3 was less pronounced than that of erg1 and erg2 (Fig. 2B). To investigate the voltage dependence of erg channel availability, the maximal current was determined which could be recovered by a hyperpolarizing pulse following the variable 5 s test pulses (Fig. 2C). After test pulses to potentials between 50 mV and about -30 mV, the tail current amplitudes were almost maximal for all three erg channels. At test pulse potentials to -40 mV or to more negative potentials, the erg currents clearly exhibited time- and voltage-dependent deactivation resulting in reduced current amplitudes upon the hyperpolarizing pulse to -100 mV. Deactivation of erg1, erg2 and erg3 currents was almost complete at the end of 5 s test pulses to -70, -80 and -60 mV, respectively. The dependence of the normalized amplitudes of the maximal available tail currents on the preceding test pulse potential could be well described with single Boltzmann functions. The inflection potential of the Boltzmann functions describing the half-maximal availability of the erg control currents was -44.6 ± 1.1 mV (n = 10) for erg1, -50.7 ± 1.3 mV (n = 6) for erg2, and -44.1 ± 0.8 mV (n = 4) for erg3. The experiments yielded a steeper voltage dependence for erg3 (5.7 ± 1.4 mV) than for erg1 (7.2 ± 0.6 mV) and erg2 (8.1 ± 0.8 mV).
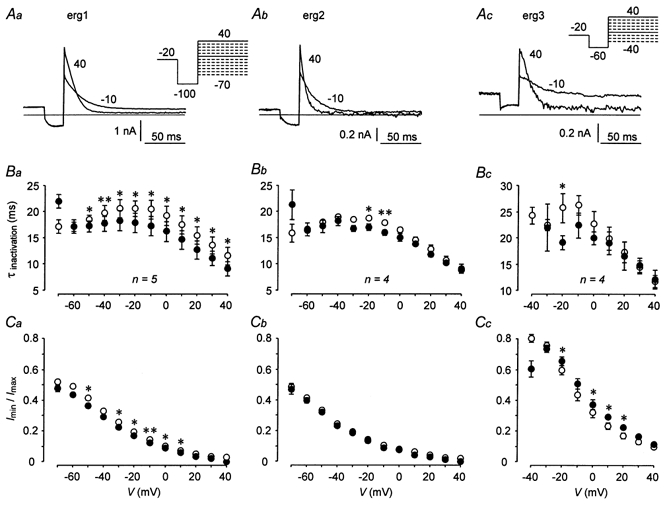
Figure 2. TRH shifts the potential dependence of erg current availability to more positive potentials.
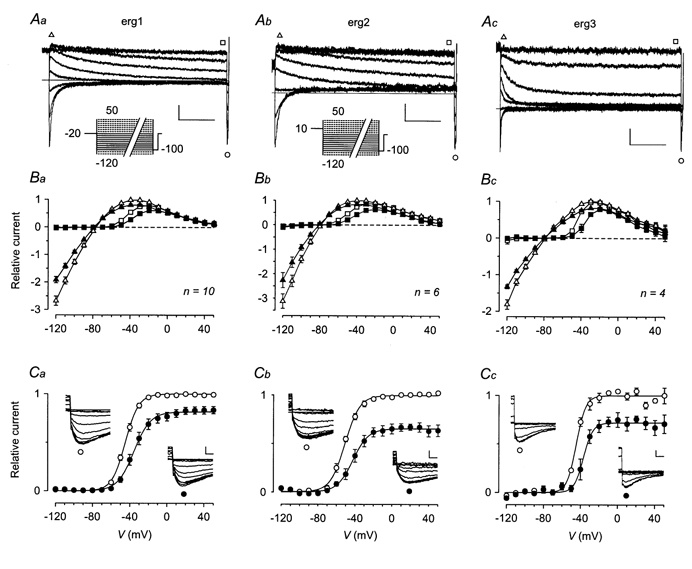
A, erg currents elicited in GH3/B6 cells previously injected with cDNA coding for rat erg1 (a), erg2 (b) and erg3 (c). The pulse protocol consisted of variable 5 s test pulses between 50 and -120 mV in steps of 10 mV from a holding potential of -20 mV. With a gap of 500 ms at -20 mV (for erg1 and erg3) or 10 mV (for erg2), a 2 s depolarizing prepulse to 20 mV (for erg1 and erg3) or 50 mV (for erg2) preceded the test pulses to activate the erg channels. For clarity, only current traces recorded with test pulses to potentials between -20 and -100 mV are shown. Continuous lines in the pulse protocols correspond to the selected current traces. The erg currents were isolated by subtraction of the E-4031-insensitive currents obtained after application of 10 μm E-4031 at the end of the experiments. B, I-V plots of the maximal erg current amplitudes (triangles) and the current amplitudes at the end of the 5 s test pulses (squares) before (open symbols) and after (filled symbols) TRH application. For potentials > -20 mV, erg current amplitudes were measured after inactivation had taken place. Data are means ±s.e.m. of erg current amplitudes normalized to the respective maximal outward current amplitude. C, plots of the maximal erg current amplitude elicited with the constant hyperpolarizing pulse to -100 mV against the preceding test pulse potential. Mean relative current amplitudes (means ±s.e.m.) obtained from the same experiments as shown in B are given before (○) and after (•) TRH application and the continuous lines represent Boltzmann functions fitted to the data points. Values for the inflection potential and steepness are, respectively: for erg1, -44.8 mV and 7.2 mV (control) and -35.5 mV and 8.9 mV (TRH); for erg2, -50.7 mV and 8.0 mV (control) and -42.3 mV and 8.4 mV (TRH); for erg 3, -44.4 mV and 5.0 mV (control) and -36.7 mV and 5.0 mV (TRH). The insets show erg current traces elicited at -100 mV following test pulses to potentials between 10 and -80 mV (erg1), between 50 and -90 mV (erg2) and between -10 and -80 mV (erg3) before (○) and after (•) TRH. Data from the same experiments as given in A on an expanded time scale. Vertical and horizontal scale bars denote 100 pA and 1 s in A, and 100 pA and 10 ms in C.
Following TRH application, peak and steady-state inward and outward currents of all three erg channels were reduced (Fig. 2B). Only at very positive potentials was the effect of TRH small or even absent. Maximal effects on the erg current amplitudes at the end of the 5 s test pulses were measured in the voltage range between -60 and -10 mV.
With the help of the availability curves, two distinct TRH-induced effects became apparent for all three erg channels: a shift in the voltage dependence of current availability to more positive potentials, and a reduction in the maximal available current (Fig. 2C). The inflection potential shifted by 10.3 ± 2.4 mV (n = 10) for erg1, by 8.7 ± 2.4 mV (n = 6) for erg2, and by 7.5 ± 2.0 mV (n = 4) for erg3. The second effect, the reduction in the maximal available erg current amplitude amounted to 17.8 ± 3.6 % for erg1, to 34.6 ± 4.7 % for erg2, and to 28.1 ± 6.5 % for erg3. The effect of TRH on HERG channels was tested with the same pulse protocol. The TRH-induced effects on HERG channels did not significantly differ from those on its rat counterpart. The mean shift in the inflection potentials amounted to 6.6 ± 0.7 mV (n = 7) and the mean reduction in the maximal available current was 12.7 ± 7.9 %.
Due to the slow activation and deactivation kinetics of erg channels, no steady-state conditions were achieved within 5 s test pulse durations. Therefore, the effect of TRH on the voltage dependence of erg current activation was also investigated.
TRH effects on the activation of erg channels
Starting from a holding potential of -80 mV at which all three erg channels are completely deactivated (see Fig. 2 and previous paragraph), variable depolarizing test pulses of 5 s duration were applied followed by a hyperpolarization to -100 mV to assess the proportion of erg channels activated during the preceding test pulses. The different inward rectification of the three erg channels was even more apparent with this pulse protocol (Fig. 3A). The erg current amplitude at the end of the test pulses was maximal at potentials between -10 and 0 mV for erg1, at 20 mV for erg2, and between -30 and -20 mV for erg3. The activation curves (Fig. 3C) show a clearly different voltage dependence of the three rat erg channels. Half-maximal activation was achieved at -21.4 ± 1.5 mV for erg1 (n = 12), at -0.7 ± 1.6 mV for erg2 (n = 10) and at -35.7 ± 1.7 mV for erg3 (n = 8).
Figure 3. TRH shifts erg activation curves and reduces the maximal erg current amplitude.
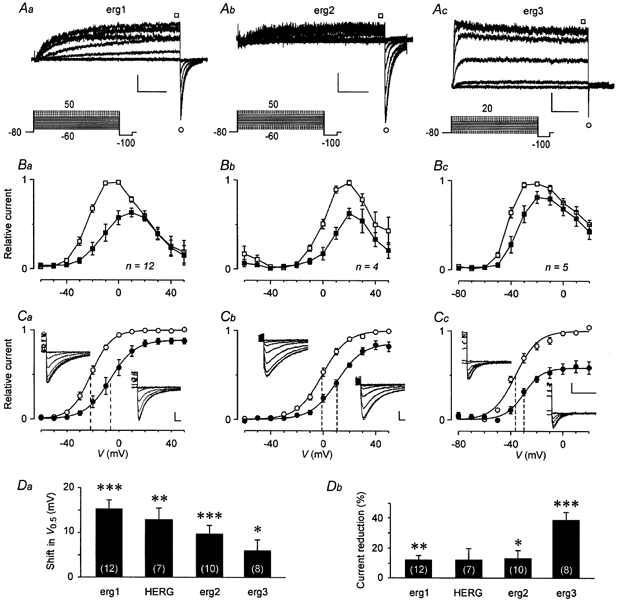
A, erg currents elicited from a holding potential of -80 mV in GH3/B6 cells previously injected with cDNA coding for rat erg1 (a), erg2 (b) and erg3 (c). Continuous lines in the pulse protocols correspond to the selected current traces. The erg currents were isolated with the help of E-4031. Vertical and horizontal scale bars denote 100 pA and 1 s. B, I-V plots of the relative current amplitudes (means ±s.e.m.) at the end of the 5 s test pulses before (□) and after (▪) TRH application. Current amplitudes were normalized to the maximal erg outward current amplitude. C, plots of the maximal erg current amplitude elicited with the constant hyperpolarizing pulse to -100 mV against the preceding test pulse potential. Mean relative current amplitudes (means ±s.e.m.) are given before (○) and after (•) TRH application and the continuous lines represent Boltzmann functions fitted to the data points. Values for the inflection potential (V0.5, indicated by vertical dashed lines) and steepness are, respectively: for erg1, -21.4 mV and 7.8 mV (control) and -6.7 mV and 9.6 mV (TRH); for erg2, -0.8 mV and 9.5 mV (control) and 10.5 mV and 9.8 mV (TRH); for erg 3, -36.3 mV and 8.6 mV (control) and -29.9 mV and 7.1 mV (TRH). The insets show erg current traces recorded at -100 mV following test pulses to potentials between 30 and -60 mV (Ca), 40 and -30 mV (Cb), and 10 and -60 mV (Cc) before (on the left side of the plots) and after TRH (on the right). Data from the same experiments as given in A on an expanded time scale. Vertical and horizontal scale bars denote 100 pA and 50 ms. D, comparison of the TRH-induced shift in the voltage dependence of erg current activation (Da) and the reduction in the maximal available erg current (Db) obtained for rat erg1, HERG, rat erg2 and rat erg3. The values for the rat erg channels are derived from the data shown in C. *P≤ 0.05, **P≤ 0.01, ***P≤ 0.001, significant differences with two-tailed paired t test. Numbers in parentheses indicate the number of experiments.
The magnitude of the differences between the inflection potentials of the availability curves (Fig. 2C) and the activation curves (Fig. 3C) reflect the different gating kinetics of the three erg channels. Using extremely long test pulses, the curves obtained with these two different pulse protocols should be identical and would reflect real steady-state activation (Schönherr et al. 1999). For rat erg1, the difference in the inflection potentials amounted to about 23 mV. A comparable difference of about 22 mV was determined for HERG. The biggest difference was found for erg2 (about 50 mV for the control values), suggesting very slow activation and/or deactivation kinetics. In contrast, a relatively small difference (about 9 mV) was determined for the inflection potentials of the erg3 availability and activation curves, in accordance with the relatively faster activation and deactivation kinetics described in Shi et al. (1997).
TRH was found to clearly reduce the sustained outward current of all three erg channels in a potential range of about 50 mV, starting from the activation threshold (Fig. 3B). Despite the differences in the voltage dependence of activation of the three erg channels, TRH induced significant shifts in the activation curves of all erg channels to more positive potentials (Fig. 3C). The mean shift in the inflection potentials was 15.3 ± 2.0 mV for erg1 (n = 12), 9.6 ± 2.0 mV for erg2 (n = 10) and 6.0 ± 2.5 mV for erg3 (n = 8) (Fig. 3Da). Again, the reduction in the maximal available current was more pronounced for erg3 (38.8 ± 5.1 % current reduction) than for erg1 (11.8 ± 3.2 %) and erg2 (13.1 ± 5.0 %; Fig. 3Db). Corresponding experiments with HERG currents yielded similar TRH effects as obtained for rat erg1 (Fig. 3D).
Recently, the binding of HERG channels to the β-subunits MinK (McDonald et al. 1997) and MiRP1 (Abbott et al. 1999) has been shown to influence the biophysical properties of HERG channels as well as their modulation by cAMP (Cui et al. 2000). MinK is not expressed in GH3/B6 cells (Wulfsen et al. 2000), but mRNA for MiRP1 can be detected in these cells (S. Wimmers, personal communication). Therefore, additional experiments were performed using GH3/B6 cells injected with HERG cDNA and cells coinjected with HERG and rat MiRP1 cDNA to investigate whether the TRH-induced modulation of erg channels is affected by the coexpression of MiRP1.
The E-4031-sensitive currents recorded after coinjection of HERG and MiRP1 cDNA resembled those obtained after injection of HERG cDNA alone, and no significant differences were found in the voltage-dependent activation of the currents (Fig. 4A and B). Since the binding of MiRP1 to HERG has been reported to accelerate the deactivation kinetics (Abbott et al. 1999), the biexponential time course of erg current deactivation was determined with 1 s hyperpolarizing pulses to potentials between -100 and -120 mV from a holding potential of -20 mV. The fit procedure which yielded a fast and a slow deactivation time constant is described in more detail in the next paragraph. The corresponding mean values for the fast time constant were only slightly higher for HERG than those for HERG + MiRP1 (τfast: 44.7 ± 5.6 ms and 33.1 ± 1.7 ms at -100 mV, 28.3 ± 2.1 ms and 24.5 ± 1.1 ms at -110 mV, 20.3 ms ± 1.4 ms and 17.6 ± 1.2 ms at -120 mV for HERG (n = 3) and HERG + MiRP1 (n = 4), respectively). In contrast, the slow deactivation was significantly accelerated in the experiments in which MiRP1 was coinjected with HERG (τslow: 248.4 ± 42.5 ms and 162.9 ± 13.3 ms at -100 mV, 214.5 ± 6.2 ms and 162.1 ± 4.8 ms at -110 mV (P≤ 0.001), 238.8 ms ± 6.6 ms and 156.8 ± 14.0 ms at -120 mV (P≤ 0.01) for HERG and HERG + MiRP1, respectively). In this context, it might be important that the erg1 deactivation kinetics determined in GH3/B6 cells are much faster than those reported by Abbott et al. (1999).
Figure 4. Coexpression of rat MiRP1 does not change the TRH effects on HERG.
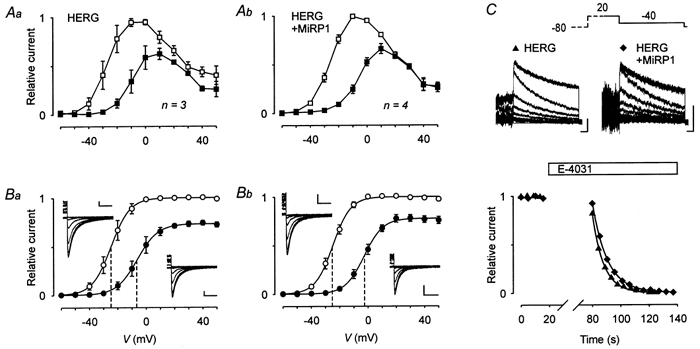
The voltage dependence of HERG current activation before and after TRH application was determined in GH3/B6 cells injected with cDNA coding for HERG (Aa and Ba) or with cDNAs coding for HERG and rat MiRP1 (Ab and Bb) 1 day prior to the experiments using the same pulse protocol as in Fig. 3. The currents were isolated with the help of E-4031. A, I-V plots of the relative current amplitudes (means ±s.e.m.) at the end of the 5 s test pulses before (□) and after (▪) TRH application. Current amplitudes were normalized to the maximal outward current amplitude. B, plots of the maximal erg current amplitude elicited with the constant hyperpolarizing pulse to -100 mV against the preceding test pulse potential. Mean relative current amplitudes (means ±s.e.m.) are given before (○) and after (•) TRH application. The continuous lines represent Boltzmann functions fitted to the data points. Values for the inflection potential (V0.5, indicated by vertical dashed lines) and steepness are, respectively: for HERG, -24.8 mV and 6.2 mV (control) and -6.2 mV and 7.3 mV (TRH); for HERG + MiRP1, -24.8 mV and 6.4 mV (control) and -2.7 mV and 6.6 mV (TRH). The insets show current traces recorded at -100 mV following test pulses to potentials between 30 and -60 mV before (on the left side of the plots) and after TRH (on the right). Vertical and horizontal scale bars denote 100 pA and 100 ms. C, examples of superimposed erg current traces recorded from cells injected with cDNA coding for HERG or for HERG + MiRP1 before and more than 60 s after application of 1 μm E-4031 at the end of the experiments. The currents were elicited with a 2 s test pulse to -40 mV after a 1 s depolarization to 20 mV from a holding potential of -80 mV. Vertical and horizontal scale bars denote 100 pA and 100 ms. The time course of the E-4031-induced reduction in the tail current amplitudes was fitted with a single exponential function yielding time constants of 7.9 and 10.5 s for the cells injected with cDNA for HERG and HERG + MiRP1, respectively.
In CHO cells, coexpression of MiRP1 with HERG was found to accelerate the time course of the HERG current block by 1 μm E-4031 (Abbott et al. 1999). Therefore, a similar pulse protocol (Fig. 4C) was used to determine the time course of the block of the erg currents by 1 μm E-4031 at the end of the TRH experiments. The tail current amplitude measured with the first pulse sequence 1 min after the drug application amounted to 88.3 ± 4.9 % (HERG; n = 4) and to 90.1 ± 3.6 % (HERG + MiRP1; n = 4) of the control values obtained just before the application of E-4031. The decay of the tail current amplitudes with subsequent pulse sequences could be well fitted by single exponential functions as illustrated in Fig. 4C. This procedure yielded comparable mean time constants of 11.2 ± 2.2 s (HERG; n = 4) and 11.7 ± 0.8 s (HERG + MiRP1; n = 4).
No significant differences were found in the TRH-induced modulation of the E-4031-sensitive currents recorded from GH3/B6 cells injected with HERG or HERG + MiRP1 cDNA (Fig. 4A and B). TRH similarly reduced the sustained outward current in the potential range between -40 and 10 mV (Fig. 4A). TRH also induced significant shifts in the activation curves to more positive potentials (Fig. 4B). The mean shift in the inflection potentials was 18.5 ± 3.1 mV for cells injected with HERG cDNA (n = 3), and 22.0 ± 0.4 mV for cells coinjected with HERG + MiRP1 cDNA (n = 4; Fig. 4B). In these experiments, the TRH-induced reduction in the maximal available current amounted to 27.4 ± 2.0 % (HERG) and 22.8 ± 3.4 % (HERG + MiRP1).
The relatively small or even absent effect of TRH on the sustained erg outward currents at more positive potentials seemed to be in contrast to the reduction in the maximal available erg current amplitude (Fig. 3 and 4). Since this discrepancy could result from an acceleration of erg current deactivation leading to smaller tail current amplitudes or from a reduction in steady-state inactivation, we investigated the effects of TRH on the deactivation kinetics and the inactivation of the different erg channels.
TRH effects on the deactivation kinetics of erg currents
The voltage dependence of the time course of recovery from inactivation and subsequent deactivation has been extensively studied for HERG channels, but no corresponding values have been available for rat erg2 and erg3. Therefore, the time constants of recovery from inactivation (τrec) as well as of fast and slow deactivation (τfast and τslow) were determined for HERG, erg1, erg2 and erg3 channels by fitting the sum of three exponential functions to the erg currents elicited with 5 s hyperpolarizing pulses from a holding potential of -20 mV (data from experiments as shown in Fig. 2A). Table 1 summarizes these data and gives also the proportion of the slowly deactivating erg current component. No significant differences were found between HERG and rat erg1. The rate of recovery from inactivation was voltage dependent for all erg channels. The process was slower for erg2 than for erg1 channels, and in the more negative voltage range, erg3 currents exhibited the fastest time course of recovery from inactivation. The time course of deactivation could always be described with a fast and a slow time constant. Both, τfast and τslow, were slightly higher for erg2 than for erg1. In contrast, erg3 had significantly faster deactivation kinetics than erg1 (P≤ 0.01, two-tailed independent unpaired t test; Table 1, illustrated in Fig. 5A).
Table 1.
Time constants (τ) of the recovery from inactivation and fast and slow deactivation and the percentage of the amplitude of the slowly deactivating current component
| V(mV) | HERG(n = 7) | erg1(n = 10) | erg2(n = 8) | erg3(n = 8–9) | |
|---|---|---|---|---|---|
| τrec (ms) | −40 | 12.6 ± 1.7 | 13.7 ± 1.1 | — | 16.0 ± 1.9 |
| −50 | 10.3 ± 1.5 | 12.9 ± 1.2 | 17.6 ± 1.0 | 11.5 ± 1.4 | |
| −60 | 8.9 ± 0.9 | 10.4 ± 1.0 | 14.5 ± 1.1 | 10.7 ± 1.5 | |
| −70 | 7.1 ± 0.6 | 8.7 ± 0.9 | 12.0 ± 0.8 | 8.3 ± 2.3 | |
| −90 | 5.6 ± 0.5 | 7.0 ± 0.9 | 9.5 ± 1.3 | 4.1 ± 0.6 | |
| −100 | 4.6 ± 0.5 | 5.1 ± 0.4 | 8.4 ± 0.9 | 2.8 ± 0.5 | |
| −110 | 3.6 ± 0.5 | 3.9 ± 0.3 | 5.9 ± 0.3 | 2.3 ± 0.2 | |
| −120 | 2.1 ± 0.5 | 3.0 ± 0.2 | 4.6 ± 0.3 | 1.8 ± 0.2 | |
| τfast (ms) | −60 | 286.3 ± 23.3 | 343.9 ± 33.0 | 278.8 ± 42.1 | 73.9 ± 12.3 |
| −70 | 250.2 ± 56.0 | 214.0 ± 25.5 | 238.3 ± 27.8 | 48.3 ± 6.1 | |
| −90 | 66.8 ± 8.5 | 66.3 ± 7.1 | 147.3 ± 17.4 | 18.3 ± 2.6 | |
| −100 | 45.7 ± 9.6 | 52.1 ± 3.4 | 85.9 ± 13.2 | 14.5 ± 1.3 | |
| −110 | 34.4 ± 6.6 | 35.7 ± 1.8 | 54.6 ± 7.9 | 11.3 ± 1.2 | |
| −120 | 25.7 ± 6.2 | 26.2 ± 1.3 | 35.1 ± 4.3 | 8.7 ± 0.9 | |
| τslow (ms) | −60 | 1677 ± 139 | 1589 ± 128 | 2276 ± 108 | 336 ± 66 |
| −70 | 1149 ± 274 | 812 ± 128 | 1385 ± 138 | 254 ± 53 | |
| −90 | 320 ± 56 | 254 ± 29 | 970 ± 199 | 109 ± 16 | |
| −100 | 231 ± 73 | 266 ± 39 | 650 ± 109 | 81 ± 11 | |
| −110 | 228 ± 56 | 238 ± 44 | 658 ± 195 | 68 ± 13 | |
| −120 | 193 ± 77 | 238 ± 52 | 539 ± 144 | 45 ± 5 | |
| 100s(f+s)−1(%) | −60 | 61 ± 4 | 58 ± 3 | 82 ± 3 | 43 ± 6 |
| −70 | 45 ± 5 | 46 ± 7 | 75 ± 6 | 37 ± 8 | |
| −90 | 33 ± 7 | 34 ± 4 | 25 ± 6 | 34 ± 8 | |
| −100 | 26 ± 3 | 18 ± 3 | 12 ± 2 | 21 ± 5 | |
| −110 | 18 ± 3 | 14 ± 2 | 10 ± 1 | 26 ± 5 | |
| −120 | 17 ± 3 | 9 ± 1 | 8 ± 1 | 24 ± 5 |
Data were derived from the equation I(t) =α0+r exp(-t/τrec) +fexp(-t/τfast) +sexp(-t/τslow). r, amplitude of the current component of the recovery from inactivation; f and s, amplitudes of the fast and slowly deactivating current components, respectively. The other terms are explained in the text. Values are means ± s.e.m.
Figure 5. Effects of TRH on erg1, HERG, erg2 and erg3 fast deactivation kinetics.
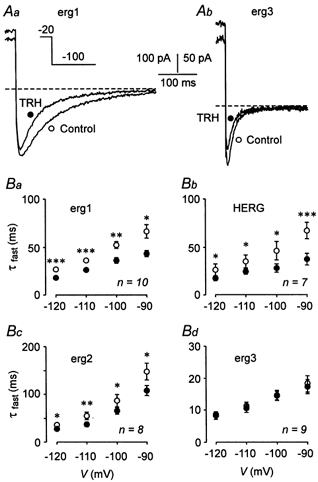
Superimposed erg1 (Aa) and erg3 (Ab) current traces before (○) and after (•) application of 1 μm TRH. The erg currents were isolated using E-4031. The time course of erg current increase and subsequent decay upon hyperpolarizing pulses from a holding potential of -20 mV was fitted by the sum of three exponential functions corresponding to the process of recovery from inactivation as well as to fast and slow deactivation kinetics. B, voltage dependence of the mean time constants of fast deactivation before and after application of TRH obtained in GH3/B6 cells injected with cDNA for rat erg1 (Ba), erg2 (Bc), erg3 (Bd) and HERG (Bb). *P≤ 0.05, **P≤ 0.01 and ***P≤ 0.001, significant differences before and after TRH with one-tailed paired t test.
TRH induced no significant changes in the time constants of recovery from inactivation (data not shown). In contrast, the deactivation kinetics of erg1 and erg2 were significantly accelerated by TRH. At a test potential of -60 mV at which τslow could be measured most accurately due to the relatively high proportion of slowly deactivating erg current, τslow decreased from 1589 ± 128 to 1013 ± 102 ms for erg1 (n = 10; P≤ 0.01) and from 2276 ± 108 to 1563 ± 140 ms for erg2 (n = 8; P≤ 0.01). In contrast, TRH did not significantly decrease τslow for erg3 (336 ± 66 ms for control, 244 ± 38 ms after TRH; n = 9). The fast time constant of erg1 and erg2 current deactivation was also decreased by TRH, but no significant effects were found on τfast of erg3 (Fig. 5). Values for τfast could be determined most reliably from the inward erg currents at more negative potentials where the fast deactivating current component clearly dominated (see Table 1). Again, the effects of TRH on HERG current kinetics were similar to those described for rat erg1 (Fig. 5).
TRH effects on the inactivation of erg currents
The pulse protocol used to study the inactivation of the three erg currents was designed according to Wang et al. (1997). Starting from the fully activated state, a 25 ms hyperpolarization was applied to induce recovery from inactivation without substantial deactivation. This short hyperpolarization was followed by variable depolarizing pulses which induced time- and voltage-dependent inactivation. For erg3, the protocol slightly differed from that used for erg1 and erg2 (Fig. 6A) due to the considerably faster deactivation kinetics of erg3 (see above and also Shi et al. 1997). In Fig. 6A, examples of erg current responses elicited with test pulses to 40 and -10 mV are shown. The erg current decay was fitted by single exponential functions to obtain the time constants of the development of inactivation (τinactivation). At more negative potentials, deactivation developed and the current decay mirrored both the process of inactivation and the process of deactivation. As a result of this overlay, the measured time constants drastically increased. The voltage range where τinactivation could be determined quite accurately was between 40 and -70 mV for erg1 and erg2, and between 40 and -40 mV for erg3. As described by Shi et al. (1997), the absolute values as well as the voltage dependence of the time constants of inactivation were quite similar for erg1 and erg2, whereas erg3 channels exhibited slightly slower inactivation kinetics (Fig. 6B). TRH induced a small, but significant acceleration of the inactivation kinetics of erg1. There was also a tendency to faster inactivation of erg2 and erg3 currents after TRH application.
Figure 6. Effects of TRH on rat erg1, erg2 and erg3 current inactivation.
Rat erg1 (Aa), erg2 (Ab) and erg3 (Ac) current traces elicited with variable test pulses to 40 mV and -10 mV are shown. The erg currents were isolated using E-4031 as specific blocker. The holding potential was -20 mV and a 2 s prepulse to 20 mV preceded the pulse sequences to activate the erg channels. For erg1 and erg2, a 25 ms pulse to -100 mV was used to allow the erg channels to recover from inactivation. For erg3, the corresponding pulse was set to -60 mV due to the fast deactivation of erg3 channels at more negative potentials. The time course of erg current decay upon the variable test pulses was fitted by a single exponential function. The first few milliseconds during which capacitive transients occurred in the original traces were not used for the fit procedure. B, voltage dependence of the time constants of inactivation (means ±s.e.m.) before (○) and after (•) application of 1 μm TRH obtained in GH3/B6 cells injected with cDNA coding for rat erg1 (Ba), erg2 (Bb) and erg3 (Bc). The value for erg3 current decay at -40 mV after TRH (147 ± 45.5 ms) is out of scale due to the onset of deactivation. C, voltage dependence of the ratio of steady-state current to maximal erg current (means ±s.e.m.) before (○) and after (•) application of TRH. The values of Imin and Imax were obtained with the fit procedure. *P≤ 0.05, **P≤ 0.01, significant differences before and after TRH with two-tailed paired t test.
The ratio of the minimal erg current to the maximal current at the onset of inactivation was used as a measure of steady-state inactivation (Fig. 6C). These current amplitudes were obtained from the single exponential functions fitted to the current decay at the depolarizing test pulses. Rat erg1 and erg2 currents exhibited a similar degree and voltage dependence of steady-state inactivation, whereas for erg3, the ratio of the steady-state or minimal current to the maximal current was clearly higher, with a steeper voltage dependence, consistent with considerably less steady-state inactivation for erg3 in the physiologically important voltage range in lactotroph cells. Following TRH application, steady-state inactivation of erg1 was slightly increased, but no significant effects of TRH were found on erg2 steady-state inactivation. For erg3 currents, the ratio of minimal to maximal current amplitude was even increased after TRH application, indicating a slight decrease in erg3 steady-state inactivation (Fig. 6Cc). The smaller ratio at -40 mV for erg3 after TRH was due to overlaid deactivation.
TRH effects measured in the cell-attached configuration
The measurements of membrane currents in the cell-attached configuration were performed in high K+ (external and pipette solution) to clamp the membrane potential of the cells to values close to 0 mV and to maximize the erg current amplitudes. In most experiments, a strong run-down of the specific erg1 currents was observed. Nevertheless, a clear TRH-induced reduction in the erg1 current occurred in four of six experiments (Fig. 7A). Analysis of the voltage dependence of current activation revealed a mean TRH-induced shift in V0.5 of 14.1 ± 0.4 mV in these four experiments. The erg current run-down clearly contributed to the strong reduction in the maximal available erg current measured after TRH application (Fig. 7B).
Figure 7. TRH affects rat erg1 currents measured in the cell-attached mode.
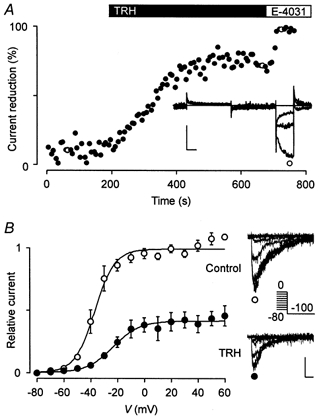
A, membrane currents of a GH3/B6 cell injected with rat erg1 cDNA were recorded in the cell-attached mode in external (bath and pipette) 150 mm K+ solution before and after subsequent application of 1 μm TRH and 10 μm E-4031 (inset). The test pulse sequence was similar to that described in Fig. 1, the holding potential was -30 mV. The time course of relative erg current reduction by TRH and E-4031 was obtained from the maximal current amplitude during the hyperpolarization to -100 mV. The erg currents were isolated with the help of E-4031. The open circles correspond to the current traces shown in the inset. Vertical and horizontal scale bars denote 100 pA and 20 ms, respectively. B, TRH effects on the potential dependence of rat erg1 current activation. Mean (±s.e.m.) relative values of the maximal erg current amplitude elicited with a constant hyperpolarizing pulse to -100 mV before (○) and after (•) TRH application are plotted against the potential of the preceding 5 s test pulse. The pulse protocol and data evaluation were as described in Fig. 3, the holding potential was -80 mV. The continuous lines represent Boltzmann functions fitted to the data points. Values for the inflection potential and steepness are, respectively, -37.1 mV and 7.5 mV (control) and -23.2 mV and 9.8 mV (TRH). Data from 4 of 6 experiments where TRH produced a clear effect (as shown in A). The insets show erg1 current traces recorded at -100 mV following 5 s test pulses to potentials between 0 and -80 mV before and after TRH application.
The difference in the voltage dependence determined in the cell-attached experiments and the perforated-patch whole-cell experiments can be readily explained by the uncontrolled cell potential combined with the absence of a Donnan potential and a liquid junction potential error in the cell-attached experiments as described in Methods.
Effects of substances affecting PKC
Because of the controversial results concerning the effects of phorbol ester or activation of PKC on the modulation of HERG currents, experiments were performed with a variety of substances reported to directly or indirectly interact with PKC activation in GH3/B6 cells. Application of a high concentration of the phorbol ester PMA (1 μm) induced a shift in the voltage dependence of erg1 current activation comparable to the action of TRH, but no significant reduction in the maximal available current (Fig. 8). The effects of PMA and TRH on the shift in the voltage dependence were not additive since a subsequent application of TRH only reduced the maximal available erg1 current without a further shift in the activation curve. Similar results were obtained if TRH and PMA were applied in reverse order: after a typical TRH response, no additional effects of PMA could be elicited. PMA was also able to mimic the TRH-induced acceleration of the erg1 deactivation kinetics. Due to the short duration of the hyperpolarizing pulses to -100 mV in the activation protocol (see Fig. 3A), single exponential functions were fitted to the current decay at -100 mV after a preceding 5 s pulse to +50 mV. After PMA, the deactivation time constants were significantly (P≤ 0.05) decreased from 68.2 ± 8.5 ms for the control currents to 37.1 ± 4.5 ms (n = 5).
Figure 8. Effects of substances affecting protein kinase C on the TRH response of rat erg1.
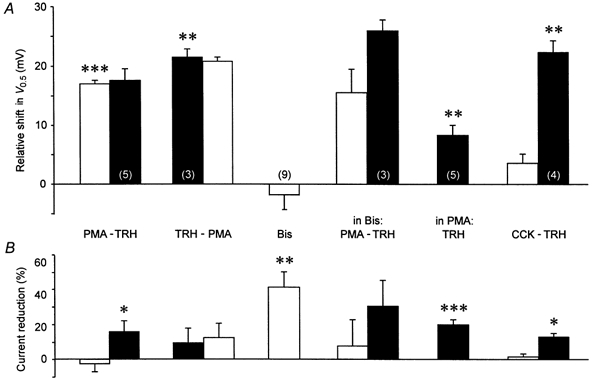
Evaluation of the effects of acute application of the phorbol ester PMA, TRH, bisindolylmaleimide I (Bis) and cholecystokinin (CCK) on the voltage dependence of rat erg1 current activation (A) and the reduction in the maximal available erg current (B). In PMA, preincubation of the cells for 17.5-24 h in 1 μm PMA; In Bis, preincubation of the GH3/B6 cells in bisindolylmaleimide I for 1.5-2.5 h. Pulse protocol and data evaluation were as described in Fig. 3. Test substances were subsequently applied when the effect on the erg current measured with the test pulse sequence (see Fig. 1) reached a plateau. At the end of the experiments, either 10 μm E-4031 or 10 μm dofetilide was applied to allow subtraction of the drug-insensitive currents. *P≤ 0.05, **P≤ 0.01, ***P≤ 0.001, significant differences between subsequent measurements with two-tailed paired t test (except for TRH: one-tailed t test). Numbers in parentheses indicate the number of experiments.
The PKC inhibitor bisindolylmaleimide I was used to investigate whether the effects of PMA were mediated by activation of protein kinase C. Acute application of bisindolylmaleimide I resulted in a drastic inhibition of outward and inward erg1 currents elicited with the standard test pulse sequences. The mean reduction in the maximal available erg1 current amounted to 40.8 ± 8.8 % (Fig. 8). Bisindolylmaleimide I did not significantly affect the voltage dependence of erg1 current activation, but a tendency to a shift in the activation curves to the left was observed in part of the experiments. The relatively fast time course of the bisindolylmaleimide I-induced erg current reduction (about 20 s for a half-maximal effect) suggested a direct blocking effect of the PKC inhibitor on erg channels. The incubation of GH3/B6 cells in bisindolylmaleimide I for 1.5-2.5 h did neither prevent a shift in the voltage dependence of erg1 current activation by PMA nor the current reduction produced by a TRH application subsequent to the PMA application (n = 3, Fig. 8). Nevertheless, the subsequent TRH application induced a small additional shift in the activation curves in these experiments.
In another set of experiments, the effect of long-term incubation of GH3/B6 cells with 1 μm PMA (17.5-24 h) on the TRH-induced modulation of erg1 channels was investigated. A comparably long preincubation of 16 h has been reported to result in a 94 % reduction in PKC activity in GH3 cells (Kolesnick, 1989). In these PKC down-regulated cells, TRH was still able to elicit a significant shift in the voltage dependence of erg1 current activation to more positive potentials and a significant reduction in the maximal available current (Fig. 8). The relatively small TRH-induced shift in the voltage dependence could be explained by the more positive values of V0.5 already observed in the PMA-treated cells (-11.3 ± 2.4 mV, n = 5) compared to the controls (-21.4 mV, see Fig. 3). This indicates that the acute effects of PMA application were not reversed during the long-term incubation, pointing to PKC-independent effects.
In the GH cell lines, the physiological ligand cholecystokinin (CCK) is suggested to activate the phosphoinositide pathway in a similar way to TRH in its first phase. CCK receptors most probably couple to G-proteins of the Gq/11 class (Watson & Arkinstall, 1994) and activation of the CCK-B receptors present in GH3 cells leads to polyphosphoinositide hydrolysis, IP3 and DG generation and Ca2+ mobilization from intracellular pools (Kuwahara et al. 1993). Similar to the action of TRH, the CCK-induced increase in diacylglycerol should activate PKC. The presence of functional CCK receptors in the passages of GH3/B6 cells used in the experiments was confirmed in the current-clamp mode in normal Ringer solution. CCK-8s induced a transient hyperpolarization of the membrane potential (n = 3), indicating the release of Ca2+ from intracellular pools resulting in the opening of Ca2+-dependent K+ channels. Despite this effect on the membrane potential, CCK-8s was unable to produce significant changes of the amplitude and the voltage dependence of erg1 and did not inhibit a subsequent typical TRH response (Fig. 8). Nevertheless, CCK-8s induced a slight, but significant acceleration of the erg1 deactivation kinetics. Fits of single exponential functions to the current decay at -100 mV after a preceding 5 s pulse to +50 mV yielded a mean time constant of 76.5 ± 9.2 ms for the control currents and 61.6 ± 7.5 ms for the current decay after CCK-8s application (n = 5). The subsequent TRH application induced a further significant decrease of the mean deactivation time constant to 45.4 ± 5.1 ms.
Recently, PIP2 has been described to affect the biophysical properties of K+ channels (Huang et al. 1998). Since the TRH-induced activation of PLC has been shown to decrease the concentration of PIP2 by about 40 % (Rebecchi & Gershengorn, 1983), a set of experiments was performed to investigate the effect of PIP2 on erg1 currents. Using the standard whole-cell configuration, PIP2 was applied to the cell interior via the pipette solution. Soon after the establishment of the whole-cell configuration, the erg1 outward and inward currents measured with the standard test pulse sequence began to decrease. After 5-10 min, the erg1 current amplitudes reached stable values. The activation curves obtained after this period exhibited a significant shift in the inflection potential by 9.4 ± 2.6 mV and a significant reduction in the maximal available current by 33.1 ± 6.4 % compared to the values obtained shortly after the break through (n = 4). To see if these effects were produced by PIP2, control measurements were performed in the whole-cell configuration with normal intracellular solution in the pipette. These control experiments revealed a comparable time course of erg1 current reduction as observed in the experiments with PIP2 in the pipette. Already 5 min after the establishment of the whole-cell configuration, the shift in the activation curve amounted to 8.4 ± 2.7 mV and the reduction in the maximal available current amounted to 22.7 ± 5.5 % (n = 4) compared to the initial values. There was no obvious difference in the changes of the erg1 current measured in the whole-cell configuration with and without addition of PIP2 to the internal solution.
Effects of substances affecting cAMP and PKA
Experiments were performed with activators and inhibitors of the cAMP-protein kinase A pathway to investigate a possible involvement of this signal pathway in the TRH-induced modulation of the erg current. The adenylate cyclase activator forskolin induced no shift in the voltage dependence, but a clear reduction in the erg1 current (12.1 ± 2.9 % current reduction, Fig. 9). Subsequent application of TRH induced the typical effects. Forskolin reduced erg2 currents even more drastically (43.7 ± 2.8 % current reduction, -2.5 ± 1.9 mV shift in V0.5, n = 5; data not shown). This current reduction by forskolin most probably did not result from direct channel phosphorylation, because erg2 lacks all known putative consensus sequences for PKA phosphorylation. An experiment where the inactive analogue of forskolin (1,9-dideoxy-forskolin) potently reduced erg1 currents to about a quarter of its previous amplitude suggests that forskolin can exert unspecific blocking effects.
Figure 9. Agents affecting protein kinase A do not affect the TRH-induced modulation of rat erg1.
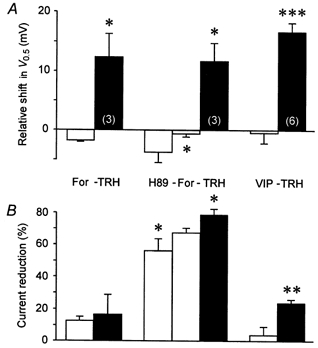
Evaluation of the effects of application of forskolin (For), H-89, VIP and TRH on the voltage dependence of rat erg1 current activation (A) and the relative amplitude of the maximal available erg current (B). Pulse protocol and data evaluation were as described in Fig. 3. *P≤ 0.05, **P≤ 0.01, ***P≤ 0.001, significant differences between subsequent measurements with two-tailed paired t test (except for TRH: one-tailed t test). Numbers in parentheses indicate the number of experiments.
In another set of experiments, the protein kinase A inhibitor H-89 was applied before forskolin and TRH (Fig. 9). At a concentration of 1 μm, H-89 drastically reduced erg1 outward currents as well as the maximal tail current amplitude (55.3 ± 7.6 % current reduction, n = 3). The current reduction was even more pronounced at the higher concentration of 5 μm (77.3 ± 5.6 %, n = 4). H-89 significantly affected the deactivation kinetics of erg1 at the hyperpolarizing pulse to -100 mV. Using a single exponential fit, the deactivation time constant decreased from 86.2 ± 6.4 to 64.5 ± 8.5 ms (1 μm H-89, n = 3, P≤ 0.01), and from 76.1 ± 7.8 to 38.4 ± 2.9 ms (5 μm H-89, n = 4, P≤ 0.01; data not shown). The voltage dependence of erg1 was also affected by H-89 which shifted the mean value for half-maximal erg1 current activation to the left (by 3.6 ± 1.7 mV at 1 μm, n = 3, and by 8.6 ± 1.4 mV at 5 μm, n = 4, P≤ 0.01). The effect of 1 μm H-89 on the voltage dependence was reversed after a subsequent application of forskolin (Fig. 9A). The application of TRH as third test substance still induced a clear shift in V0.5 to the right and further erg1 current reduction.
In addition to pharmacological activation or inhibition of PKA, experiments were performed with the physiological ligand VIP known to elevate cAMP levels in GH3/B6 cells much more potently than TRH does (Gourdji et al. 1979). No significant changes of the erg1 current were observed after addition of VIP to the bath and subsequent TRH applications induced a clear shift in the voltage dependence as well as a pronounced reduction in the maximal available tail current (Fig. 9).
Miscellaneous substances
TRH has been reported to elicit a variety of effects in GH cells or rat lactotrophs (for review, see Corrette et al. 1995). These cellular responses which could be involved in the short- or long-term control of prolactin secretion include activation of tyrosine kinase and MAP kinase (Ohmichi et al. 1994), production of NO (Tsumori et al. 1999) and arachidonic acid liberation (Judd et al. 1986) as well as the reorganization of the cytoskeleton (Van de Moortele et al. 1991). Therefore, substances interfering with these pathways were tested on their ability to mimic or inhibit the specific effects of TRH on rat erg1 currents (Fig. 10). The application of the tyrosine kinase inhibitor tyrphostin A23 produced a shift in the voltage dependence of erg1 activation to more negative potentials and reduced the maximal tail current amplitude. Nevertheless, preincubation with tyrphostin A23 for 1.5-4.5 h did not prevent the normal action of TRH on erg1. Like tyrphostin A23, the MAP kinase inhibitor PD 98059 slightly shifted the voltage dependence of erg1 activation to the left and reduced the maximal current. A subsequent application of TRH induced a clear shift in the voltage dependence of erg1 current activation to more positive potentials and further reduced the current amplitude. The NO donor SNP produced no obvious effects of its own and did not influence the TRH response. Arachidonic acid produced a slight, but not significant, shift in the voltage dependence of erg1 activation to more positive potentials and significantly reduced the maximal available tail current amplitude concomitant with strong effects on erg1 deactivation kinetics (Fig. 10B). The outward currents even increased following arachidonic acid application. In four of the five experiments, the recordings became unstable several minutes after the application of arachidonic acid, preventing the recording of a subsequent TRH response. In the one remaining stable experiment, TRH elicited the typical effects with a 13.2 mV shift in the voltage dependence of activation and a reduction in the maximal available current by 33 %. Cytochalasin D which disrupts the structure of the cytoskeleton by inhibition of actin polymerization drastically reduced the erg1 current without changing the voltage dependence of activation and the effects of a subsequent TRH application.
Figure 10. Effects on rat erg1 of substances interacting with known cellular responses to TRH.
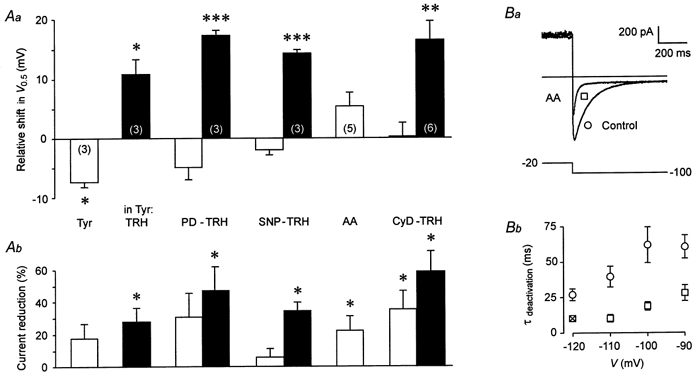
Comparison of the effects of tyrphostin A23 (Tyr), PD 98059 (PD), SNP, arachidonic acid (AA), cytochalasin D (CyD) and subsequent application of TRH on the voltage dependence of rat erg1 current activation (Aa) and the relative amplitude of the maximal available erg current (Ab). In Tyr, cells were preincubated in tyrphostin A23 for 1.5-4.5 h. Pulse protocol and data evaluation as described in Fig. 3. *P≤ 0.05, **P≤ 0.01, ***P≤ 0.001, significant differences with two-tailed paired t test (except for TRH: one-tailed t test). Ba, the time course of erg1 current deactivation was accelerated by arachidonic acid. Bb, voltage dependence of the mean time constants of fast deactivation before and after application of arachidonic acid. Data are means ±s.e.m. (n = 3, except n = 1 indicated by X). The time course of current increase and subsequent decay upon hyperpolarizing pulses from a holding potential of -20 mV was fitted by the sum of three exponential functions corresponding to the process of recovery from inactivation as well as to fast and slow deactivation kinetics.
DISCUSSION
Description of the biophysical properties of erg currents overexpressed in GH3/B6 cells and their modulation by TRH
The TRH-induced reduction in erg currents in prolactin-secreting anterior pituitary cells has been known for a long time (Bauer et al. 1990; Corrette et al. 1996), but the small amplitude of the erg currents hampered a more detailed analysis of this effect. In the present study, we overexpressed all three cloned erg channels in the clonal somatomammotroph GH3/B6 cell line and analysed their modulation by TRH. The advantage of this approach with GH3/B6 cells is the existing TRH signal cascade, and numerous experiments were performed to investigate the intracellular pathway mediating the TRH effects on erg channels in these cells.
The comparative description of the overexpressed erg currents in rat GH3/B6 cells confirms and extends the current knowledge of the gating characteristics of the different erg currents obtained in the oocyte expression system (Shi et al. 1997). The three erg channels exhibited clear differences in their potential-dependent activation. As already described by Shi et al. (1997), half-maximal activation of the erg currents was achieved at membrane potentials about 20 mV more positive for erg2, and about 20 mV more negative for erg3 than for erg1. Despite these differences, erg2 currents clearly more resembled erg1 currents than erg3 currents did. Characteristic of erg3 was a weaker inward rectification because of less pronounced steady-state inactivation and slower inactivation kinetics, and considerably faster deactivation kinetics. The present study provides the first quantitative comparison of the deactivation kinetics of the three erg channels. The deactivation process could always be described with a fast and a slow time constant. Similar to HERG channels (Snyders & Chaudhary, 1996), the relative contribution of the slowly deactivating current component decreased with more negative potentials for all three rat erg channels, though a much steeper voltage dependence was found for erg2 than for erg3. As previously described (Bauer et al. 1998) no significant differences were detected between rat erg1 and its human counterpart HERG.
The present experiments demonstrate that all three erg currents were effectively reduced by TRH. As expected, rat erg1 and HERG channels did not significantly differ in respect to their modulation by TRH. The effects of TRH on erg1 involved a shift in the voltage-dependent activation by about 15 mV to more positive potentials, a slight reduction in the maximal available current amplitude, an acceleration of the deactivation kinetics and a small increase in the rate of inactivation and in steady-state inactivation. In the case of erg2, TRH induced a slightly smaller shift in the activation curve and no significant increase in steady-state inactivation, but comparable effects on the other measured parameters. The TRH-induced acceleration of the deactivation kinetics of erg1 and erg2 currents is able to explain the reduction in the maximum tail current amplitude because TRH did not significantly change the kinetics of the recovery from inactivation. The TRH-induced modulation of erg3 currents somewhat differed from the TRH effects on erg1 and erg2, since the observed shift in the voltage dependence of activation to more positive potentials was least pronounced, the deactivation kinetics were not significantly altered, but there was the strongest reduction in the maximal available tail current. The fact that the erg3 outward currents at more positive potentials were less affected by TRH could partially be explained by a slight reduction in the steady-state inactivation of erg3. In this context, it has to be mentioned that the measurements of erg currents as difference currents in GH3/B6 cells were less precise at more positive potentials due to the increasingly smaller erg currents facing increased endogenous membrane currents. This problem especially applied to erg2 and erg3 currents because of their smaller amplitudes. The differential effects of TRH on the steady-state inactivation of the three erg channels might be functionally correlated to a TRH-induced activation of NO synthase in these cells (Tsumori et al. 1999) since NO has recently been described to shift the steady-state inactivation curve of HERG channels, but not of erg2 and erg3 channels, to more negative potentials (Taglialatela et al. 1999).
A TRH-induced modulation of HERG currents has also been described in Xenopus oocytes heterologously expressing TRH receptors as well as HERG channels (Barros et al. 1998). In oocytes, TRH produced a shift in the activation curve and an acceleration of HERG deactivation kinetics, but no effect on HERG inactivation was detected. Despite the quite similar effects of TRH on erg1 channels in the oocyte expression system and in GH3/B6 cells, the signal cascade mediating the TRH-induced modulation of HERG in Xenopus oocytes has been suggested to differ from the physiological pathway by which TRH reduces the endogenous erg current in GH cells (Barros et al. 1998).
The involvement of a diffusible second messenger in the TRH-induced reduction in IK,IR in GH cells was suggested by the fact that the TRH response faded with time in standard whole-cell experiments, indicating a wash-out of crucial cytosolic factors (Barros et al. 1993). The present finding that erg1 currents recorded in the cell-attached configuration could be modulated by TRH applied to the extra-patch membrane confirmed this assumption. Nevertheless, a typical TRH response was absent in two of six experiments, possibly due to an extremely limited access of the relevant cytosolic substances to the compartment inside the pipette combined with considerable erg current run-down. The strong run-down observed in the cell-attached experiments might be correlated to a disturbance in the organization of the cytoskeleton produced by the invagination of a big membrane area into the pipette tip. This interpretation is supported by the inhibiting effect of cytochalasin D on the erg1 current, measured in the perforated-patch whole-cell configuration. The diffusible second messenger(s) relevant for the observed TRH effects on erg channels must be available in huge amounts, since it is able to mediate the modulation of an enormous number of overexpressed erg channels. On the other hand, the lack of reversibility of TRH action on both the endogenous erg current IK,IR in conventional whole-cell experiments and the huge erg currents through overexpressed erg channels under perforated-patch whole-cell conditions suggests a more limited amount of the factor responsible for the reversibility of the TRH response.
Analysis of the signal cascade
The experiments investigating the TRH-induced signal cascade in GH3/B6 cells were mainly performed with overexpressed erg1 channels because of the high expression level and the resemblance of erg1 currents with the endogenous erg current in these cells (Bauer et al. 1998). From the two cloned TRH receptors, only TRH receptor 1 is expressed in the anterior pituitary of rats (Cao et al. 1998). In GH3 cells, the TRH receptor has been shown to couple to G-proteins of the Gq/11 class (Aragay et al. 1992) and to affect the phosphoinositol pathway. The TRH-induced activation of phospholipase C catalyses the generation of IP3 and DG, leading to a transient and moderate activation of PKC (Martin et al. 1990).
In the present study, we used several approaches to look for a functional role for PKC activation in the TRH-induced modulation of erg currents. Experiments were performed with physiological (CCK-8s) and pharmacological (PMA) activation, down-regulation and pharmacological inhibition of PKC. As previously described for IK,IR (Bauer et al. 1994), the high concentration of 1 μm PMA clearly reduced the erg1 current. The mechanism of PMA action mimics two of the effects of TRH on erg1 currents: the shift in the voltage dependence of activation to more positive potentials and the acceleration of the deactivation kinetics of erg1. On the other hand, PMA did not reduce the maximum erg1 tail current amplitude.
Neither a proposed activation of PKC by CCK-8s nor PKC inhibition or down-regulation affected a subsequent TRH response, suggesting that activation of phorbol ester- or DG-sensitive PKC is not necessary for the TRH-induced modulation of erg currents. These data support the findings obtained with the endogenous erg current in GH cells that PKC is not involved in the TRH-induced modulation of IK,IR (Bauer et al. 1990; Barros et al. 1992). In native rat lactotrophs, additive inhibiting effects of PMA and TRH on the endogenous erg current have been described (Schäfer et al. 1999). Similar to the action of TRH, the effects of PMA on erg1 also seem to be - at least partially - mediated via PKC-independent actions, since bisindolylmaleimide I could not block the PMA effect on erg1.
Recently, phorbol ester has been shown to shift the voltage-dependent activation of HERG channels heterologously expressed in Xenopus oocytes to more positive potentials (Barros et al. 1998; Kiehn et al. 1998). This modulation has been ascribed to activation of PKC (Barros et al. 1998) or PKA (Kiehn et al. 1998). In GH cells, phorbol esters have been suggested to elevate cAMP levels via Gi inhibition as a consequence of PKC activation, and TRH was found to approximately double the formation of cAMP via activation of Gs (Gordeladze et al. 1988a). We therefore examined the effects of activation of the cAMP-PKA pathway on erg currents in GH3/B6 cells. Forskolin strongly reduced the maximal amplitude of both, erg1 and erg2 currents, suggesting a PKA-independent erg channel blocking effect, because erg2 is devoid of putative PKA phosphorylation sites and an inactive forskolin analogue even more potently reduced erg1 currents. In spite of the very high concentration of 100 μm forskolin, no shift in the voltage dependence of erg1 or erg2 current activation occurred. These results are in contrast to the findings obtained in Xenopus oocytes where 400 μm forskolin induced a voltage shift in the HERG activation curve to the right (Thomas et al. 1999). A possible, but improbable, explanation for this discrepancy would be that the phosphorylation of erg channels by PKA is already saturated in GH3/B6 cells under unstimulated conditions. The only hint supporting this idea is the small leftward shift in the voltage dependence of erg1 activation induced by H-89. On the other hand, basal cAMP levels in GH cells are quite low (Gourdji et al. 1979; Gordeladze et al. 1988a,b). Recently, a direct interaction of cAMP with HERG channels heterologously expressed in CHO cells has been described which counteracted a PKA-induced shift in the activation curve to the right (Cui et al. 2000). Nevertheless, this mechanism cannot explain the observed lack of an effect of forskolin on the voltage dependence of erg channels in GH3/B6 cells, because forskolin did not produce a shift in the erg1 activation curve to the left in the presence of the PKA inhibitor H-89, and it had also no effect on the voltage-dependent activation of erg2 lacking putative PKA phosphorylation sites.
After forskolin application, TRH still induced a clear voltage shift. Since forskolin has been shown to be much more effective than TRH in augmenting the cAMP level in GH cells (Gordeladze et al. 1988b), an alteration in cAMP levels cannot account for the observed TRH effects. Also the physiological ligand VIP known to activate adenylate cyclase in GH3/B6 cells via the G-protein Gs (Gourdji et al. 1979) failed to modulate the erg1 current or a subsequent TRH response. These data clearly demonstrate that the cAMP pathway is not involved in the TRH-induced modulation of erg channels in GH3/B6 cells. This is in agreement with previous findings on the TRH-induced reduction in the endogenous erg current in GH3 (Barros et al. 1993) and GH3/B6 cells (Bauer et al. 1994) and native lactotroph cells (Schäfer et al. 1999).
In cardiac myocytes, activation of PKC has even been described to increase IKr currents by decreasing the steady-state inactivation (Heath & Terrar, 2000). The PKC activation was suggested to occur as a side effect of the activation of the cAMP pathway. The varying erg channel modulation in different cell systems clearly demonstrates the necessity of studying the modulation of ion channels in the native system. Factors contributing to the observed variability could comprise differences in the expression or amount of specific second messengers, in the cross-talk between second messenger systems, in the basal phosphorylation level of the erg channels or in the expression of β-subunits associated with erg channels. In a recent paper, the differential effects of cAMP on the modulation of HERG channels have been explained by the association of HERG with MinK or MiRP (Cui et al. 2000). Nevertheless, coinjection of rat MiRP1 together with HERG cDNA did not change the modulation by TRH, consistent with the result that the cAMP pathway is not involved in the TRH-induced modulation of erg channels in GH3/B6 cells.
Apart from the activation of the phosphoinositol and the cAMP pathway, TRH has been described to induce a variety of effects in GH cells (for review, see Corrette et al. 1995). A possible role of the activation of tyrosine kinase and MAP kinase, as well as of arachidonic acid and NO, has been investigated in this study. In agreement with results obtained with HERG channels heterologously expressed in Xenopus oocytes (Taglialatela et al. 1999), the NO donor SNP did neither affect the erg1 activation curve nor the maximal available erg current amplitude. Since subsequently applied TRH elicited the typical response, the TRH-induced production of NO (Tsumori et al. 1999) is most probably not involved in the main TRH-induced changes in the biophysical properties of erg channels in GH3/B6 cells. A number of the applied test substances has been found to exert effects of their own on erg1 currents. Arachidonic acid, for example, induced an extreme acceleration of erg1 current deactivation which might explain the observed reduction in the maximal erg1 tail current amplitude despite increased outward currents. The tyrosine kinase and MAP kinase inhibitors tyrphostin A23 and PD 98059 reduced the erg1 current despite the tendency to shift the voltage dependence of activation to the left. A very pronounced erg1 current reduction was also found following application of the PKC inhibitor bisindolylmaleimide I and the PKA inhibitor H-89. These results show that it is reasonable to measure the effects of acute application of a given test substance in addition to conducting the experiments with preincubation. To date, the experiments with modulators of second messenger pathways have not provided the identification of the signal cascade leading to the TRH-induced modulation of erg channels.
Since TRH has been described to induce a transient reorganization of the cytoskeleton and this effect was mimicked by PMA (Van de Moortele et al. 1991), the significance of the cytoskeleton for the TRH response was also investigated. The finding that cytochalasin D strongly reduced the erg current without effects on the voltage dependence suggests that the cytoskeleton might be important for functional erg channels, but not for the TRH-induced modulation. Possible effects of pH changes have not been tested in the present study although acidification has been described to induce effects on IKr reminiscent of those described for TRH on the erg currents expressed in GH3/B6 cells, including reduction in the fully activated current, a shift in the activation curve to more positive potentials and an acceleration of deactivation (Vereecke & Carmeliet, 2000). Nevertheless, these effects were produced by extracellular, but not by intracellular, acidification. TRH, however, changes intracellular pH, and these alterations are relatively small (Mariot et al. 1993) compared with those required for an ≈10 mV shift in the voltage dependence of IKr activation. In addition, the effects of TRH on intracellular pH are often biphasic, consisting of a fast acidification followed by a more sustained increase in pH.
The postulated phosphorylation step in the TRH-induced modulation of the endogenous erg current in GH3/B6 cells can equally well be at the channel level or at any other step within the signal cascade. TRH has been found to phosphorylate a number of cytosolic proteins in these cells. The phosphoprotein stathmin, for example, can be transformed by TRH from an unphosphorylated form to at least three phosphorylated states (Beretta et al. 1989). Nevertheless, stathmin is most probably not responsible for the TRH-induced effects on erg channels, since VIP which did not affect erg1 current activation has also been shown to induce a conversion of stathmin to all three phosphorylated states. It is possible that TRH uses more than one signal pathway to modulate the erg channels. To answer this question, the combined use of inhibitors of different signal cascades would be required. However, as described above, the use of, for example, protein kinase inhibitors is limited due to their erg current inhibiting properties.
Despite the fact that the native signal cascade is still unknown, the overexpression of erg channels in GH3/B6 cells has allowed a detailed investigation of the TRH-induced changes in the biophysical properties of the different erg channels, resulting in effective erg current reduction.
An important question is whether the observed effects of TRH on the overexpressed erg currents can be transferred to the endogenous erg current IK,IR of GH3/B6 cells. It has been suggested that IK,IR is mediated by rat erg1 since erg1 is expressed in GH3/B6 cells and IK,IR closely resembles erg1 currents (Bauer et al. 1998; Bauer, 1998). More recently, mRNA for erg2 has also been detected in this cell line by RT-PCR using two rounds of amplification (Schäfer et al. 1999; Wulfsen et al. 2000). In the present experiments, the functional expression of erg2 channels in GH3/B6 cells was significantly lower than that of erg1 channels, supporting the assumption that the endogenous erg current is mainly carried by erg1 channels. The identification or quantification of a possible participation of erg2 subunits in the endogenous erg current is difficult, since erg2 currents do not exhibit distinguishing characteristic differences compared to erg1 currents. In this respect it is important that the TRH-induced changes in the biophysical properties of erg2 currents are almost similar to those of erg1 currents.
Since MiRP1 mRNA has been found to be expressed in GH3/B6 cells, it is possible that the endogenous erg channels couple to MiRP1, as has been demonstrated for HERG and rat MiRP1 (Abbott et al. 1999). Therefore we tested whether coinjection of MiRP1 with HERG changes the TRH-induced modulation of the expressed channels and found that MiRP1 overexpression had no effect on the TRH response. In heterologous expression systems, the binding of MiRP1 to HERG channels has been shown to accelerate especially the fast deactivation kinetics and to speed up the time course of erg current block by E-4031 (Abbott et al. 1999). These effects were not observed in the experiments with GH3/B6 cells coinjected with MiRP1 and HERG cDNA, but MiRP1 overexpression accelerated the slow deactivation kinetics of the recorded erg currents. This effect could point to the functional expression and possible interaction of overexpressed MiRP1 with HERG in GH3/B6 cells. Using RT-PCR, we checked that MiRP1 cDNA transfection indeed resulted in a clear overexpression of MiRP1 mRNA (authors' unpublished observation). Nevertheless, it cannot be excluded that the endogenous MiRP1 is expressed in an amount able to saturate the huge number of overexpressed erg channels. In any case, there are no indications that the TRH effect on the endogenous erg channels should differ from the TRH effect on overexpressed erg1 channels. In fact, the TRH-induced shift in the voltage dependence to more positive potentials has already been described for the endogenous erg current IK,IR and the TRH-induced reduction in IK,IR has also been found to be independent of PKC and PKA activation in GH3/B6 and GH3 cells (Bauer et al. 1990, 1994; Barros et al. 1992, 1993). All these parallels suggest that the essential mechanisms for the modulation of the endogenous erg channels and overexpressed erg1 channels by TRH do not differ in GH3/B6 cells.
Acknowledgments
We thank W. Krüger and C. Reißmann for technical help, Dr J. Dixon for the rat erg2 and erg3 clones, S. Wimmers for the rat MiRP1 clone and the Deutsche Forschungsgemeinschaft for financial support (Ba 1436/2). The data presented here are part of the thesis of W.S.
References
- Abbott GW, Sesti F, Splawski I, Buck ME, Lehmann MH, Timothy KW, Keating MT, Goldstein SAN. MiRP1 forms IKr potassium channels with HERG and is associated with cardiac arrhythmia. Cell. 1999;97:175–187. doi: 10.1016/s0092-8674(00)80728-x. [DOI] [PubMed] [Google Scholar]
- Aragay AM, Katz A, Simon MI. The Gαq and Gα11 proteins couple the thyrotropin-releasing hormone receptor to phospholipase C in GH3 rat pituitary cells. Journal of Biological Chemistry. 1992;267:24983–24988. [PubMed] [Google Scholar]
- Barros F, del Camino D, Pardo LA, Palomero T, Giráldez T, dela Peña P. Demonstration of an inwardly rectifying K+ current component modulated by thyrotropin-releasing hormone and caffeine in GH3 rat anterior pituitary cells. Pflügers Archiv. 1997;435:119–129. doi: 10.1007/s004240050491. [DOI] [PubMed] [Google Scholar]
- Barros F, Delgado LM, del Camino D, de la Peña P. Characteristics and modulation by thyrotropin-releasing hormone of an inwardly rectifying K+ current in patch-perforated GH3 anterior pituitary cells. Pflügers Archiv. 1992;422:31–39. doi: 10.1007/BF00381510. [DOI] [PubMed] [Google Scholar]
- Barros F, GómeZ-Varela D, Viloria CG, Palomero T, Giráldez T, de la Peña P. Modulation of human erg K+ channel gating by activation of a G-protein-coupled receptor and protein kinase C. Journal of Physiology. 1998;511:333–346. doi: 10.1111/j.1469-7793.1998.333bh.x. [DOI] [PMC free article] [PubMed] [Google Scholar]
- Barros F, Mieskes G, del Camino D, de la Peña P. Protein phosphatase 2A reverses inhibition of inward rectifying K+ currents by thyrotropin-releasing hormone in GH3 pituitary cells. FEBS Letters. 1993;336:433–439. doi: 10.1016/0014-5793(93)80851-k. [DOI] [PubMed] [Google Scholar]
- Barry PH, Lynch JW. Liquid junction potentials and small cell effects in patch-clamp analysis. Journal of Membrane Biology. 1991;121:101–117. doi: 10.1007/BF01870526. [DOI] [PubMed] [Google Scholar]
- Bauer CK. The erg inwardly rectifying K+ current and its modulation by thyrotropin-releasing hormone in giant clonal rat anterior pituitary cells. Journal of Physiology. 1998;510:63–70. doi: 10.1111/j.1469-7793.1998.063bz.x. [DOI] [PMC free article] [PubMed] [Google Scholar]
- Bauer CK, Davison I, Kubasov I, Schwarz JR, Mason WT. Different G proteins are involved in the biphasic response of clonal rat pituitary cells to thyrotropin-releasing hormone. Pflügers Archiv. 1994;428:17–25. doi: 10.1007/BF00374747. [DOI] [PubMed] [Google Scholar]
- Bauer CK, Engeland B, Wulfsen I, Ludwig J, Pongs O, Schwarz JR. RERG is a molecular correlate of the inward-rectifying K current in clonal rat pituitary cells. Receptors and Channels. 1998;6:19–29. [PubMed] [Google Scholar]
- Bauer CK, Meyerhof W, Schwarz JR. An inward-rectifying K+ current in clonal rat pituitary cells and its modulation by thyrotrophin-releasing hormone. Journal of Physiology. 1990;429:169–189. doi: 10.1113/jphysiol.1990.sp018250. [DOI] [PMC free article] [PubMed] [Google Scholar]
- Bauer CK, Schäfer R, Schiemann D, Reid G, Hanganu I, Schwarz JR. A functional role of the erg-like inward-rectifying K+ current in prolactin secretion from rat lactotrophs. Molecular and Cellular Endocrinology. 1999;148:37–45. doi: 10.1016/s0303-7207(98)00241-x. [DOI] [PubMed] [Google Scholar]
- Beretta L, Houdouin F, Sobel A. Identification of two distinct isoforms of stathmin and characterization of their respective phosphorylated forms. Journal of Biological Chemistry. 1989;264:9932–9938. [PubMed] [Google Scholar]
- Cao J, O'Donnell D, Vu H, Payza K, Pou C, Godbout C, Jakob A, Pelletier M, Lembo P, Ahmad S, Walker P. Cloning and characterization of a cDNA encoding a novel subtype of rat thyrotropin-releasing hormone receptor. Journal of Biological Chemistry. 1998;273:32281–32287. doi: 10.1074/jbc.273.48.32281. [DOI] [PubMed] [Google Scholar]
- Colatsky TJ, Argentieri TM. Potassium channel blockers as antiarrhythmic drugs. Drug Development Research. 1994;33:235–249. [Google Scholar]
- Corrette BJ, Bauer CK, Schwarz JR. Electrophysiology of anterior pituitary cells. In: Scherübl H, Hescheler J, editors. The Electrophysiology of Neuroendocrine Cells. Boca Raton, FL, USA: CRC Press; 1995. pp. 101–143. [Google Scholar]
- Corrette BJ, Bauer CK, Schwarz JR. An inactivating inward-rectifying K current present in prolactin cells from the pituitary of lactating rats. Journal of Membrane Biology. 1996;150:185–195. doi: 10.1007/s002329900043. [DOI] [PubMed] [Google Scholar]
- Cui J, Melman Y, Palma E, Fishman GI, McDonald TV. Cyclic AMP regulates the HERG K+ channel by dual pathways. Current Biology. 2000;10:671–674. doi: 10.1016/s0960-9822(00)00516-9. [DOI] [PubMed] [Google Scholar]
- DiFrancesco D, Noma A, Trautwein W. Kinetics and magnitude of the time-dependent potassium current in the rabbit sinoatrial node. Pflügers Archiv. 1979;381:271–279. doi: 10.1007/BF00583259. [DOI] [PubMed] [Google Scholar]
- Gordeladze JO, Bjøro T, Østberg BC, Sand O, Torjesen P, Haug E, Gautvik KM. Phorbol esters and thyroliberin have distinct actions regarding stimulation of prolactin secretion and activation of adenylate cyclase in rat pituitary tumour cells (GH4C1 cells) Biochemical Pharmacology. 1988a;37:3133–3138. doi: 10.1016/0006-2952(88)90311-5. [DOI] [PubMed] [Google Scholar]
- Gordeladze JO, Sletholt K, Thorn NA, Gautvik KM. Hormone-sensitive adenylate cyclase of prolactin-producing rat pituitary adenoma (GH4C1) cells: molecular organization. European Journal of Biochemistry. 1988b;177:665–672. doi: 10.1111/j.1432-1033.1988.tb14421.x. [DOI] [PubMed] [Google Scholar]
- Gourdji D, Bataille D, Vauclin N, Grouselle D, Rosselin G, Tixier-Vidal A. Vasoactive intestinal peptide (VIP) stimulates prolactin (PRL) release and cAMP production in a rat pituitary cell line (GH3/B6). Additive effects of VIP and TRH on PRL release. FEBS Letters. 1979;104:165–168. doi: 10.1016/0014-5793(79)81107-2. [DOI] [PubMed] [Google Scholar]
- Heath BM, Terrar DA. Protein kinase C enhances the rapidly activating delayed rectifier potassium current, IKr, through a reduction in C-type inactivation in guinea-pig ventricular myocytes. Journal of Physiology. 2000;522:391–402. doi: 10.1111/j.1469-7793.2000.t01-2-00391.x. [DOI] [PMC free article] [PubMed] [Google Scholar]
- Horn R, Marty A. Muscarinic activation of ionic currents measured by a new whole-cell recording method. Journal of General Physiology. 1988;92:145–159. doi: 10.1085/jgp.92.2.145. [DOI] [PMC free article] [PubMed] [Google Scholar]
- Huang C-L, Feng S, Hilgemann DW. Direct activation of inward rectifier potassium channels by PIP2 and its stabilization by Gβγ. Nature. 1998;391:803–806. doi: 10.1038/35882. [DOI] [PubMed] [Google Scholar]
- Judd AM, Koike K, MacLeod RM. A possible role of arachidonate metabolism in the mechanism of prolactin release. American Journal of Physiology. 1986;250:E288–295. doi: 10.1152/ajpendo.1986.250.3.E288. [DOI] [PubMed] [Google Scholar]
- Kiehn J, Karle C, Thomas D, Yao X, Brachmann J, Kübler W. HERG potassium channel activation is shifted by phorbol esters via protein kinase A-dependent pathways. Journal of Biological Chemistry. 1998;273:25285–25291. doi: 10.1074/jbc.273.39.25285. [DOI] [PubMed] [Google Scholar]
- Kolesnick RN. Thyrotropin-releasing hormone and phorbol esters stimulate sphingomyelin synthesis in GH3 pituitary cells. Journal of Biological Chemistry. 1989;264:11688–11692. [PubMed] [Google Scholar]
- Kuwahara T, Nagase H, Takamiya M, Yoshizaki H, Kudoh T, Nakano A, Arisawa M. Activation of CCK-B receptors elevates cytosolic Ca2+ levels in a pituitary cell line. Peptides. 1993;14:801–805. doi: 10.1016/0196-9781(93)90117-y. [DOI] [PubMed] [Google Scholar]
- McDonald TV, Yu Z, Ming Z, Palma E, Meyers MB, Wang K-W, Goldstein SA N, Fishman GI. A minK-Herg complex regulates the cardiac potassium current IKr. Nature. 1997;388:289–292. doi: 10.1038/40882. [DOI] [PubMed] [Google Scholar]
- Mariot P, Dufy B, Audy M-C, Sartor P. Biphasic changes in intracellular pH induced by thyrotropin-releasing hormone in pituitary cells. Endocrinology. 1993;132:846–854. doi: 10.1210/endo.132.2.8381076. [DOI] [PubMed] [Google Scholar]
- Martin TF J, Hsieh K-P, Porter BW. The sustained second phase of hormone-stimulated diacylglycerol accumulation does not activate protein kinase C in GH3 cells. Journal of Biological Chemistry. 1990;265:7623–7631. [PubMed] [Google Scholar]
- Ohmichi M, Sawada T, Kanda Y, Koike K, Hirota K, Miyake A, Saltiel AR. Thyrotropin-releasing hormone stimulates MAP kinase activity in GH3 cells by divergent pathways. Journal of Biological Chemistry. 1994;269:3783–3788. [PubMed] [Google Scholar]
- Ozawa S, Sand O. Electrophysiology of excitable endocrine cells. Physiological Reviews. 1986;66:887–952. doi: 10.1152/physrev.1986.66.4.887. [DOI] [PubMed] [Google Scholar]
- Rebecchi MJ, Gershengorn MC. Thyroliberin stimulates rapid hydrolysis of phosphatidylinositol 4,5-bisphosphate by a phosphodiesterase in rat mammotropic pituitary cells. Biochemical Journal. 1983;216:287–294. doi: 10.1042/bj2160287. [DOI] [PMC free article] [PubMed] [Google Scholar]
- Sanguinetti MC, Jiang C, Curran ME, Keating MT. A mechanistic link between an inherited and an acquired cardiac arrhythmia: HERG encodes the IKr potassium channel. Cell. 1995;81:299–307. doi: 10.1016/0092-8674(95)90340-2. [DOI] [PubMed] [Google Scholar]
- Schäfer R, Wulfsen I, Behrens S, Weinsberg F, Bauer CK, Schwarz JR. The erg-like potassium current in rat lactotrophs. Journal of Physiology. 1999;518:401–416. doi: 10.1111/j.1469-7793.1999.0401p.x. [DOI] [PMC free article] [PubMed] [Google Scholar]
- Schledermann W, Wulfsen I, Schwarz JR, Bauer CK. Analysis of the modulation of erg K+ currents by TRH. Pflügers Archiv. 1999;437(suppl.):R86. [Google Scholar]
- Schönherr R, Rosati B, Hehl S, Rao VG, Arcangeli A, Olivetto M, Heinemann SH, Wanke E. Functional role of the slow activation property of ERG K+ channels. European Journal of Neuroscience. 1999;11:753–760. doi: 10.1046/j.1460-9568.1999.00493.x. [DOI] [PubMed] [Google Scholar]
- Shi W, Wymore RS, Wang H-S, Pan Z, Cohen IS, McKinnon D, Dixon JE. Identification of two nervous system-specific members of the erg potassium channel gene family. Journal of Neuroscience. 1997;17:9423–9432. doi: 10.1523/JNEUROSCI.17-24-09423.1997. [DOI] [PMC free article] [PubMed] [Google Scholar]
- Shibasaki T. Conductance and kinetics of delayed rectifier potassium channels in nodal cells of the rabbit heart. Journal of Physiology. 1987;387:227–250. doi: 10.1113/jphysiol.1987.sp016571. [DOI] [PMC free article] [PubMed] [Google Scholar]
- Snyders DJ, Chaudhary A. High affinity open channel block by dofetilide of HERG expressed in a human cell line. Molecular Pharmacology. 1996;49:949–955. [PubMed] [Google Scholar]
- Spector PS, Curran ME, Zou A, Keating MT, Sanguinetti MC. Fast inactivation causes rectification of the IKr channel. Journal of General Physiology. 1996;107:611–619. doi: 10.1085/jgp.107.5.611. [DOI] [PMC free article] [PubMed] [Google Scholar]
- Taglialatela M, Pannaccione A, Iossa S, Castaldo P, Annunziato L. Modulation of the K+ channels encoded by the human ether-a-gogo-related gene-1 (hERG1) by nitric oxide. Molecular Pharmacology. 1999;56:1298–1308. doi: 10.1124/mol.56.6.1298. [DOI] [PubMed] [Google Scholar]
- Thomas D, Zhang W, Karle CA, Kathöfer S, Schöls W, Kübler W, Kiehn J. Deletion of protein kinase A phosphorylation sites in the HERG potassium channel inhibits activation shift by protein kinase A. Journal of Biological Chemistry. 1999;274:27457–27462. doi: 10.1074/jbc.274.39.27457. [DOI] [PubMed] [Google Scholar]
- Trudeau MC, Warmke JW, Ganetzky B, Robertson GA. HERG, a human inward rectifier in the voltage-gated potassium channel family. Science. 1995;269:92–95. doi: 10.1126/science.7604285. [DOI] [PubMed] [Google Scholar]
- Tsumori M, Murakami Y, Koshimura K, Kato Y. Thyrotropin-releasing hormone stimulates nitric oxide release from GH3 cells. Journal of Neuroendocrinology. 1999;11:451–456. doi: 10.1046/j.1365-2826.1999.00355.x. [DOI] [PubMed] [Google Scholar]
- Van de Moortele S, Rosenbaum E, Tixier-Vidal A, Tougard C. Rapid and transient reorganization of the cytoskeleton in GH3B6 cells during short-term exposure to thyroliberin. Journal of Cell Science. 1991;99:79–89. doi: 10.1242/jcs.99.1.79. [DOI] [PubMed] [Google Scholar]
- Vereecke J, Carmeliet E. The effect of external pH on the delayed rectifying K+ current in cardiac ventricular myocytes. Pflügers Archiv. 2000;439:739–751. doi: 10.1007/s004249900243. [DOI] [PubMed] [Google Scholar]
- Wang S, Liu S, Morales MJ, Strauss HC, Rasmusson RL. A quantitative analysis of the activation and inactivation kinetics of HERG expressed in Xenopus oocytes. Journal of Physiology. 1997;502:45–60. doi: 10.1111/j.1469-7793.1997.045bl.x. [DOI] [PMC free article] [PubMed] [Google Scholar]
- Warmke JW, Ganetzky B. A family of potassium channel genes related to eag in Drosophila and mammals. Proceedings of the National Academy of Sciences of the USA. 1994;91:3438–3442. doi: 10.1073/pnas.91.8.3438. [DOI] [PMC free article] [PubMed] [Google Scholar]
- Watson S, Arkinstall S. The G-protein Linked Receptor Facts Book. London: Academic Press Ltd; 1994. [Google Scholar]
- Weinsberg F, Bauer CK, Schwarz JR. The class III antiarrhythmic agent E-4031 selectively blocks the inactivating inward-rectifying potassium current in rat anterior pituitary tumor cells (GH3/B6 cells) Pflügers Archiv. 1997;434:1–10. doi: 10.1007/s004240050356. [DOI] [PubMed] [Google Scholar]
- Wimmers S, Wulfsen I, Bauer CK, Schwarz JR. Erg1, erg2 and erg3 K channel subunits are able to form heteromultimers. Pflügers Archiv. 2001;441:450–455. doi: 10.1007/s004240000467. [DOI] [PubMed] [Google Scholar]
- Wulfsen I, Hauber HP, Schiemann D, Bauer CK, Schwarz JR. Expression of mRNA for voltage-dependent and inward-rectifying K channels in GH3/B6 cells and rat pituitary. Journal of Neuroendocrinology. 2000;12:263–272. doi: 10.1046/j.1365-2826.2000.00447.x. [DOI] [PubMed] [Google Scholar]