

Abstract
Fundamental to the understanding of CNS function is the question of how individual neurons integrate multiple synaptic inputs into an output consisting of a sequence of action potentials carrying information coded as spike frequency. The availability for activation of neuronal Na+ channels is critical for this process and is regulated both by fast and slow inactivation processes. Here, we have investigated slow inactivation processes in detail in hippocampal neurons.
Slow inactivation was induced by prolonged (10-300 s) step depolarisations to -10 mV at room temperature. In isolated hippocampal dentate granule cells (DGCs), recovery from this inactivation was biexponential, with time constants for the two phases of slow inactivation τslow,1 and τslow,2 ranging from 1 to 10 s and 20 to 50 s, respectively. Both τslow,1 and τslow,2 were related to the duration of prior depolarisation by a power law function of the form τ(t) =a (t/a)b, where t is the duration of the depolarisation, a is a constant kinetic setpoint and b is a scaling power. This analysis yielded values of a= 0.034 s and b= 0.62 for τslow,1 and a= 24 s and b= 0.30 for τslow,2 in the rat.
When a train of action potential-like depolarisations of different frequencies (50, 100, 200 Hz) was used to induce inactivation, a similar relationship was found between the frequency of depolarisation and both τslow,1 and τslow,2 (a= 0.58 s, b= 0.39 for τslow,1 and a= 3.77 s and b= 0.42 for τslow,2).
Using nucleated patches from rat hippocampal slices, we have addressed possible cell specific differences in slow inactivation. In fast-spiking basket cells a similar scaling relationship can be found (a= 3.54 s and b= 0.39) as in nucleated patches from DGCs (a= 2.3 s and b= 0.48) and non-fast-spiking hilar neurons (a= 2.57 s and b= 0.49).
Likewise, comparison of human and rat granule cells showed that properties of ultra-slow recovery from inactivation are conserved across species. In both species ultra-slow recovery was biexponential with both τslow,1 and τslow,2 being related to the duration of depolarisation t, with a= 0.63 s and b= 0.44 for τslow,1 and a= 25 s and b= 0.37 for τslow,2 for the human subject.
In summary, we describe in detail how the biophysical properties of Na+ channels result in a complex interrelationship between availability of sodium channels and membrane potential or action potential frequency that may contribute to temporal integration on a time scale of seconds to minutes in different types of hippocampal neurons.
Voltage-dependent Na+ channels are ubiquitous membrane proteins in excitable cells (Catterall, 1992) that are present in all subcellular compartments. Na+ channels located near the axon initial segment are critical for action potential generation (Colbert & Johnston, 1996) while Na+ channels in dendrites confer active properties to these compartments (Stuart & Sakmann, 1994; Jung et al. 1997; Stuart et al. 1997; Golding & Spruston, 1998). These and other cellular functions are critically dependent on the number of voltage-dependent Na+ channels that are available for activation. The fraction of Na+ channels available for opening is determined by the membrane potential via rapid and slow voltage-dependent inactivation and recovery from inactivation (Raman & Bean, 1999; Mickus et al. 1999).
Fast activation, inactivation and recovery from inactivation take place on a millisecond time scale, as is appropriate for mediating rapid events such as action potentials. In contrast, slow inactivation processes can modulate the availability of Na+ channels on a time scale of seconds to minutes. Generally, repetitive or prolonged depolarisation is necessary to induce slow inactivation of Na+ channels. The recovery from such slow inactivation extends over a wide range of time scales (Rudy, 1978; Stühmer et al. 1989; Ruben et al. 1992; Cummins & Sigworth, 1996; Fleidervish et al. 1996; Fleidervish & Gutnick, 1996; Colbert et al. 1997; Hayward et al. 1997). Some of this diversity may be explained by assuming that the rates of slow inactivation are dependent on the duration of prior depolarisation. Such a relationship has been found in cloned rat brain NaII and NaIIA Na+ channels (Toib et al. 1998), with a power law function describing the dependence of the time constants of recovery from inactivation on the duration of prior depolarisation. This feature seems to be an intrinsic property of the Na+ channel α subunit. As a consequence, the availability of these Na+ channels depends in a complex manner on the prior history of membrane potential changes. Intriguingly, this provides a powerful mechanism for temporal integration in a range of seconds to minutes that is based on the biophysical characteristics of a Na+ channel α subunit. At present, it is not clear whether these properties also apply to other pore-forming Na+ channel α subunits (Catterall, 1992), but β subunits can clearly modulate inactivation of the rat brain IIA channel (Toib et al. 1998; Isom et al. 1994). Thus, properties of ultra-slow inactivation could conceivably be very different between different cell types or subcellular compartments.
It has become clear that such differences exist with respect to fast inactivation and recovery from inactivation between hippocampal interneurons and principal neurons (Martina & Jonas, 1997), or between dendritic and somatic Na+ channels in CA1 pyramidal cells (Colbert et al. 1997; Mickus et al. 1999). In contrast, it is unclear whether ultra-slow inactivation is similarly diverse in different neuron types. Because the rates of slow inactivation are dependent on the duration of prior depolarisation, comparison of Na+ channel slow inactivation processes in different cell types necessitates analysis of a range of depolarisation durations used to induce inactivation.
Here, we show that a power law relationship similar to that of cloned rat brain Na+ channels can be found in native neurons. We further demonstrate that the frequency of action potential-like depolarisations is also encoded in a similar manner. Unlike rapid inactivation, the properties of ultra-slow inactivation were remarkably conserved in interneurons and principal neurons. Finally, we show that this property of Na+ channels is conserved in human hippocampal neurons.
METHODS
Preparation of slices and enzymatic isolation of DGCs
Coronal slices (400 μm) were prepared from the corpus of human hippocampal specimens or from the hippocampus of 10- to 20-day-old Wistar rats with a vibratome (Leica VT1000S, Leica, Germany) in a bath filled with ice-cold saline containing (mm): NaCl 90, KCl 3, MgSO4 5, CaCl2 2, sodium pyruvate 1, glucose 10, Hepes 10 and sucrose 80; pH 7.4, 100 % O2. Prior to decapitation, rats were deeply anaesthetised with ether. Rat and human slices were then transferred to a storage chamber with bicarbonate-buffered saline (21 °C) containing (mm): NaCl 125, NaHCO3 25, KCl 3, NaH2PO4 1.25, MgCl2 1, CaCl2 2 and glucose 20. The pH was adjusted to 7.4 by gassing the solution with carbogen (5 % CO2, 95 % O2). In this storage chamber, slices could be stored for up to 10 h at room temperature. After an equilibration period of 60 min, the first section was transferred to a tube with 5 ml saline containing (mm): CH3SO3Na 145, KCl 3, MgCl2 1, CaCl2 0.5, Hepes 10 and glucose 15; pH was adjusted to 7.4 with NaOH. Pronase (protease type XIV, 2 mg ml−1; Sigma, UK) was added to the oxygenated medium (100 % O2). After an incubation period of 15 min at 35 °C, the slice was washed in pronase-free saline of an identical composition. The dentate gyrus was dissected and triturated with fire-polished Pasteur pipettes of decreasing aperture. Where possible, the hilus was separated from the slice during trituration. The Petri dish containing the cell suspension was then mounted on the stage of an inverted microscope (Telaval, Zeiss, Jena, Germany). Isolated cells were allowed to settle for 5-10 min and were superfused with an extracellular solution containing (mm): CH3SO3Na 120, KCl 2.5, CaCl2 2, MgCl2 2, Pipes 26, 4-aminopyridine (4-AP) 4 and CdCl2 0.03; adjusted to pH 7.4 with NaOH. In some experiments on fast voltage-dependent activation, inactivation and recovery from inactivation (data not shown) 5 nm TTX was added to the solution (pH 7.4, osmolarity 310 mosmol l−1). Isolated cells showed a round or ovoid small (capacitance 8 ± 2 pF) soma with a single process reminiscent of dentate granule cell (DGC) morphology in situ. Another type of neuron occurring in low numbers in the preparation was large (15 ± 3 pF) and showed a multipolar morphology with several processes emanating from the soma. The latter type of neuron was excluded from this study. All animal experiments were conducted in accordance with the guidelines of the University of Bonn Animal Care Committee and were approved by the board on proper use of experimental animals of the state Nordrhein-Westfalen.
In addition to control DGCs from rat hippocampus, we were able to obtain structurally intact hippocampal tissue from a 35-year-old patient who underwent resective surgery for a WHO grade IV glioblastoma. Unlike most patients from which hippocampal specimens can be obtained (Nagerl et al. 2000), this patient did not have epilepsy. The histopathology of the hippocampal specimen did not show any signs of morphological damage or tumour invasion. Because of the absence of tumour invasion or epilepsy, such rare and valuable tissue is the closest approximation possible to physiological investigations on true control human tissue. The hippocampal structures were blocked with a razor blade and further processed in the same way as the rat hippocampal specimens (see below). Informed consent was obtained from the patient for additional electrophysiological evaluation. All procedures were approved by the Ethics Committee of the University of Bonn Medical Center and conform to the standards set by the Declaration of Helsinki (1996).
Whole-cell patch-clamp recording
Patch pipettes were fabricated from borosilicate glass capillaries (1.5 mm o.d., 1 mm i.d.; Science Products, Hofheim, Germany) on a Narishige P83 puller (Narishige, Tokyo, Japan). For measurements of Na+ channel voltage-dependent activation pipettes with a low resistance of 2-3 MΩ were used. In the remainder of the recordings, pipette resistance did not exeed 4 MΩ. Pipettes were filled with an intracellular solution containing (mm): caesium methanesulphonate 90, TEA 20, MgCl2 5, Hepes 10, BAPTA 5, CaCl2 0.5, ATP 10 and GTP 0.5. The pH was adjusted to 7.4 with NaOH. The osmotic pressure was adjusted with sucrose to 300 ± 6 mosmol l−1. A liquid junction potential of 7 ± 1 mV n = 3 was measured between the internal and external solutions (Barry & Lynch, 1991; Neher, 1999). Recordings and values are not corrected for this junction potential. Tight-seal whole-cell recordings were obtained according to (Hamill et al. 1981). Seal resistance was > 2 GΩ in all recordings. For recordings of the voltage-dependent activation behaviour, the series resistance was 6 ± 2 MΩ, while in the remainder of the measurements it did not exceed 10 MΩ. Series resistance was estimated by the dial settings for series resistance compensation on the Axopatch 200 B amplifier (Axon Instruments). To improve the voltage control during activation of the Na+ current, series resistance and capacitance compensation between 70 and 90 % were employed. Voltage commands were delivered via the Axopatch 200B amplifier and collected online with the pCLAMP 6.0 aquisition and analysis program (Axon Instruments). Current signals were filtered at 5 kHz (-3 dB, 4-pole low-pass Bessel filter) and sampled at 20 kHz or more by an interface (DigiData 1200, Axon Instruments). Residual capacitance transients and leak conductance were subtracted using a P/4 protocol. All experiments were carried out at room temperature (21-23 °C).
Nucleated patch recording
Slices (300 μm) were obtained as described above and DGCs, hilar neurons and basket cells were visually identified using infrared differential interference contrast (IR-DIC) videomicroscopy (Stuart et al. 1993). Current clamp measurements were performed for additional identification. Cells were initially patched with a pipette containing (mm): potassium gluconate 125, MgCl2 2, Na2-ATP 4, EGTA 0.5, Hepes 10, KCl 20 and biocytin 3; pH adjusted to 7.2 with KOH. After recording the firing pattern of the cell in the whole-cell configuration cells were patched again with a second pipette containing an intracellular solution identical to that used for measurements of sodium channels in isolated neurons. To isolate nucleated patches (Sather et al. 1992; Martina & Jonas, 1997), negative pressure (150 ± 10 mbar) was applied and the patch pipette was withdrawn slowly. Patch pipettes were pulled from borosilicate glass tubing (2.0 mm o.d., 0.5 mm wall thickness; Science Products GmbH, Germany) on a Narishige P83 puller (Narishige) and coated with Sylgard (184; Dow Corning, UK). Neurons were approached with patch pipettes under visual control. The resistance of patch pipettes ranged from 2-5 MΩ. Patch currents were recorded using the Axopatch 200B amplifier and collected online with pCLAMP 8.0 acquisition and analysis program. Signals were filtered at 10 kHz (-3 dB, 4-pole low-pass Bessel filter). Capacitive transients were minimised by maintaining the bath at the lowest possible level, and were further reduced by the capacitance compensation circuit of the amplifier. Series resistance compensation was not used. Data were sampled at 20-40 kHz via a Digidata interface (Axon Instruments). Leakage and capacitance currents were subtracted on-line using a P/4 protocol. Slices were continuously perfused with physiological extracellular solution containing (mm): NaCl 125, KCl 2.5, NaH2PO4 1.25, NaHCO3 26, CaCl2 2, MgCl2 1 and glucose 25; bubbled with 95 % O2 and 5 % CO2.
Voltage clamp protocol and fitting
Voltage-dependent steady-state activation and inactivation
The voltage dependence of activation and inactivation was determined using standard protocols. The conductance G(V) was calculated according to:
| (1) |
where VNa is the Na+ reversal potential, V the command potential and Imax the peak current amplitude. G(V) was then fitted with the following Boltzmann equation:
| (2) |
where Gmax is the maximum Na+ conductance, V50 is the voltage where G(V) is half of Gmax, and km indicates the slope of the relationship between channel inactivation and membrane voltage.
Double-pulse experiments. A conditioning pulse from -80 to -10 mV was followed by a varying recovery period (1 ms to 10 s) at -80 mV and a subsequent test pulse to -10 mV (for 10 ms). The duration of the conditioning pulse was 10, 100 or 1000 ms. Time constants of recovery r1 and r2 were extracted from the equation:
| (3) |
where I(t) is the current amplitude at the time point t after onset of the voltage command and A is the amplitude contribution of the different recovery time constants.
Investigation of ultra-slow recovery processes
In these experiments, a conditioning pulse from -80 to -10 mV was applied for various durations (0.01, 1, 10, 30, 100 and 300 s) followed by a 1 s recovery interval at -80 mV. This interval allowed for a virtually complete recovery of the channels from rapid inactivation and was followed by a series of brief test pulses with a frequency of 0.33 Hz aimed at monitoring the process of recovery from slow inactivation. The pulse protocol was carried out until the Na+ current amplitude reached saturation (Imax). The current amplitude during recovery of the Na+ current was normalised to Imax.
Because recovery from rapid inactivation should be virtually complete after 1 s, the remaining inactivation represents a good estimate of the channels that have undergone slow inactivation during the prepulse. For varying prepulse durations, we have therefore calculated the ratio F:
| (4) |
where I1 is the peak amplitude of the current evoked by the first test pulse. This ratio represents the fraction of current available for activation after depolarisations of different durations. In subsequent experiments, inactivation was induced by a 100 s prepulse of different voltages (-50, -30, -10, 10 and 30 mV) in order to investigate the voltage dependence of entry into slow inactivation. In addition, we have investigated the voltage dependence of slow recovery by varying the recovery potential between -60 and -90 mV.
Frequency stimulation
In some experiments, inactivation was induced by a series of action potential-like depolarisations (duration 2 ms) from -80 to 30 mV at either 50, 100 or 200 Hz for a period of 100 s. The recovery from slow inactivation was investigated as above with a series of brief test pulses (0.66 Hz).
Statistical comparison was carried out with a two-tailed Student's t test. All results are shown as the mean ±s.e.m.
RESULTS
Fast voltage-dependent activation, inactivation and recovery from inactivation in rat DGCs
We initially determined the properties of fast voltage-dependent activation and inactivation using standard voltage protocols shown in the insets to Fig. 1 (A1 and A2, respectively). The conductance-voltage relationship could be fitted with a Boltzmann equation (V1/2,act= -22.6 ± 2.3 mV, k= 5.8 ± 0.7 mV, n= 5 and V1/2,inact= -56.8 ± 2.5 mV, k= -6.71 ± 0.32 mV, n= 7) shown superimposed on the data points (Fig. 1A3). Fast recovery from inactivation induced by brief depolarisations was biexponential (Fig. 1B 2), with τfast,1 and τfast,2 being the two time constants of recovery: τfast,1= 9.3 ± 2.5 ms; τfast,2= 412.4 ± 112.4 ms n = 7. Varying the prepulse duration from 10 to 100, and then 1000 ms (data of the slower time constants shown in Fig. 2C) led to an increase in the fraction of the slower time constant from 13.8 ± 0.92 % at 10 ms to 29.4 ± 8.42 % at a 1000 ms prepulse whereas the fraction of the faster time constant decreased from 81.5 ± 1.6 % at 10 ms to 48.4 ± 6.8 % for a 1000 ms prepulse. These experiments clearly show that inactivation induced with short (10 ms) depolarisations requires less than 1 s for virtually complete recovery.
Figure 1. Fast voltage-dependent activation, inactivation and recovery from inactivation in rat DGCs.
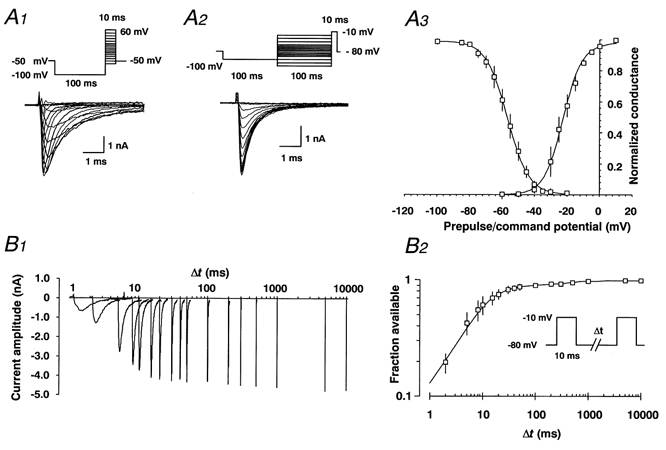
A1 andA2, families of representative recordings elicited by the voltage protocols shown in the insets. A3, average values of normalised conductances for voltage-dependent activation and inactivation are shown. For each individual recording, a Boltzmann function (eqn (2)) was fitted to the data points of voltage-dependent steady state activation or inactivation. Boltzmann functions constructed from the average values for half-maximal activation and inactivation and the slope factor k are shown superimposed on the data points in Fig. 1A 3 with V1/2,act= -22.6 ± 2.3 mV, k= 5.8 ± 0.7 mV, n= 5 and V1/2,inact= -56.8 ± 2.5 mV, k= -6.71 ± 0.32 mV, n= 7. In these recordings, the maximal residual voltage error due to the series resistance, RS,eff, calculated as Imax×RS,eff, did not exceed 6 mV (5.1 ± 1.7 mV). After reducing the current amplitude by ≈50 % via application of 5 nm tetrodotoxin to reduce RS,eff, the voltage dependence of fast activation remained unchanged (V1/2,act= -22.8 ± 2.5 mV, k= 7.5 ± 1.9 mV, n= 7; not shown). Likewise, voltage-dependent activation measured in DGC nucleated patches yielded similar values (V1/2,act= -25.2 ± 3.5 mV, k= 7.5 ± 0.8 mV, n= 4), indicating that the error in voltage dependence due to RS,eff is negligible. B 1, fast recovery from inactivation was analysed with double-pulse experiments at a recovery potential of -80 mV, with various intervals between a 10 ms conditioning pulse (-10 mV) used to induce inactivation, and a 10 ms test pulse (B 2, inset). Representative family of original traces are displayed on an exponential time scale (B 1). B 2, recovery from fast inactivation could be best described by the biexponential equation (eqn (3)) shown superimposed on the data points in B 2 with τfast,1= 9.3 ± 2.5 ms; τfast,2= 412.4 ± 112.4 ms; n= 7. A2, peak currents elicited after each interpulse interval were normalised to the peak test pulse current obtained after a recovery period of 10 s at -80 mV. To ensure that the peak current reflected the complete recovery of Na+ currents, all cells were clamped to -80 mV for 0.5 min after the double-pulse experiment. Experiments in which a further increase or decrease in Na+ current amplitude of more than 5 % could be observed during this 0.5 min interval were excluded from further analysis. The time constants obtained with partial blockade of Na+ channels in the presence of 5 nm TTX were not significantly different (not shown).
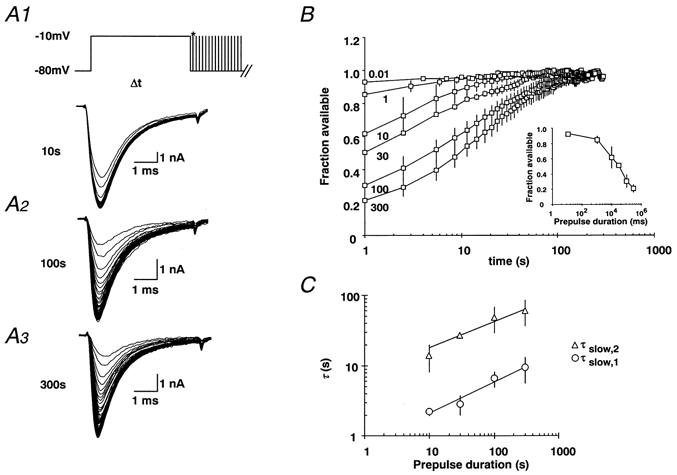
Figure 2. The time course of slow recovery depends on the duration of prior depolarisation in rat DGCs.

A1-3, a conditioning pulse to -10 mV was applied for various durations (10, 100 or 300 s). The time course of ultra-slow recovery from inactivation was monitored by a series of brief test pulses with a frequency of 0.33 Hz until the Na+ current amplitude reached saturation (Imax). B, because rapid recovery from inactivation should be virtually complete after a 1 s interval at -80 mV (see asterisk in the pulse protocol), the remaining inactivation is a good measure of the relative proportion of slow recovery processes. Prepulses ranging from 10 ms to 300 s in duration were used to induce Na+ channel inactivation. The current amplitude during recovery of the Na+ current was normalised to Imax, yielding the fraction of available Na+ current. The normalised values were plotted over recovery time for various prepulse durations (0.01, 1, 10, 30, 100 and 300 s with n= 5-7). The inset shows the fraction of Na+ channels showing slow recovery which increases steeply with increasing prepulse duration in rat DGCs. The fraction of available Na+ currents was calculated as the ratio of peak current during the first test pulse divided by Imax (eqn (4)). C, with prepulse durations from 10-300 s, the recovery from inactivation was fitted by a biexponential function (eqn (3)), with the two time constants τslow,1 (○) and τslow,2 (△) n = 5-7. The relationship between the duration of prior depolarisation t and recovery time constants τ was fitted by a power law function of the form: τ(t) =a (t /a)b with a= 0.03 s and b= 0.62 for τslow,1 and a= 24 s and b= 0.30 for τslow,2 (see Table 1) shown superimposed on the data points. Time constants (□) extracted from double-pulse experiments with conditioning prepulse durations of 10, 100, 1000 ms, with n= 3, 4 and 6, respectively.
The time course of slow recovery depends on the duration of prior depolarisation in rat DGCs
Because an even slower recovery time constant could contribute to regulating the availability of INa over a time scale of seconds or even minutes, we have investigated this slow recovery process in detail. We have used depolarising prepulses ranging from 10 ms to 300 s in duration to induce Na+ channel inactivation to test how prepulse duration affects the kinetics of the recovery process.
Following inactivation of Na+ currents by prepulses of different durations, the current amplitudes measured with brief depolarisations (Fig. 2A1-3) could be seen to gradually recover over a time period of seconds to minutes (Fig. 2B, n= 5-7). With prepulse durations of 10-300 s, the recovery from inactivation was approximated well by a biexponential function (eqn (3)), with one time constant (τslow,1) in the range of 1-10 s and a second time constant (τslow,2) of 20-50 s (Fig. 2C, n= 5-7). Clearly, the time constants of recovery were related to the prepulse duration, with more prolonged depolarisation leading to an increase in both τslow,1 and τslow,2. The relationship between the duration of prior depolarisation t and recovery time constants τslow,1 and τslow,2 could be fitted by a power law function of the form: τ(t) =a (t/a)b (see Table 1) shown superimposed on the data points (Fig. 2C). The square symbols (□) represent the time constant τfast,2 derived from double-pulse experiments with prepulses of 10, 100, 1000 ms (n= 3, 4 and 6, respectively).
Figure 3. The time course of ultra-slow recovery does not depend on the voltage of the conditioning depolarisation.
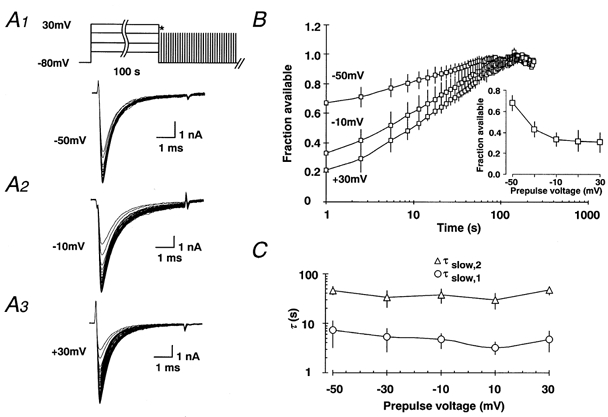
A1-3, inactivation was induced with a 100 s depolarising prepulse to various potentials (-50 to +30 mV) in order to investigate the voltage dependence of entry into slow inactivation. B, as in Fig. 2, the fraction of available current slowly recovered. The inset shows the fraction of available Na+ current which was calculated as described in eqn (4) and plotted against the prepulse voltage. C, the recovery from inactivation was fitted by a biexponential function (eqn (3)), with the two time constants τslow,1 (○) and τslow,2 (△, n= 5-12). The time constants were plotted against the prepulse voltage used to induce inactivation.
Table 1.
Values for the scaling relationship of ultra-slow recovery
| Rat | Human | ||||
|---|---|---|---|---|---|
| τslow,1 | τslow,2 | τslow,1 | τslow,2 | ||
| Step depolarisation | a | 0.034 | 24.00 | 0.63 | 25.00 |
| b | 0.62 | 0.30 | 0.44 | 0.37 | |
| AP-like depolarisation | a | 0.58 | 3.77 | — | — |
| b | 0.39 | 0.42 | — | — | |
a, constant kinetic setpoint; bscaling power; AP, action potential.
From these experiments, we could also derive some information about the kinetics of entry into slow inactivation. The proportion of current that is showing slow recovery from inactivation can be estimated after a 1 s interval at -80 mV (Figs 2A1 and 3A1, insets, asterisks) after which rapid recovery with τfast,1 and τfast,2 is virtually complete (see Fig. 1B1 and B 2; Toib et al. 1998). The inset in Fig. 2B depicts the dependence of this fraction of Na+ channels showing slow recovery on the prepulse duration. With increasing prepulse duration the fraction of Na+ channels showing slow recovery increases steeply n = 5-7. The time course of slow inactivation could be described by a biexponential equation (eqn (3)). Fitting such an equation to the averaged data points in the inset of Fig. 2B yielded two time constants of 5.88 and 77.36 s for this process.
The time course of slow recovery does not depend on the voltage of prior depolarisation in rat DGCs
Next, we have tested whether the ultra-slow recovery rates depend on the voltage of the conditioning depolarisation. Similar to the data in Fig. 2, the fraction of available current showed a slow recovery (Fig. 3B). In contrast to the dependence on the duration of prior depolarisation, the time constants of slow recovery (τslow,1 and τslow,2) were not related to the prepulse voltage (Fig. 3C, n= 5-12).
The inset of Fig. 3B shows the voltage dependence of the entry into the slowly recovering state. The proportion of channels entering the slowly inactivating state increases with more depolarising prepulses. Nevertheless, a substantial portion of Na+ channels (32.0 ± 7.6 %) is inactivated even at prepulse potentials of -50 mV, a potential subthreshold for eliciting Na+ currents n = 5-12. This surprising finding indicates that modest depolarisations from the resting potential are sufficient to modulate the availability of Na+ channels.
Voltage dependence of the recovery process in rat DGCs
Subsequently, we have determined the dependence of slow recovery rates on the membrane potential by systematically varying the recovery potential following a 100 s prepulse (Fig. 4A, inset). The time constant τslow,1 proved to be completely independent of the recovery potential. The time constant τslow,2 was slightly but significantly larger at the most depolarised recovery potential, -60 mV, than at -90 mV (Fig. 4B, n= 5-7). Nevertheless, recovery over a range of potentials from -90 to -70 mV proved to be clearly voltage independent.
Figure 4. Voltage dependence of the recovery process in rat DGCs.
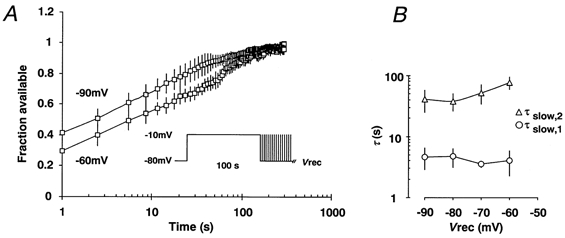
A, slow recovery induced by a 100 s depolarising prepulse to -10 mV (see inset) was investigated at various recovery potentials (Vrec) ranging from -90 to -60 mV. B, the recovery from inactivation was fitted by a biexponential function (eqn (3)), with the two time constants τslow,1 (○) and τslow,2 (△) n = 5-7 which were plotted against the recovery potential Vrec.
Series of brief depolarisations are appropriate for monitoring slow recovery processes
The repetitive stimulation protocol we have used to monitor recovery has previously been shown to be appropriate for monitoring very slow recovery processes (Toib et al. 1998). Nevertheless, to exclude the possibility that the brief voltage steps used to monitor recovery can cause significant slow inactivation themselves, we have performed additional experiments using slower stimulation frequencies (0.11 and 0.055 Hz; data not shown). If the recovery process was altered by the brief voltage steps, then such effects should be reduced at lower stimulation frequencies. Because the time course of recovery was not altered using this protocol, we conclude that the brief test pulses employed do not interfere significantly with the slow recovery process.
Action potential-like depolarisations also induce entry into the slowly recovering state in rat DGCs
In order to probe the physiological relevance of the relation between membrane voltage and availability of Na+ channels, we have established whether short, action potential-like depolarisation can also induce entry into the slowly recovering state. Following a 100 s long series of brief (2 ms) depolarisations from -80 to 30 mV at 50, 100 or 200 Hz, recovery was monitored as described above (Fig. 5A, n= 4, 7 and 7, respectively). This stimulation protocol also induced significant inactivation of Na+ channels that recovered with a similar time course to the recovery following step depolarisations. The time constants τslow1 and τslow2 were related to the frequency f of depolarisation by a power law function τ(f) =a (fa)b that is shown superimposed on the data points. This is similar to the effect of depolarisation duration on the time constants). The exponent b was found to be quite similar for both step depolarisations and the frequency of action potential-like depolarisations (see Table 1).
Figure 5. Action potential-like depolarisations also induce entry into the slowly recovering state in rat DGCs.

A, inactivation was induced with a 100 s train of short depolarisations (2 ms, 30 mV) at different frequencies (50, 100 and 200 Hz). Recovery from inactivation was monitored as in Fig. 2. B, the recovery from inactivation was fitted by a biexponential function, with the two time constants slow,1 (○) and τslow,2 (△) (n= 4,7 and 7, respectively). The relationship between the stimulation frequency f and the recovery time constants τ was fitted by a power law function of the form: τ(f) =a (fa)b with a= 0.58 s and b= 0.39 for τslow,1 and a= 3.77 s and b= 0.42 for τslow,2 (see Table 1) shown superimposed on the data points.
Ultra-slow recovery of Na+ channels in interneurons compared to granule cells
Because fast recovery from inactivation is different between some types of interneurons and principal neurons (Martina & Jonas, 1997) we have determined whether similar differences can also be found with respect to ultra-slow inactivation. To this end, we have performed nucleated patch recordings from DGCs (Fig. 6A1) hilar neurons (Fig. 6A2) and basket cells (Fig. 6A3) in rats. Current clamp recordings revealed a typical regular spiking pattern for granule cells (Fig. 6A1; see also Lübke et al. 1998). Hilar neurons showed a similar pattern, indicating that they may correspond to mossy cells (Fig. 6A2; see also Lübke et al. 1998). Basket cells showed a typical fast-spiking discharge behaviour (Fig. 6A3; see also Lübke et al. 1998). Since Na+ currents recorded in nucleated patches showed some decrease in amplitude over prolonged time periods, the evaluation of τslow,2 proved to be difficult. Therefore, in this set of experiments, we have compared DGCs, hilar neurons and basket cells only with respect to τslow,1, and have fitted the recovery process with only one exponential. As shown for isolated DGCs, an increasing fraction of Na+ current was inactivated following more prolonged depolarisation (Fig. 6B and C; n= 5 nucleated patches in all experiments). In addition, τslow,1 was related to the duration of the prepulse in all three cell types (Fig. 6D). As in whole-cell recordings, this relationship was described by a power law function τ(t) =a (t/a)b with a= 2.3 s and b= 0.48 for DGCs, a= 2.57 s and b= 0.49 for hilar neurons and a= 3.54 s and b= 0.39 for basket cells (fit superimposed on the data points). Thus, in contrast to the differences in fast recovery from inactivation described between interneurons and principal cells (Martina & Jonas, 1997), we could observe no such difference in ultra-slow inactivation between granule cells, hilar neurons and basket cells (Fig. 6C and D).
Figure 6. Ultra-slow recovery of rat Na+ channels in nucleated patches from granule cells, hilar neurons and basket cells.

A1-3, whole-cell current clamp recordings from a representative DGC (A1), hilar neuron (A2) and basket cell (A3) in rats. B 1-3, nucleated patch recordings from a representative DGC (B 1), hilar neuron (B 2) and basket cell (B 3) in rats. C, fraction of available Na+ current as a function of prepulse duration in DGCs (□), hilar neurons (△) and basket cells (○). D, because Na+ currents recorded in nucleated patches showed some decrease in amplitude over prolonged time periods, τslow,2 could not easily be evaluated. Fitting of the recovery process was therefore performed with only one exponential corresponding to the faster time constant, τslow,1. The time constant τslow,1 was then plotted against the duration of the conditioning prepulse for all 3 cell types (n= 5 for all data points). As in whole-cell recordings, this relationship was well described by the power law function τ(t) =a (t /a)b with a= 2.3 s and b= 0.48 for DGCs, a= 2.57 s and b= 0.49 for hilar neurons and a= 3.54 s and b= 0.39 for basket cells shown superimposed on the data points.
Ultra-slow recovery of Na+ channels in human DGCs
Finally, we have exploited the unique opportunity to perform electrophysiological measurements on DGCs isolated from structurally normal human hippocampus to investigate whether properties of ultra-slow inactivation are conserved not only in different cell types, but also across different species. We find that prolonged depolarisation also induces ultra-slow recovery in human DGCs (Fig. 7A andB; protocols and data display as in Fig. 2; n= 3, 4, 4, 2, 3 and 3 for depolarisations of 0.01, 1, 10, 30, 100 and 300 s respectively). The fraction of Na+ channels showing slow recovery also increased steeply with the duration of the conditioning depolarisation and did not prove to be significantly different from rat DGCs (Fig. 7B, inset). Likewise, the time constants of recovery for the various durations of the conditioning depolarisations were not statistically different from the corresponding values measured in rat DGCs (human data shown in Fig. 7C). Accordingly, the values obtained by fitting the data in Fig. 7C by the power law function were comparable in rat and human DGCs (values shown in Table 1). Thus, ultra-slow recovery is quantitatively similar between rat and human species.
Figure 7. Ultra-slow recovery from inactivation of Na+ channels in human DGCs.
A1-A3, a conditioning pulse to -10 mV was applied for various durations (10, 100 or 300 s), as in Fig. 2. The time course of ultra-slow recovery from inactivation was monitored by a series of brief test pulses with a frequency of 0.33 Hz until the Na+ current amplitude reached saturation (Imax). B, the current amplitude during recovery of the Na+ current was normalised to Imax, yielding the fraction of available Na+ current. The normalised values were plotted against recovery time for various prepulse durations (0.01, 1, 10, 30, 100 and 300 s with n= 3, 4, 4, 2, 3 and 3, respectively). The fraction of available Na+ currents was calculated as the ratio of peak current during the first test pulse divided by Imax. As in rat DGCs, the fraction of Na+ channels showing slow recovery increases steeply with prepulse duration. C, with prepulse durations from 10-300 s, the recovery from inactivation was fitted by a biexponential function, with the two time constants τslow,1 (○) and τslow,2 (△). The relationship between the duration of prior depolarisation t and recovery time constants τ was fitted by a power law function of the form: τ(t) =a (t/a)b with a= 0.63 s and b= 0.44 for τslow,1 and a= 25 s and b= 0.37 for τslow,2 (see Table 1) shown superimposed on the data points.
DISCUSSION
The availability of Na+ channels for activation is one of the principal determinants of firing behaviour in neurons and is determined by fast, as well as slow, inactivation processes. Slow inactivation processes are particularly interesting because they provide a mechanism by which the membrane potential can influence availability of Na+ channels over more prolonged time scales. Fast inactivation processes are demonstrably diverse in different cell types and subcellular compartments, but it is unclear whether slow inactivation processes show a similarly wide spectrum of properties. Therefore, we have carefully investigated the interrelationship between membrane potential and Na+ channel availability in different hippocampal cell types.
Ultra-slow recovery from inactivation in hippocampal neurons
First, we have shown that prolonged depolarisation results in entry of Na+ channels into an inactivated state from which recovery is slow. The proportion of inactivated channels increases with both the duration and the magnitude of depolarisation. The time course of recovery, on the other hand, depends mainly on the duration of the prior depolarisation, with longer depolarisations resulting in slower recovery. The relation between time constants of ultra-slow recovery on the one hand, and the duration of the depolarisation on the other hand, could be readily fitted with a power law function, similar to cloned Na+ channels (Toib et al. 1998). The scaling power b in the power law function τ(t) =a (t/a)b was in the range of 0.30-0.62 (see Table 1) for τslow,1 and τslow,2 in rat and human DGCs, values roughly comparable to those obtained for cloned NaII and NaIIA channels (b= 0.8 and 0.5, respectively) (Toib et al. 1998). The factor a, when fitted in an identical fashion as described by Toib et al. (1998) (τ(t) =a t b), proved to be in a range of 7.7- 9.1 for τslow,2, values considerably higher than those reported for NaII a = 0.3 or NaIIA channels a = 2.6 (Toib et al. 1998). These differences could simply be due to the fact that hippocampal pyramidal cells, as well as DGCs, do not display NaII channels in their somatic membrane, while NaI is expressed at high levels (Westenbroek et al. 1989). Thus, the NaI subunit, possibly in conjunction with other α subunits (Black et al. 1994; Schaller & Caldwell, 2000), may be assumed to underlie the current measured in DGCs. This suggests that the power law relationship described by Toib et al. (1998) is not confined to NaII and IIA channels, but may rather be a more general feature of Na+ channels expressed in native neurons.
Ultra-slow recovery is conserved in different hippocampal neuron types
Because fast inactivation and recovery processes have been shown to be different in interneurons compared to granule cells, we expected that this diversity might also be reflected in ultra-slow recovery from inactivation. To our surprise, ultra-slow recovery from inactivation proved to be quantitatively very similar in hilar neurons, basket cells and DGCs. In particular, the scaling power b proved to be quite similar in these different cell types (0.48, 0.49 and 0.39 for DGCs, hilar neurons and basket cells, respectively). This finding is in marked contrast to the intriguing differences in fast Na+ channel recovery from inactivation described by Martina & Jonas (1997). This finding is interesting primarily because granule neurons usually fire only brief series of action potentials in vivo, but interneurons fire in a more sustained manner. Since slow inactivation is similar in the investigated cell types, this suggests that a larger fraction of channels would be inactivated in fast-spiking interneurons than, for example, in granule neurons. Thus, identical properties of slow inactivation would be expected to have very different consequences in these different cell types.
Ultra-slow inactivation is conserved between species
The remarkable similarity observed between interneurons and DGCs extends also to between-species comparison: ultra-slow recovery in DGCs isolated from human and rat hippocampus was found to be virtually identical. It is tempting to speculate that the scaling relationship between activity and availability may be a property that is functionally so important that it might be conserved across species and different cell types. This consideration is supported by the presence of a very similar scaling relationship in muscle Na+ channels. A skeletal muscle Na+ channel mutation underlying hyperkalaemic periodic paralysis leads to defective scaling, suggesting that this feature is also crucial for function in skeletal muscle (Melamed-Frank & Marom, 1999).
Models describing scaling
Scaling relationships similar to those we have described here in native cells can be obtained by assuming a model with a number of linearly interlinked inactivated states I1-In (Toib et al. 1998) according to:
where A is the available state. In the event of prolonged depolarisation, the inactivated states absorb increasing numbers of channels, with progressively more channels entering remote inactivated states. Upon hyperpolarisation, this relationship is reversed, and the available state A recovers channels. The time course of this recovery would in this case be slower if a channel has entered a more remote inactivated state (e.g. I4vs. I2). Such models can give rise to the type of scaling in which the time course of recovery is dependent on the duration of the inactivating pulse (Millhauser et al. 1988). From our data, we cannot draw conclusions about the number of inactivated states. Conceivably, the power law relationship we describe may be valid beyond the range of depolarisations we have employed, implying that more prolonged depolarisation might uncover progressively slower recovery rates. There may be a limit on how slow recovery processes can get, but this may be difficult to ascertain experimentally due to the extended duration of the necessary experiments.
Regardless of the number of involved states, an interesting feature of our data is that over a large voltage range the prepulse voltage used to induce inactivation does not affect the time course of recovery. This suggests that the entry into slowly inactivating states (I) is controlled by at least one non-voltage-dependent step that is rate limiting. This fact is also reflected in the voltage dependence of the recovery process itself. Varying the membrane potential during recovery did not affect the recovery time course, also supporting a voltage-independent transition from inactivated back to available states.
Structural basis of ultra-slow inactivation
The structural basis of ultra-slow inactivation and scaling is much less clear than that of fast inactivation. Fast inactivation seems to involve a conformational change of amino acids in the III-IV interdomain linker (Stühmer et al. 1989). Site-directed mutagenesis experiments, as well as analysis of mutant sodium channels, have suggested that slow inactivation of Na+ channels may also involve a structural rearrangement of amino acid residues in the outer pore region (Tomaselli et al. 1995). On the other hand, scaling of inactivation rates is impaired in muscle Na+ channels displaying a point mutation in T704M, located in the fifth transmembrane region of domain II of the α subunit (Melamed-Frank & Marom, 1999). Thus, it seems as if the structural basis of slow inactivation and scaling may be more complex than that of fast inactivation.
The fact that Na+ channel mutations can disrupt scaling and the observation that scaling is also observed in detached macropatches from oocytes expressing rat brain NaII channels, suggest that scaling is most probably an intrinsic feature of the Na+ channel protein. Nevertheless, the possibility cannot be excluded that modulation of the channel protein by signalling cascades, accessory subunits or associated cytoskeletal proteins may modulate slow inactivation processes.
Functional implications of ultra-slow recovery from inactivation
There are several important functional implications of these biophysical features of voltage-dependent Na+ channels in native neurons. The close relationship between the rate of ultra-slow recovery and the duration or frequency of prior depolarisation provides neurons with a mechanism by which the prior history of the membrane potential can modulate the availability of Na+ channels. Thus, the biophysical properties of channels can result in a complex interrelationship between availability of Na+ channels and membrane potential in native hippocampal neurons. As a consequence, Na+ channels may participate in signal integration not only on a time scale of milliseconds, but also minutes.
Nevertheless, it remains questionable whether such mechanisms could be physiologically relevant if they require prolonged depolarisation. Three findings support the notion that ultra-slow recovery may be functionally important. Firstly, we have shown that action potential-like brief depolarisations can induce slow inactivation, with a similar power law relationship between the frequency of depolarisation and the time constant of recovery. This suggests that the biophysical properties of Na+ channels may allow them to retain a trace of average discharge frequencies over seconds or even minutes. Secondly, the entry into inactivated states is possible at potentials as hyperpolarised as -50 mV, that are subthreshold for eliciting action potentials. Therefore, subthreshold membrane potential changes are already able to dynamically modulate the availability of Na+ channels. This may be particularly important in immature DGCs, in which the membrane potential is low (authors' unpublished data; Wang et al. 2000). Indeed, these neurons are only able to fire one or two broad action potentials in response to depolarising current injection. While these features almost certainly also reflect the properties of other membrane currents, limited availability of Na+ channels can certainly contribute to spike broadening as well as the inability to generate prolonged trains of action potentials. This consideration may also extend to other cell types in the mature CNS which show a more depolarised membrane potential in the range in which slow inactivation occurs. Finally, findings in disease models show that, in hippocampal neurons in vivo, very prolonged depolarisations of 10-20 s take place, which would clearly be sufficient to induce substantial slow inactivation (Bragin et al. 1997). Thus, it is not far-fetched to assume that slow inactivation of Na+ channels might be important to limit high-frequency neuronal firing after prolonged discharges under pathophysiological conditions.
The biophysical features shown here for the Na+ channel are not shared by all ion channels. For instance, not all transient K+ channels show a scaling relationship similar to Na+ channels (Toib et al. 1998;Marom, 1998). We have found that different A-type K+ channels are expressed in DGCs (authors' unpublished observations) but A-type channels are absent from hippocampal interneurons (Martina et al. 1998). In cells in which A-type and Na+ channels are coexpressed, depolarisation may differentially affect recovery from inactivation of these current components. Because multiple voltage-dependent conductances orchestrate the firing behaviour of neurons, the different biophysical properties of slow inactivation of different ion channels adds a layer of complexity to the ways in which membrane potential changes can produce long-term changes in excitability.
Acknowledgments
This research was supported by a University of Bonn Medical Center grant ‘BONFOR’, the German-Israel collaborative research program of the MOS and the BMBF and the graduate program of the Deutsche Forschungsgemeinschaft ‘Pathogenese von Krankheiten des Nervensystems’. We thank S. Marom for valuable comments on the manuscript.
References
- Barry PH, Lynch JW. Liquid junction potentials and small cell effects in patch-clamp analysis. Journal of Membrane Biology. 1991;121:101–117. doi: 10.1007/BF01870526. [DOI] [PubMed] [Google Scholar]
- Black JA, Yokoyama S, Higashida H, Ransom BR, Waxman SG. Sodium channel mRNAs I, II and III in the CNS: cell-specific expression. Molecular Brain Research. 1994;22:275–289. doi: 10.1016/0169-328x(94)90056-6. [DOI] [PubMed] [Google Scholar]
- Bragin A, Penttonen M, Buzsaki G. Termination of epileptic afterdischarge in the hippocampus. Journal of Neuroscience. 1997;17:2567–2579. doi: 10.1523/JNEUROSCI.17-07-02567.1997. [DOI] [PMC free article] [PubMed] [Google Scholar]
- Catterall WA. Cellular and molecular biology of voltage-gated sodium channels. Physiological Reviews. 1992;72(suppl.):15–48S. doi: 10.1152/physrev.1992.72.suppl_4.S15. [DOI] [PubMed] [Google Scholar]
- Colbert CM, Johnston D. Axonal action-potential inititation and Na+ channel densitites in the soma and axon initial segment of subicular pyramidal neurons. Journal of Neuroscience. 1996;16:6676–6686. doi: 10.1523/JNEUROSCI.16-21-06676.1996. [DOI] [PMC free article] [PubMed] [Google Scholar]
- Colbert CM, Magee JC, Hoffman DA, Johnston D. Slow recovery from inactivation of Na+ channels underlies the activity-dependent attenuation of dendritic action potentials in hippocampal CA1 pyramidal neurons. Journal of Neuroscience. 1997;17:6512–6521. doi: 10.1523/JNEUROSCI.17-17-06512.1997. [DOI] [PMC free article] [PubMed] [Google Scholar]
- Cummins TR, Sigworth FJ. Impaired slow inactivation in mutant sodium channels. Biophysical Journal. 1996;71:227–236. doi: 10.1016/S0006-3495(96)79219-6. [DOI] [PMC free article] [PubMed] [Google Scholar]
- Fleidervish IA, Friedman A, Gutnick MJ. Slow inactivation of Na+ current and slow cumulative spike adaptation in mouse and guinea-pig neocortical neurones in slices. Journal of Physiology. 1996;493:83–97. doi: 10.1113/jphysiol.1996.sp021366. [DOI] [PMC free article] [PubMed] [Google Scholar]
- Fleidervish IA, Gutnick MJ. Kinetics of slow inactivation of persistent sodium current in layer V neurons of mouse neocortical slices. Journal of Neurophysiology. 1996;76:2125–2130. doi: 10.1152/jn.1996.76.3.2125. [DOI] [PubMed] [Google Scholar]
- Golding NL, Spruston N. Dendritic sodium spikes are variable triggers of axonal action potentials in hippocampal CA1 pyramidal neurons. Neuron. 1998;21:1189–1200. doi: 10.1016/s0896-6273(00)80635-2. [DOI] [PubMed] [Google Scholar]
- Hamill OP, Marty A, Neher E, Sakmann B, Sigworth FJ. Improved patch-clamp techniques for high-resolution current recording from cells and cell-free membrane patches. Pflügers Archiv. 1981;391:85–100. doi: 10.1007/BF00656997. [DOI] [PubMed] [Google Scholar]
- Hayward LJ, Brown RH, Jr, Cannon SC. Slow inactivation differs among mutant Na+ channels associated with myotonia and periodic paralysis. Biophysical Journal. 1997;72:1204–1219. doi: 10.1016/S0006-3495(97)78768-X. [DOI] [PMC free article] [PubMed] [Google Scholar]
- Isom LL, De Jongh KS, Catterall WA. Auxiliary subunits of voltage-gated ion channels. Neuron. 1994;12:1183–1194. doi: 10.1016/0896-6273(94)90436-7. [DOI] [PubMed] [Google Scholar]
- Jung HY, Mickus T, Spruston N. Prolonged sodium channel inactivation contributes to dendritic action potential attenuation in hippocampal pyramidal neurons. Journal of Neuroscience. 1997;17:6639–6646. doi: 10.1523/JNEUROSCI.17-17-06639.1997. [DOI] [PMC free article] [PubMed] [Google Scholar]
- Lübke J, Frotscher M, Spruston N. Specialized electrophysiological properties of anatomically identified neurons in the hilar region of the rat fascia dentata. Journal of Neurophysiology. 1998;79:1518–1534. doi: 10.1152/jn.1998.79.3.1518. [DOI] [PubMed] [Google Scholar]
- Marom S. Slow changes in the availability of voltage-gated ion channels: effects on the dynamics of excitable membranes. Journal of Membrane Biology. 1998;161:105–113. doi: 10.1007/s002329900318. [DOI] [PubMed] [Google Scholar]
- Martina M, Jonas P. Functional differences in Na+ channel gating between fast-spiking interneurones and principal neurones of rat hippocampus. Journal of Physiology. 1997;505:593–603. doi: 10.1111/j.1469-7793.1997.593ba.x. [DOI] [PMC free article] [PubMed] [Google Scholar]
- Martina M, Schultz JH, Ehmke H, Monyer H, Jonas P. Functional and molecular differences between voltage-gated K+ channels of fast-spiking interneurons and pyramidal neurons of rat hippocampus. Journal of Neuroscience. 1998;18:8111–8125. doi: 10.1523/JNEUROSCI.18-20-08111.1998. [DOI] [PMC free article] [PubMed] [Google Scholar]
- Melamed-Frank M, Marom S. A global defect in scaling relationship between electrical activity and availability of muscle sodium channels in hyperkalemic periodic paralysis. Pflügers Archiv. 1999;438:213–217. doi: 10.1007/s004240050900. [DOI] [PubMed] [Google Scholar]
- Mickus T, Jung H, Spruston N. Properties of slow, cumulative sodium channel inactivation in rat hippocampal CA1 pyramidal neurons. Biophysical Journal. 1999;76:846–860. doi: 10.1016/S0006-3495(99)77248-6. [DOI] [PMC free article] [PubMed] [Google Scholar]
- Millhauser GL, Salpeter EE, Oswald RE. Diffusion models of ion-channel gating and the origin of power-law distributions from single-channel recording. Proceedings of the National Academy of Sciences of the USA. 1988;85:1503–1507. doi: 10.1073/pnas.85.5.1503. [DOI] [PMC free article] [PubMed] [Google Scholar]
- Nagerl UV, Mody I, Jeub M, Lie AA, Elger CE, Beck H. Surviving granule cells of the sclerotic human hippocampus have reduced Ca2+ influx because of a loss of calbindin-D(28k) in temporal lobe epilepsy. Journal of Neuroscience. 2000;20:1831–1836. doi: 10.1523/JNEUROSCI.20-05-01831.2000. [DOI] [PMC free article] [PubMed] [Google Scholar]
- Neher E. Correction for liquid junction potentials in patch-clamp experiments. In: Rudy B, Iverson LE, editors. Methods in Enzymology. San Diego: Academic Press; 1999. pp. 123–131. [DOI] [PubMed] [Google Scholar]
- Raman IM, Bean BP. Ionic currents underlying spontaneous action potentials in isolated cerebellar Purkinje neurons. Journal of Neuroscience. 1999;19:1663–1674. doi: 10.1523/JNEUROSCI.19-05-01663.1999. [DOI] [PMC free article] [PubMed] [Google Scholar]
- Ruben PC, Starkus JG, Rayner MD. Steady-state availability of sodium channels. Interactions between activation and slow inactivation. Biophysical Journal. 1992;61:941–955. doi: 10.1016/S0006-3495(92)81901-X. [DOI] [PMC free article] [PubMed] [Google Scholar]
- Rudy B. Slow inactivation of the sodium conductance in squid giant axons. Pronase resistance. Journal of Physiology. 1978;283:1–21. doi: 10.1113/jphysiol.1978.sp012485. [DOI] [PMC free article] [PubMed] [Google Scholar]
- Sather W, Dieudonné S, Macdonald JF, Ascher P. Activation and desensitization of N-methyl-d-aspartate receptors in nucleated outside-out patches from mouse neurones. Journal of Physiology. 1992;450:643–672. doi: 10.1113/jphysiol.1992.sp019148. [DOI] [PMC free article] [PubMed] [Google Scholar]
- Schaller KL, Caldwell JH. Developmental and regional expression of sodium channel isoform NaCh6 in the rat central nervous system. Journal of Comparative Neurology. 2000;420:84–97. [PubMed] [Google Scholar]
- Stuart G, Schiller J, Sakmann B. Action potential initiation and propagation in rat neocortical pyramidal neurons. Journal of Physiology. 1997;505:617–632. doi: 10.1111/j.1469-7793.1997.617ba.x. [DOI] [PMC free article] [PubMed] [Google Scholar]
- Stuart GJ, Dodt H-U, Sakmann B. Patch-clamp recordings from the soma and dendrites of neurons in brain slices using infrared video microscopy. Pflügers Archiv. 1993;423:511–518. doi: 10.1007/BF00374949. [DOI] [PubMed] [Google Scholar]
- Stuart GJ, Sakmann B. Active propagation of somatic action potentials into neocortical pyramidal cell dendrites. Nature. 1994;367:69–72. doi: 10.1038/367069a0. [DOI] [PubMed] [Google Scholar]
- Stühmer W, Conti F, Suzuki H, Wang X, Noda M, Yahagi N, Kubo H, Numa S. Structural parts involved in activation and inactivation of the sodium channel. Nature. 1989;339:597–603. doi: 10.1038/339597a0. [DOI] [PubMed] [Google Scholar]
- Toib A, Lyakhov V, Marom S. Interaction between duration of activity and time course of recovery from slow inactivation in mammalian brain Na+ channels. Journal of Neuroscience. 1998;18:1893–1903. doi: 10.1523/JNEUROSCI.18-05-01893.1998. [DOI] [PMC free article] [PubMed] [Google Scholar]
- Tomaselli GF, Chiamvimonvat N, Nuss HB, Balser JR, Perez-Garcia MT, Xu RH, Orias DW, Backx PH, Marban E. A mutation in the pore of the sodium channel alters gating. Biophysicl Journal. 1995;68:1814–1827. doi: 10.1016/S0006-3495(95)80358-9. [DOI] [PMC free article] [PubMed] [Google Scholar]
- Wang S, Scott BW, Wojtowicz JM. Heterogenous properties of dentate granule neurons in the adult rat. Journal of Neurobiology. 2000;42:248–257. [PubMed] [Google Scholar]
- Westenbroek RE, Merrick DK, Catterall WA. Differential subcellular localization of the RI and RII Na+ channel subtypes in central neurons. Neuron. 1989;3:695–704. doi: 10.1016/0896-6273(89)90238-9. [DOI] [PubMed] [Google Scholar]