

Abstract
We studied the relationship between exocytosis and endocytosis in rat pituitary somatotrophs using patch-clamp capacitance, FM1-43 fluorescence imaging and amperometry.
Stimulation of exocytosis through voltage-dependent Ca2+ channels by depolarizations (1-5 s) increased the capacitance by 4.3 ± 0.9 % and the fluorescence by 6.6 ± 1.1 % (10 cells). The correlation between the capacitance and fluorescence changes indicated that the cell membrane and granule membrane added via exocytosis were stained with the membrane-bound fluorescent dye FM1-43 in a quantitatively similar manner.
Intracellular dialysis (0.5-4.5 min) with elevated Ca2+ (1.5-100 μm) evoked continuous exocytosis that was detected with a carbon fibre electrode from dopamine-loaded cells (10 cells) or as an increase in FM1-43 fluorescence (56 ± 10 %; 21 cells). Interestingly during Ca2+ dialysis the capacitance did not significantly change (2 ± 1 %; 31 cells), indicating that endocytosis efficiently retrieved increased cell membrane.
Sustained endocytosis was not blocked when the intracellular GTP (300 μm) was replaced with GTPγS. Replacing intracellular Ca2+ (100 μm) with Ba2+ (300 μm) or Sr2+ (200 μm), or reducing the pH of the intracellular solution from 7.2 to 6.2 did not block sustained endocytosis.
Our results suggest that pituitary somatotrophs have the ability to undergo continuous exocytosis and membrane retrieval that persist in whole-cell recordings.
Regulated secretion from neurons and neuroendocrine cells involves the exocytic fusion of secretory membranes with the plasma membrane. An endocytic process then retrieves the secretory membranes to preserve cell surface area and to allow the potential recycling of components of the secretory membrane. Numerous studies have led to the development of several models of the mechanisms involved in endocytic retrieval of secretory membrane. Different models employ various structural steps, different temporal coupling between exocytosis and endocytosis, as well as various requirements for regulatory factors such as intracellular Ca2+ (Thomas et al. 1993, 1994; Heinemann et al. 1994; De Camilli & Takei, 1996; Klingauf et al. 1998; Artalejo et al. 1998). The differences in the models probably reflect distinct biological mechanisms involved in the coupling of exocytosis to endocytosis in different cell types as well as distinct mechanisms for a single cell type under different conditions.
One experimental method used to study the relationship between exocytosis and endocytosis is recording membrane capacitance using a whole-cell voltage-clamp technique which yields sensitive measurements of cell surface area. Fusion of secretory granules with the plasma membrane can be detected as an increase in capacitance (Neher & Marty, 1982) since capacitance is linearly proportional to membrane area (about 10 fF μm−2. Similarly, endocytosis can be detected as a decrease in capacitance. Studies using this technique showed that prolonged stimulation of exocytosis evokes far more membrane fusion events than membrane retrieval events. For example, inclusion of free Ca2+ in the patch pipette to drive sustained stimulation of exocytosis in bovine chromaffin cells causes capacitance to increase up to ∼200 % (Penner et al. 1986; Augustine & Neher, 1992). Similar results have been observed in a variety of secretory cells including pituitary nerve terminals (Rosenboom & Lindau, 1994), anterior pituitary gonadotrophs (Tse et al. 1997) and lactotrophs (Zorec et al. 1991; Angleson et al. 1999), pituitary melanotrophs (Okano et al. 1993), pancreatic acinar cells (Giovannucci et al. 1998) and β-cells (Renstrom et al. 1997), PC12 cells (Kasai et al. 1996), and brown adipocytes (Pappone & Lee, 1996). Substantial increases in capacitance have also been observed in lymphoid cells such as neutrophils (Nusse & Lindau, 1988), eosinophils (Hartmann et al. 1995) and mast cells (Fernandez et al. 1984) in which activating GTP-binding proteins by including GTPγS in the patch pipette evokes exocytosis. In all these cell types stimulating sustained exocytosis by whole-cell intracellular dialysis with a secretagogue results in exocytosis that outpaces endocytosis.
Changes in cell capacitance reflect the net sum of exocytosis and endocytosis and therefore the voltage-clamp method cannot measure these processes independently. Another approach is to measure fluorescence of the dye FM1-43, which has been used extensively to study secretory activity (Cochilla et al. 1999). FM1-43 is almost non-fluorescent in water and its quantum yield increases by about 350 times on binding membranes (Betz et al. 1992). In the presence of dye, new membrane added by exocytosis becomes stained with the dye and the total FM1-43 fluorescence increases. Since any endocytosed membrane remains labelled with dye, subsequent membrane retrieval does not affect the total cellular fluorescence. FM1-43 fluorescence therefore provides a measure of the sum of all preceding exocytosis (Smith & Betz, 1996). The difference between FM1-43 fluorescence and capacitance should represent endocytosis. Indeed in bovine chromaffin cells simultaneous measurements of capacitance and FM1-43 fluorescence during Ca2+ dialysis revealed delayed endocytosis that appeared several minutes after Ca2+ entered the cell (Smith & Betz, 1996). This delayed endocytosis was observed as FM1-43 fluorescence continued to increase after the capacitance of the cell had stopped increasing.
In the present work we studied secretory activity in somatotrophs isolated from rat anterior pituitary glands, by monitoring whole-cell capacitance, FM1-43 fluorescence and amperometric currents produced when secretory products are released. We found that depolarizations (1-5 s) resulted in stable capacitance and FM1-43 fluorescence increases of up to 15 %. In contrast, continuous stimulation by dialysing free [Ca2+] (1.5-100 μm) in the cytosol triggered continuous exocytosis, as measured by FM1-43 fluorescence and amperometry, without a substantial increase in capacitance. This result indicates that somatotrophs are unique among neuroendocrine cells in that sustained endocytic activity coupled to sustained exocytic activity persists in the whole-cell configuration during dialysis with elevated Ca2+. This sustained endocytic activity was not blocked by experimental manipulations reported to inhibit endocytosis in various secretory cells. Specifically, replacing GTP with GTPγS, replacing Ca2+ with Ba2+ or Sr2+, or reducing the pH from 7.2 to 6.2 in the intracellular solution did not block sustained endocytosis.
METHODS
Cell preparation
Pituitary somatotrophs were obtained from male Sprague-Dawley rats (250-350 g) by enzymatic dispersion as previously described (Keller & Nussinovitch, 1996). The rats were first killed following continuous CO2 flux for 5 min. Rats were then decapitated using a small guillotine. Anterior lobes were removed from the rats and placed in F-12 medium (Sigma, St Louis, MO, USA). The lobes were minced and treated with a mixture of enzymes at 37 °C for about 40 min. The dispersed cells were then loaded on top of a discontinuous Percoll gradient. After centrifugation cells from the somatotroph-enriched band were plated on coverslips and cultured for up to 3 days. Cells were used for experiments after 1 day in culture.
Solutions
All experiments were performed with the external solution containing (mm): 140 NaCl, 2 KCl, 5 CaCl2, 1 MgCl2, 10 Hepes, 10 d-glucose and 4 μm FM1-43 (Molecular Probes, Eugene, OR, USA). For perfusion experiments on intact cells the external solution contained 100 nm growth hormone-releasing hormone (GHRH) or 70 mm KCl (NaCl was reduced to 70 mm). For patch-clamp depolarization experiments pipette solution contained (mm): 145 caesium d-glutamate, 8 NaCl, 1 MgCl2, 2 ATP-Mg, 0.3 GTP and 0.1 EGTA. In experiments using a similar pipette solution when intracellular [Ca2+] of somatotrophs was measured in the whole-cell configuration using the fluorescent dye indo-1 (0.1 mm), resting intracellular [Ca2+] was about 0.1 μm (Herrington & Hille, 1994). Since indo-1 and EGTA have a similar binding constant to Ca2+ (Grynkiewicz et al. 1985), we assumed that our pipette solution had an [Ca2+]i of 0.1 μm. To dialyse cells with higher [Ca2+]i we used a pipette solution containing 130 mm caesium d-glutamate, 8 NaCl, 1 MgCl2, 2 ATP-Mg2, 0.3 GTP and the mixtures of Ca2+ buffers and CaCl2 shown in Table 1. The concentrations of free ions were calculated using the program MaxChelator 4.6 (Cris Patton, Stanford University) assuming the Ca2+ and Mg2+ dissociation constants that are given in Augustine & Neher (1992). The pH of all solutions was 7.2. The osmolarity of external solutions was ∼300 mosmol l−1 and the osmolarity of pipette solutions was adjusted to 295- 300 mosmol l −1 with CsCl.
Table 1.
Mixtures of Ca2+ buffers and Ca2+ used for pipette dialysis experiments
| Buffer (5 mM) | [CaCl2] (mM) | Free [Ca2+]i (μM) |
|---|---|---|
| EGTA | 4.5 | 1.5 |
| HEDTA | 3.75 | 10 |
| NTA | 2.3 | 100 |
In experiments where we attempted to block endocytosis, 100 μm free [Ca2+]i pipette solution was made with the following modifications. GTPγS replaced GTP or ATPγS replaced ATP. In some experiments the protein kinase blocker staurosporine (0.5 μm) or 100 mm sucrose was added to the pipette solution. To make a solution with pH of 6.2 we used a mixture of 5 mm EGTA and 4.5 mm CaCl2 ([Ca2+]i∼100 μm). In other experiments the pipette solution contained free [Ba2+]i (300 μm, 5 mm BaCl2 and 5 mm EGTA) or [Sr2+]i (200 μm, 4.75 mm SrCl2 and 5 mm EGTA). The dissociation constant of EGTA for Ba2+ and Sr2+ was assumed to be 42.7 μm (Martell & Smith, 1974). All chemicals were obtained from Sigma.
Capacitance and conductance measurements
Cell capacitance was measured using whole-cell patch clamp with a holding potential of -80 mV (corrected for liquid junction potential). When depolarization was used to stimulate cells, capacitance was measured with a sine wave (800 Hz, peak amplitude 30 mV) using Pulse Control software (Horrigan & Bookman, 1994) in conjunction with an ITC16 interface (Instrutech, Greatneck, NY, USA). After obtaining whole-cell configuration, we compensated for cell capacitance and access resistance using an Axopatch-1B patch-clamp amplifier (Axon Instruments, Foster City, CA, USA). Capacitance measurements were acquired every 50 ms before and after depolarizations.
In experiments where different [Ca2+]i were dialysed, we measured capacitance using eight hyperpolarizing pulses (VP= -20 mV; 4 ms). The current responses were averaged and inverted, and then fitted to the equation: I(t) =(I0 - Iss) exp(-t/τ) +Iss. From three fitted parameters we obtained the membrane capacitance, access resistance and membrane conductance (Lindau & Neher, 1988). This procedure was repeated every 3 s. During recordings the access resistance typically increased (5-25 MΩ). The recordings were stopped if membrane conductance exceeded 1 nS.
Fluorescence imaging and analysis
For patch-clamp experiments the cells were viewed with a Nikon Diaphot 200 microscope through a Nikon × 60 water immersion objective (NA 1.2). Fluorescence imaging of FM1-43 stained cells was performed with band pass filters for excitation (peak 480 nm) and emission (peak 535 nm). Images were acquired once every 5-15 s, with a PXL1400 cooled CCD camera (Photometrics, AZ, USA) controlled by Innovision software (Raleigh, NC, USA) on a Silicon Graphics Indigo2 computer (Sunnyvale, CA, USA). For external perfusion experiments on intact cells, images were acquired with an Olympus × 100 oil immersion objective (NA 1.4). The recording chamber was perfused constantly by gravity feed and solution changes required about 10 s. The pixel sizes with the × 60 and × 100 objectives were 110 and 67 nm, respectively.
Quantitative analyses of fluorescence images were performed on a Macintosh computer using NIH Image (NIH, MD, USA) and IgorPro3 (WaveMetrics, OR, USA) software. Total cellular FM1-43 fluorescence was measured from the region containing the cell. For background subtraction, fluorescence was measured in the same way from regions containing no cells. After background subtraction the total fluorescence was normalized to values obtained before or immediately after achieving the whole-cell configuration. In depolarization experiments the fluorescence was measured from a 1 μm wide rim around the cell surface. To reduce noise, normalized fluorescence was averaged with a binomial algorithm using IgorPro 3.
For cells dialysed with 0.1 μm[Ca2+] fluorescence rates were correlated with the mean membrane conductance Gm (see Fig. 3b). For all dialysis experiments, fluorescence rates and Gm were measured in the interval where FM1-43 fluorescence continuously increased. The measured Gm was used to read a rate from the linear fit in Fig. 3B. To obtain the corrected fluorescence rate, this rate was subtracted from the measured fluorescence rate. The final fluorescence change was corrected in a similar manner. The fluorescence change due to the effect of Gm was calculated as a product of the rate read from Fig. 3B and a time interval where fluorescence continuously increased. This value was then subtracted from the final fluorescence change.
Figure 3. Ca2+ dialysis of somatotrophs evokes continuous increases in FM1-43 fluorescence without significant capacitance changes.

A, different [Ca2+]i (in μm indicated at the top) were dialysed through the patch pipette. Capacitance (thick line) and FM1-43 fluorescence (○) are shown as percentage of control values before break-in. Thin lines indicate corrected fluorescence. Note the discrepancy between capacitance and FM1-43 fluorescence. The bottom traces show membrane conductance during dialysis. B, fluorescence rates are plotted versus mean membrane conductance, Gm, from cells dialysed with 0.1 μm[Ca2+]i. Fluorescence rates and Gm were measured in the interval where FM1-43 fluorescence continuously increased. The straight line is a linear fit to the data (correlation coefficient is 0.93). C, corrected fluorescence rates are plotted versus[Ca2+]i. The rate at 100 μm was different from the rate at 1.5 μm(P < 0.12) or 10 μm(P < 0.18), and the rate at 10 μm was different from the rate at 1.5 μm(P < 0.15). D, final changes in FM1-43 fluorescence for different [Ca2+]i are plotted versus final capacitance changes. The time point at which the data were obtained varied from 0.5 to 4.5 min. The continuous line is the unity line and the dashed line is the best fit from the depolarization experiments taken from Fig. 2D. Note that FM1-43 fluorescence is always larger than capacitance (n = 21 cells).
Dopamine loading and amperometry
Secretory granules of rat pituitary somatotrophs were loaded with dopamine. Prior to amperometric recordings the culture medium was exchanged with a solution containing (mm): 105 NaCl, 5 KCl, 2 CaCl2, 1 l-ascorbic acid, 10 Hepes, 10 d-glucose and 70 dopamine-HCl (pH 7.25; 325 mosmol l−1). Cells were incubated for about 40 min at 37 °C in an incubator (5 % CO2). Similar procedures have been used in pancreatic β-cells (Zhou & Misler, 1996), pituitary gonadotrophs (Billiard et al. 1997) and in different endocrine cells (Kim et al. 2000).
Dopamine-treated cells were dialysed with 100 μm[Ca2+]. After obtaining a gigaohm seal onto a cell, a polypropylene-insulated carbon fibre electrode (CFE, Dagan Corporation, Minneapolis, MN, USA) filled with 3 m KCl was placed close to the cell without touching it. During recordings the CFE was held at 800 mV with an Axopatch 200B amplifier (Axon Instruments). Currents were filtered at 100 Hz or 2.1 kHz and then acquired every 0.3 ms using Pulse Control software. Amperometric spikes were analysed with IgorPro3. The spikes were included in amplitude histograms if their amplitudes were greater than three times the standard deviation of current fluctuations before break-in. Histogram bin width was 0.3 pA.
All experiments were performed at 24 °C. Data are expressed as means ±s.e.m. Results were compared using Student's t test on paired or unpaired data.
RESULTS
GHRH and depolarization evoke exocytosis in intact somatotrophs
We stimulated intact cells with growth hormone releasing hormone (GHRH). The left panel in Fig. 1A shows a fluorescence image of an intact cell in the presence of FM1-43. Since FM1-43 does not penetrate membranes and is fluorescent only when bound to membranes (Betz et al. 1992), only the cell membrane is stained in this condition. After a 5 min stimulation with GHRH, FM1-43 fluorescence increased by 120 % as secretory granule membranes fused with the plasma membrane (Fig. 1A, right panel). In 18 out of 22 cells GHRH stimulation evoked an increase in FM1-43 fluorescence (93 ± 17 %, Fig. 1b). Since GHRH-induced exocytosis occurs only in pituitary somatotrophs (Brazeau et al. 1982) this result suggests that at least 80 % of the cells used here were somatotrophs. Stimulation of growth hormone (GH) secretion from rat somatotrophs with GHRH depends on Ca2+ influx through voltage-gated Ca2+ channels (Lussier et al. 1991). We stimulated the cells with GHRH in the presence of Cd2+ (0.5 mm), a non-selective blocker of voltage-gated Ca2+ channels. FM1-43 fluorescence change was 9 ± 4 % (5 cells) suggesting that Ca2+ entry through voltage-gated Ca2+ channels was responsible for GHRH-evoked exocytosis in somatotrophs. We also stimulated intact cells with prolonged depolarizations to activate Ca2+ channels. After stimulation with high extracellular K+ (70 mm) FM1-43 fluorescence increased by 87 ± 23 % over 5 min (26 cells, Fig. 1C). To check if the dye remains on the cell surface or is internalized, after the stimulation we washed out FM1-43 (Fig. 1D). Cell membrane fluorescence was washed out with a time constant of 36 ± 3 s (12 cells). The fluorescence that remained after washing (32 ± 7 %) was about the same as the fluorescence increase from the preceding stimulation (25 ± 4 %) indicating that most of the secretory membrane was internalized.
Figure 1. GHRH and high K+ increase FM1-43 fluorescence in somatotrophs.
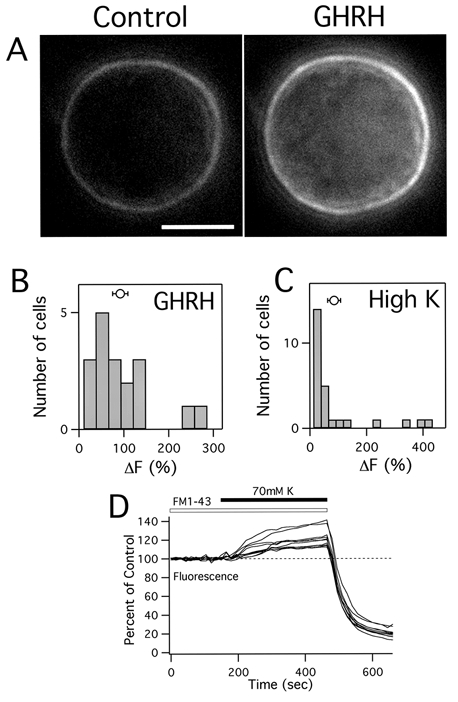
A, the left panel shows a fluorescence image of an anterior pituitary somatotroph in the presence of 4 μm FM1-43. The scale bar is 5 μm. The cell was stimulated with 100 nm GHRH for 5 min (right panel). Note that total cellular fluorescence increased. B and C, histogram of final changes in FM1-43 fluorescence after stimulation with GHRH (B) or 70 mm KCl (C). Circles show means ±s.e.m.D, the total fluorescence from 10 cells during stimulation with 70 mm KCl and after washing with standard external solution. Fluorescence decay was fitted with a single exponential time constant. Note that the fluorescence increase at the end of the stimulation is about the same as fluorescence that remained after dye washout.
Depolarization evokes exocytosis in somatotrophs during whole-cell recordings
In another set of experiments cells were depolarized in the whole-cell configuration and we simultaneously measured FM1-43 fluorescence and capacitance. FM1-43 stains granule and cell membrane in bovine chromaffin cells in a quantitatively similar manner (Smith & Betz, 1996). In pituitary lactotrophs in addition to staining membranes FM1-43 was reported to stain granule content (Angleson et al. 1999). To determine the relationship between granule and cell membrane staining with FM1-43 we measured the fluorescence from a 1 μm wide rim of the cell surface. In depolarization experiments (10 cells; 18 runs) we never observed localized fluorescence changes and therefore assumed that fusion of granules with the cell membrane occurred uniformly on the cell membrane. Examples from three cells are shown in Fig. 2. Cells were depolarized with a single pulse (Fig. 2A and b) or a train of pulses (Fig. 2C). Depolarizations of 1 s or longer were required to give detectable capacitance increases. Adding new membrane evoked increases in both FM1-43 fluorescence and capacitance. Typically both changes were stable and did not change in the absence of new stimulation, and were used to establish the relationship between the capacitance and FM1-43 fluorescence. Figure 2D shows that changes in FM1-43 fluorescence are correlated to changes in capacitance, although on average the change in fluorescence was larger than the change in capacitance by about 30 % indicating that some endocytosis may have occurred during the depolarizations. These results are consistent with the idea that Ca2+ influx induces exocytic activity in pituitary somatotrophs and suggest that the relationship between capacitance and FM1-43 fluorescence is of the order of one to one.
Figure 2. Depolarization increases FM1-43 fluorescence and capacitance in somatotrophs.

Cells were depolarized to 30 mV for 1 s (A) or 5 s (B) at the times indicated by the arrows. Capacitance (continuous line) and FM1-43 fluorescence (○) are shown as a percentage of control values before stimulation. Fluorescence was measured from a 1 μm wide rim around the cell surface. C, a train of eight depolarizations (2 s; 0.2 Hz) to 30 mV was given. D, changes in FM1-43 fluorescence are plotted versus capacitance changes (n = 10 cells). The continuous line is the unity line and the dashed line is the best fit of the data points (slope 1.3). Note that most data points lie close to or above the unity line.
Continuous exocytosis and endocytosis is induced with Ca2+ dialysis
Stimulating intact somatotrophs with GHRH produced a fluorescence change of about 100 % indicating that a large number of granules underwent fusion with the plasma membrane (Fig. 1b). We sought a way to stimulate the cells in the whole-cell configuration in order to produce comparable fluorescence changes. To do so we dialysed cells with different [Ca2+]i through the patch pipette. Figure 3A shows FM1-43 fluorescence and capacitance during Ca2+ dialysis (0.1-100 μm). For all [Ca2+]i used during dialysis, FM1-43 fluorescence progressively increased; however, capacitance changed little, if at all. This unexpected result raised a question about possible routes of FM1-43 entry other than exocytic granule staining. In bipolar nerve terminals FM1-43 entered the cell even at the non-stimulating [Ca2+]i of 0.1 μm (Rouze & Schwartz, 1998) suggesting that FM1-43 may enter the cell through a membrane channel and then stain internal membranes. To test this possibility the fluorescence rate and the mean membrane conductance (Gm) were compared in cells dialysed with 0.1 μm[Ca2+]i (Fig. 3b). Under these conditions no conductance other than leak conductance was present. We found a linear correlation between the rate of fluorescence increase and Gm that had a slope of about 0.2 % s−1 nS−1. At higher dialysed [Ca2+]i the presence of Cs+ (130 mm) in the pipette is expected to block Ca2+-activated K+ conductances (GK,Ca) that are uniformly expressed in somatotrophs (Herrington & Hille, 1994; Naumov et al. 1994). The Gm showed no correlation with [Ca2+]i (21 cells, not shown) indicating that membrane conductance under these conditions was not due to the activation of incompletely blocked GK,Ca. We further assumed that FM1-43 fluorescence increases at 0.1 μm[Ca2+]i were not a consequence of exocytic activity and corrected the fluorescence rates in other dialysed cells accordingly (see Methods). Corrected FM1-43 fluorescence traces are shown in Fig. 3A top (thin lines), and demonstrate that dye leakage into the cell cannot explain the continuous increase in FM1-43 fluorescence, but instead support the idea that continuous exocytic activity was occurring in these cells. In Fig. 3C the corrected fluorescence rates are plotted versus[Ca2+]i. Despite a cell-to-cell variability in the fluorescence rates it is evident that the increase in FM1-43 fluorescence has a faster rate at higher Ca2+ concentrations. This result is consistent with the Ca2+ dependence of exocytosis in other neuroendocrine cells (Henkel & Almers, 1996). Figure 3D shows final changes in fluorescence and capacitance from all cells. In contrast to depolarization experiments, the changes were not correlated. The dashed line is the best fit from depolarization experiments (Fig. 2D). Clearly, in dialysis experiments the mean change in fluorescence (56 ± 10 %; 21 cells) was far greater than the mean change in capacitance (3 ± 2 %). The flat capacitance trace suggests that somatrophs are unique in that a potent endocytic activity is able to sustain the membrane retrieval process at levels that match exocytic fusion during whole-cell Ca2+ dialysis.
Amperometry detects continuous exocytosis from dopamine-loaded somatotrophs
Other possibilities for unusual dye penetration such as dye translocation from the outer to inner leaflet of the membrane (Melikyan et al. 1996) led us to test further for the presence of exocytic activity during Ca2+ dialysis. Thus, we used amperometry as an independent measure of exocytosis. A carbon fibre electrode (CFE) was placed close to the cell to detect currents produced by oxidizing secreted transmitters (Fig. 4A inset, reviewed in Travis & Wightman, 1998). Somatotroph secretory granules contain the peptide growth hormone, and do not contain oxidizable substances that can be detected with a standard CFE. Therefore we loaded the granules with the false oxidizable transmitter dopamine (Kim et al. 2000; see also Methods). Figure 4A shows results from a cell that was dialysed with 100 μm[Ca2+]i as we simultaneously monitored capacitance, FM1-43 fluorescence and amperometric current (bottom trace). Before break-in (at arrow) few spontaneous spikes were observed in the amperometric current. As calcium entered the cell an increase in fluorescence was accompanied by increasing spike activity in the amperometric trace. This result confirms the presence of Ca2+-dependent exocytic activity during Ca2+ dialysis experiments. The spike marked with an asterisk is shown on an expanded time scale in Fig. 4B.
Figure 4. Amperometry reveals exocytosis from dopamine-loaded somatotrophs.

A, capacitance (continuous line), predicted capacitance (▵) and FM1-43 fluorescence (○) are plotted as percentage of control during dialysis with 100 μm[Ca2+]i. The bottom trace shows the amperometric current. The predicted capacitance was obtained from the amperometric current as described in Results. The cartoon in the inset shows a cell and CFE with typical dimensions: cell diameter is 10 μm, CFE diameter is 5 μm and the minimal cell to CFE axial distance (d) is 0.5 μm. Fraction of total events detected with CFE is given by the ratio of CFE tip area and the cell surface area. B, amperometric spike marked with asterisk from A on expanded time scale. C, an amplitude histogram of amperometric currents filtered at 100 Hz from Ca2+ dialysis (bars; 554 events) and depolarization experiments (line; 189 events). The inset shows an amplitude histogram of amperometric currents filtered at 2.1 kHz from Ca2+ dialysis (71 events). D, final changes in predicted capacitance are plotted versus final measured changes in capacitance (10 cells). The unity line is also shown. Note that predicted capacitance is always larger than actual capacitance.
To compare amperometric currents with capacitance measurements, we calculated predicted capacitance as the scaled cumulative sum of amperometric events. Taking the diameter of the somatotroph granule of 350 nm found in ultrastuctural studies (Ishikawa et al. 1972; Duello & Halmi, 1979) and the specific capacitance of 10 fF μm−2 the calculated granule capacitance is 4 fF. We assumed that each amperometric spike reflects the addition of 4 fF to cell capacitance. The amplitude of amperometric spikes decreases due to diffusional dispersion as the distance d (Fig. 4A, inset) from the fusion site increases (Schroeder et al. 1992; Haller et al. 1998). To characterize dopamine spikes from somatotrophs we measured amplitudes of amperometric spikes from 10 cells (Fig. 4C). In Fig. 4C the amplitude histogram shows that the maximal amplitude was about 10 times larger than the minimal detected amplitude. This range is expected for fusion events occurring in the closest apposition to the detector surface (Haller et al. 1998).
It also possible that small amperometric spikes arise from small non-secretory vesicles fusing with the cell membrane rather than distant fusion events of secretory granules. For example in bovine chromaffin cells when [Ca2+]i was raised above 100 μm, fusion of the vesicles that did not contain secretory cargo catecholamine has been reported (Xu et al. 1998). To test this possibility we measured amperometric currents from the cells that were dialysed with the solution containing no added Ca2+ as in Fig. 2 and secretion was evoked with depolarizing pulses. An amplitude histogram of amperometric spikes obtained from 9 cells is shown in Fig. 4C (line). Assuming that more physiological [Ca2+]i were present during depolarizing pulses, a similar distribution of amperometric amplitudes from Ca2+ dialysis and depolarization experiments is consistent with the hypothesis that small amperometric spikes arise from secretory granules and not small vesicles. Further support for this hypothesis can be found in studies done in chromaffin cells where depolarization- induced capacitance and amperometric signals are in agreement (Chow et al. 1992; Haller et al. 1998).
To decrease noise, amperometric currents were filtered with a 100 Hz cutoff frequency. Since in chromaffin cells median halfwidths of 7.4 ms were reported (Wightman et al. 1995) it is possible that because of the filtering we underestimated the maximum current amplitude and therefore the fraction of total events would be higher, giving a lower predicted capacitance. To test this possibility we recorded amperometric currents with a 2.1 kHz cutoff frequency (inset, Fig. 4C; n = 3 cells). Maximal amplitudes recorded with either 100 Hz or 2.1 kHz cutoff frequencies were similar. Furthermore, during Ca2+ dialysis (n = 21 cells) we have never observed localized changes in FM1-43 fluorescence suggesting that fusion events occurred uniformly on the cell surface. In summary these findings together with our amperometric arrangement (Fig. 4A, inset) indicate that the CFE detected only about 7 % of all events and therefore the cumulative sum of amperometric events was scaled by a factor of 14.
Due to technical difficulties in simultaneously recording capacitance, fluorescence and amperometric current (Fig. 4A) we conducted a series of experiments in which we simultaneously measured only capacitance and amperometric current but not FM1-43 fluorescence from cells dialysed with 100 μm[Ca2+]i. Figure 4D shows results from all cells (n = 10). It is clear that the predicted capacitance of 77 ± 12 % (derived from amperometric recordings) is significantly larger than the recorded capacitance of -1 ± 2 %. This result implies that during Ca2+ dialysis in pituitary somatotrophs the total number of fusion events (predicted capacitance) exceeds the number of events that are permanently added to the cell membrane (capacitance) indicating that endocytosis must have occurred under these conditions.
To compare amperometric currents with FM1-43 fluorescence (different cells) we measured the rates of predicted capacitance during the interval where predicted capacitance continuously increased. Figure 5 shows a histogram of FM1-43 fluorescence rates (Fig. 5A) and predicted capacitance rates (Fig. 5b). The two quantities were not significantly different (P < 0.05). These results suggest that in pituitary somatotrophs FM1-43 fluorescence and dopamine release can be used as a measure of exocytosis. In summary, predicted capacitance was similar to FM1-43 fluorescence, both of which greatly exceeded the measured capacitance increase.
Figure 5. Rates of FM1-43 fluorescence and predicted capacitance are similar.

A, histogram of corrected fluorescence rates from 14 cells. B, histogram of predicted capacitance rates from 10 cells. The cells were dialysed with 100 μm[Ca2+]i. The predicted capacitance rates were obtained from the intervals where the parameters continuously increased. Circles show means ±s.e.m.
Sustained endocytosis was not affected by GTPγS, Ba2+, Sr2+ or low intracellular pH
Since the mismatch between capacitance and FM1-43 fluorescence changes can be explained by the presence of sustained endocytosis, we attempted to block endocytosis to see if the capacitance would then increase. We used various treatments that were reported to block endocytosis in at least one secretory cell type (see Discussion). Figure 6 summarizes these experimental manipulations. None of these conditions resulted in a significant increase in membrane capacitance over control values (100 μm[Ca2+]i). Replacing GTP with GTPγS or reducing cytoplasmic pH from 7.2 to 6.2, both caused decreases in exocytic activity (FM1-43 fluorescence rates). Replacing Ca2+ with Ba2+ or Sr2+ also resulted in reduced exocytosis but the relative capacitance increase compared to FM1-43 fluorescence appears larger than that recorded in the other conditions. However, it is clear that none of these manipulations resulted in a complete block of sustained endocytosis. In addition to the manipulations described in Fig. 6, we also attempted to block sustained endocytosis with the following treatments, none of which resulted in significantly different capacitance changes when compared to control: replacing ATP with ATPγS (3 cells), adding 100 μm cAMP to the pipette solution (6 cells), increasing membrane tension by increasing the osmolarity of the pipette solution by 100 mosmol l−1 with sucrose (5 cells), adding the protein kinase inhibitor staurosporine to the pipette solution (0.5 μm; 6 cells).
Figure 6. Pharmacology of Ca2+-induced endocytosis.
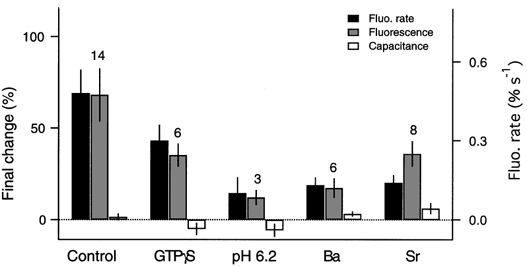
Corrected fluorescence rates (filled bars) are shown for different conditions. Final fluorescence changes (grey bars) and capacitance changes (open bars) are also shown. The number of cells tested under each condition is indicated at the top of the bars. The control experiment was done with 100 μm[Ca2+]i. The following manipulations were done: GTPγS replaced GTP; the pipette solution pH was lowered to 6.2; pipette Ca2+ (100 μm) was replaced with Ba2+ (300 μm) or Sr2+ (200 μm). Note that fluorescence changes are always larger than capacitance changes. The fluorescence and capacitance changes were significantly different for control, GTPγS and Sr2+(P < 0.01), Ba2+ and pH 6.2 (P < 0.06).
DISCUSSION
In most secretory cells studied to date, sustained stimulation of exocytosis in the whole-cell configuration results in relatively large, stable increases in capacitance (20 -200 %, see Introduction). Similarly, in this study the depolarizations applied to somatotrophs produced relative increases in capacitance and FM1-43 fluorescence that were similar in size (∼10 %; Fig. 2). The same result was found in bovine chromaffin cells (Smith & Betz, 1996) and suggested that FM1-43 stains cell membrane and exocytic granule membrane in a quantitatively similar manner. Furthermore, in somatotrophs after depolarization the capacitance increased to a stable level and did not consistently decrease. This differs from the behaviour of other neuroendocrine cells which after an initial capacitance increase showed a consistent decrease in capacitance (Artalejo et al. 1995; Hsu & Jackson, 1996; Smith & Neher, 1997). In summary Ca2+ influx through voltage-gated Ca2+ channels did not produce evidence for a consistent decrease in capacitance in somatotrophs in the whole-cell configuration.
In striking contrast, we found that dialysing somatotrophs with elevated [Ca2+]i to evoke sustained exocytosis triggers a potent mechanism of endocytosis that maintains cell surface area at approximately constant levels during secretion. This finding is based on the observation that during Ca2+ dialysis capacitance does not significantly change, whereas FM1-43 fluorescence (Fig. 3A) and the cumulative amperometric signal (predicted capacitance, Fig. 4A) increase substantially and nearly continuously. From Fig. 3D it is clear that about half of the somatotrophs studied showed slightly decreased capacitance during dialysis and most of the cells showed increases in capacitance no larger than 10 %. In contrast, Ca2+ dialysis in bovine chromaffin cells can double capacitance (Penner et al. 1986; Augustine & Neher, 1992), and such capacitance increases are accompanied by a similar change in FM1-43 fluorescence (Smith & Betz, 1996). In chromaffin cells, after several minutes of Ca2+ dialysis, capacitance levelled off but FM1-43 fluorescence continued to increase as a delayed endocytic process was initiated to maintain surface area (Smith & Betz, 1996). Since endocytosis is estimated as the difference between capacitance and FM1-43 fluorescence (Betz et al. 1996) and capacitance was relatively stable in dialysis experiments, we can conclude that the rates of exocytosis and endocytosis were about the same under these conditions and can be approximated by the fluorescence rate (Fig. 3D). Assuming a one-to-one relationship between FM1-43 fluorescence and capacitance, for a typical somatotroph with initial capacitance of 4 pF, a fluorescence rate of 0.15-0.5 % s−1 (Fig. 3D) corresponds to a retrieval rate of 60-200 fF s−1. This value is similar to rates of excess or rapid retrieval observed in bovine chromaffin cells (Burgoyne, 1995; Artalejo et al. 1995; Smith & Neher, 1997; Engisch & Nowycky, 1998), pituitary melanotrophs (Thomas et al. 1994) and pituitary nerve terminals (Hsu & Jackson, 1996). However in contrast to rapid endocytosis, sustained endocytosis in pituitary somatotrophs was present during several minutes of continuous exocytosis and was stable in the whole-cell patch-clamp configuration.
It should be pointed out that a continuous vesicle cycle of balanced exocytosis and endocytosis has been observed in goldfish neuronal synapse (Lagnado et al. 1996; Rouze & Schwartz, 1998). Our results in pituitary somatotrophs are the first demonstration of the same phenomena in neuroendocrine cells that persists in the whole-cell configuration. Also, it should be noted that we used very high [Ca2+]i to evoke sustained exocytosis and endocytosis. However more physiological stimuli with GHRH (Fig. 1) in 5 min increased FM1-43 fluorescence by 100 %, corresponding to a fluorescence rate of 0.3 % s−1. Comparison with the fluorescence rates in dialysis experiments (Fig. 3C) suggests that [Ca2+]i > 10 μm may well be present at the cell membrane during more physiological stimulation in intact cells.
Sustained endocytosis in pituitary somatotrophs was not blocked by manipulations reported to inhibit endocytosis in other secretory cells (Fig. 6). Replacing GTP with GTPγS completely blocks the rapid endocytosis that occurs after brief depolarizations in chromaffin cells (Artalejo et al. 1995; Nucifora & Fox, 1999). This effect is presumably due, at least in part, to an inhibition of dynamin's GTPase activity (Artalejo et al. 1997). Since dynamin is involved in many types of endocytosis other than just the processes coupled to secretion (Schmid et al. 1998), it is somewhat surprising that GTPγS did not block sustained endocytosis in somatotrophs. However the conclusion that this process is indeed dynamin independent in somatotrophs would require further study with more specific blockers (Artalejo et al. 1997).
Acidification of the cytosol is reported to disrupt clathrin-mediated endocytosis (Davoust et al. 1987) and block endocytosis in lizard motor nerve terminals (Lindgren et al. 1997). However, acidification did not block rapid endocytosis in chromaffin cells (Burgoyne, 1995; Artalejo et al. 1995) or melanotrophs (Thomas et al. 1994). Similarly, acidification of the pipette solution did not block sustained endocytosis in somatotrophs (Fig. 6).
Since we observed sustained endocytosis in somatotrophs during Ca2+ dialysis but saw little sign of endocytosis after brief depolarizations, we wondered whether Ca2+ plays a role in sustained endocytosis. Intracellular Ca2+ has a variety of effects on endocytosis in secretory cells, including stimulatory effects in chromaffin cells (Neher & Zucker, 1993; Burgoyne, 1995; Artalejo et al. 1995; Smith & Neher, 1997), no effect in hippocampal neurons (Ryan et al. 1996), and an inhibitory effect in goldfish bipolar cells (von Gersdorff & Matthews, 1994; Rouze & Schwartz, 1998). However, the absolute Ca2+ requirement of exocytosis makes it experimentally difficult to determine a Ca2+ requirement for endocytosis in secretory systems. One approach to address this question is to replace Ca2+ with either Ba2+ or Sr2+, both of which can drive exocytosis, albeit weakly. One series of studies with chromaffin cells indicated that replacing Ca2+ with either Ba2+ or Sr2+ resulted in a complete block of rapid endocytosis (Artalejo et al. 1995, 1996) while a similar study indicated that replacing Ca2+ with Ba2+ had no effect on rapid endocytosis (Nucifora & Fox, 1998). In frog motor nerve terminals, replacing Ca2+ with Sr2+ resulted in inhibition of endocytosis under some conditions (Guatimosim et al. 1998). Replacing Ca2+ with either Sr2+ or Ba2+ did not block sustained endocytosis in pituitary somatotrophs. This result suggests either that Ca2+ is not required for the observed sustained endocytosis, or that Ba2+ and Sr2+ are able to substitute for Ca2+ in this process.
Physiological significance
Under normal physiological conditions GHRH-stimulated somatotrophs secrete growth hormone for hours (Bilezikjian & Vale, 1983; Lussier et al. 1991). GHRH typically evokes a long lasting plateau of elevated [Ca2+]i (Lussier et al. 1991; Kato et al. 1992; Naumov et al. 1994) that is accompanied by [Ca2+]i oscillations (Rawlings et al. 1991; Kwiecien et al. 1997). It is possible that a plateau of [Ca2+]i is the driving force for the sustained endocytosis that we described here. Continuous exocytosis followed by membrane retrieval would permit pituitary somatotrophs to efficiently maintain secretory activity for long periods of time keeping the cell membrane area constant. However, continuous exocytosis has been observed in other neuroendocrine cells such as pancreatic β-cells, adrenal chromaffin cells and pituitary lactotrophs, all of them showing substantial capacitance increases during Ca2+ dialysis (Zorec et al. 1991; Augustine & Neher, 1992; Renstrom et al. 1997; Angleson et al. 1999). Quite possibly most neuroendocrine cells possess the ability to undergo sustained endocytosis when cells are intact and somatotrophs are somewhat unique in that this ability is not lost during whole-cell dialysis.
Acknowledgments
We wish to thank Steven Fadul for technical assistance and Dr K. T. Kim for helpful suggestions for amperometry. Support for this research was provided by MDA and NIH grants (W.J.B.), fellowships from NIH (J.K.A. and A.J.C.) and Human Frontier Science Program (G.K.).
References
- Angleson JK, Cochilla AJ, Kilic G, Nussinovitch I, Betz WJ. Regulation of dense core release from neuroendocrine cells revealed by imaging single exocytic events. Nature Neuroscience. 1999;2:440–446. doi: 10.1038/8107. [DOI] [PubMed] [Google Scholar]
- Artalejo CR, Elhamdani A, Palfrey HC. Calmodulin is the divalent cation receptor for rapid endocytosis, but not exocytosis, in adrenal chromaffin cells. Neuron. 1996;16:195–205. doi: 10.1016/s0896-6273(00)80036-7. [DOI] [PubMed] [Google Scholar]
- Artalejo CR, Elhamdani A, Palfrey HC. Secretion: dense-core vesicles can kiss-and-run too. Current Opinion in Biology. 1998;8:R62–65. doi: 10.1016/s0960-9822(98)70036-3. [DOI] [PubMed] [Google Scholar]
- Artalejo CR, Henley JR, McNiven MA, Palfrey HC. Rapid endocytosis coupled to exocytosis in adrenal chromaffin cells involves Ca2+, GTP, and dynamin but not clathrin. Proceedings of the National Academy of Sciences of the USA. 1995;2:8328–8332. doi: 10.1073/pnas.92.18.8328. [DOI] [PMC free article] [PubMed] [Google Scholar]
- Artalejo CR, Lemmon MA, Schlessinger J, Palfrey HC. Specific role for the PH domain of dynamin-1 in the regulation of rapid endocytosis in adrenal chromaffin cells. EMBO Journal. 1997;16:1565–1574. doi: 10.1093/emboj/16.7.1565. [DOI] [PMC free article] [PubMed] [Google Scholar]
- Augustine GJ, Neher E. Calcium requirements for secretion in bovine chromaffin cells. Journal of Physiology. 1992;450:247–271. doi: 10.1113/jphysiol.1992.sp019126. [DOI] [PMC free article] [PubMed] [Google Scholar]
- Betz WJ, Mao F, Bewick GS. Activity-dependent fluorescent staining and destaining of living vertebrate motor nerve terminals. Journal of Neuroscience. 1992;12:363–375. doi: 10.1523/JNEUROSCI.12-02-00363.1992. [DOI] [PMC free article] [PubMed] [Google Scholar]
- Betz WJ, Mao F, Smith CB. Imaging exocytosis and endocytosis. Current Opinion in Neurobiology. 1996;6:365–371. doi: 10.1016/s0959-4388(96)80121-8. [DOI] [PubMed] [Google Scholar]
- Bilezikjian LM, Vale WW. Stimulation of adenosine 3′,5′-monophosphate production by growth hormone-releasing factor and its inhibition by somatostatin in anterior pituitary cells in vitro. Endocrinology. 1983;113:1726–1731. doi: 10.1210/endo-113-5-1726. [DOI] [PubMed] [Google Scholar]
- Billiard J, Koh DS, Babcock DF, Hille B. Protein kinase C as a signal for exocytosis. Proceedings of the National Academy of Sciences of the USA. 1997;94:12192–12197. doi: 10.1073/pnas.94.22.12192. [DOI] [PMC free article] [PubMed] [Google Scholar]
- Brazeau P, Ling N, Bohlen P, Esch F, Ying SY, Guillemin R. Growth hormone releasing factor, somatocrinin, releases pituitary growth hormone in vitro. Proceedings of the National Academy of Sciences of the USA. 1982;79:7909–7913. doi: 10.1073/pnas.79.24.7909. [DOI] [PMC free article] [PubMed] [Google Scholar]
- Burgoyne RD. Fast exocytosis and endocytosis triggered by depolarisation in single adrenal chromaffin cells before rapid Ca2 + current run-down. Pflügers Archiv. 1995;430:213–219. doi: 10.1007/BF00374652. [DOI] [PubMed] [Google Scholar]
- Chow RH, Von Ruden L, Neher E. Delay in vesicle fusion revealed by electrochemical monitoring of single secretory events in adrenal chromaffin cells. Nature. 1992;356:60–63. doi: 10.1038/356060a0. [DOI] [PubMed] [Google Scholar]
- Cochilla AJ, Angleson JK, Betz WJ. Monitoring secretory membrane with FM1–43 fluorescence. Annual Review of Neuroscience. 1999;22:1–10. doi: 10.1146/annurev.neuro.22.1.1. [DOI] [PubMed] [Google Scholar]
- Davoust J, Gruenberg J, Howell KE. Two threshold values of low pH block endocytosis at different stages. EMBO Journal. 1987;6:3601–3609. doi: 10.1002/j.1460-2075.1987.tb02691.x. [DOI] [PMC free article] [PubMed] [Google Scholar]
- De Camilli P, Takei K. Molecular mechanisms in synaptic vesicle endocytosis and recycling. Neuron. 1996;16:481–486. doi: 10.1016/s0896-6273(00)80068-9. [DOI] [PubMed] [Google Scholar]
- Duello TM, Halmi NS. Ultrastructural-immunocytochemical localization of growth hormone and prolactin in human pituitaries. Journal of Clinical Endocrinology and Metabolism. 1979;49:189–196. doi: 10.1210/jcem-49-2-189. [DOI] [PubMed] [Google Scholar]
- Engisch KL, Nowycky MC. Compensatory and excess retrieval: two types of endocytosis following single step depolarizations in bovine adrenal chromaffin cells. Journal of Physiology. 1998;506:591–608. doi: 10.1111/j.1469-7793.1998.591bv.x. [DOI] [PMC free article] [PubMed] [Google Scholar]
- Fernandez JM, Neher E, Gomperts BD. Capacitance measurements reveal stepwise fusion events in degranulating mast cells. Nature. 1984;312:453–455. doi: 10.1038/312453a0. [DOI] [PubMed] [Google Scholar]
- Giovannucci DR, Yule DI, Stuenkel EL. Optical measurement of stimulus-evoked membrane dynamics in single pancreatic acinar cells. American Journal of Physiology. 1998;275:C732–739. doi: 10.1152/ajpcell.1998.275.3.C732. [DOI] [PubMed] [Google Scholar]
- Grynkiewicz G, Poenie M, Tsien RY. A new generation of Ca2 + indicators with greatly improved fluorescence properties. Journal of Biological Chemistry. 1985;260:3440–3450. [PubMed] [Google Scholar]
- Guatimosim C, Romano-Silva MA, Gomez MV, Prado MA. Recycling of synaptic vesicles at the frog neuromuscular junction in the presence of strontium. Journal of Neurochemistry. 1998;70:2477–2483. doi: 10.1046/j.1471-4159.1998.70062477.x. [DOI] [PubMed] [Google Scholar]
- Haller M, Heinemann C, Chow RH, Heidelberger R, Neher E. Comparison of secretory responses as measured by membrane capacitance and by amperometry. Biophysical Journal. 1998;74:2100–2113. doi: 10.1016/S0006-3495(98)77917-2. [DOI] [PMC free article] [PubMed] [Google Scholar]
- Hartmann J, Scepek S, Lindau M. Regulation of granule size in human and horse eosinophils by number of fusion events among unit granules. Journal of Physiology. 1995;483:201–209. doi: 10.1113/jphysiol.1995.sp020578. [DOI] [PMC free article] [PubMed] [Google Scholar]
- Heinemann C, Chow RH, Neher E, Zucker RS. Kinetics of the secretory response in bovine chromaffin cells following flash photolysis of caged Ca2 + Biophysical Journal. 1994;67:2546–2557. doi: 10.1016/S0006-3495(94)80744-1. [DOI] [PMC free article] [PubMed] [Google Scholar]
- Henkel AW, Almers W. Fast steps in exocytosis and endocytosis studied by capacitance measurements in endocrine cells. Current Opinion in Neurobiology. 1996;6:350–357. doi: 10.1016/s0959-4388(96)80119-x. [DOI] [PubMed] [Google Scholar]
- Herrington J, Hille B. Growth hormone-releasing hexapeptide elevates intracellular calcium in rat somatotropes by two mechanisms. Endocrinology. 1994;135:1100–1108. doi: 10.1210/endo.135.3.8070352. [DOI] [PubMed] [Google Scholar]
- Horrigan FT, Bookman RJ. Releasable pools and the kinetics of exocytosis in adrenal chromaffin cells. Neuron. 1994;13:1119–1129. doi: 10.1016/0896-6273(94)90050-7. [DOI] [PubMed] [Google Scholar]
- Hsu SF, Jackson MB. Rapid exocytosis and endocytosis in nerve terminals of the rat posterior pituitary. Journal of Physiology. 1996;494:539–553. doi: 10.1113/jphysiol.1996.sp021512. [DOI] [PMC free article] [PubMed] [Google Scholar]
- Ishikawa H, Otsuka Y, Soyama F, Yoshimura F. Separation of the two different sizes of storage granules with GH or ACTH activity from the pellets of acidophils isolated from rat anterior pituitaries. Endocrinologia Japonica. 1972;19:215–223. doi: 10.1507/endocrj1954.19.215. [DOI] [PubMed] [Google Scholar]
- Kasai H, Takagi H, Ninomiya Y, Kishimoto T, Ito K, Yoshida A, Yoshioka T, Miyashita Y. Two components of exocytosis and endocytosis in phaeochromocytoma cells studied using caged Ca2 + compounds. Journal of Physiology. 1996;494:53–65. doi: 10.1113/jphysiol.1996.sp021475. [DOI] [PMC free article] [PubMed] [Google Scholar]
- Kato M, Hoyland J, Sikdar SK, Mason WT. Imaging of intracellular calcium in rat anterior pituitary cells in response to growth hormone releasing factor. Journal of Physiology. 1992;447:171–189. doi: 10.1113/jphysiol.1992.sp018997. [DOI] [PMC free article] [PubMed] [Google Scholar]
- Keller E, Nussinovitch I. Activity-dependent ultra-slow inactivation of calcium currents in rat anterior pituitary cells. Journal of Neurophysiology. 1996;76:2157–2168. doi: 10.1152/jn.1996.76.4.2157. [DOI] [PubMed] [Google Scholar]
- Kim KT, Koh DS, Hille B. Loading of oxidizable transmitters into secretory vesicles permits carbon-fiber amperometry. Journal of Neuroscience. 2000;20 doi: 10.1523/JNEUROSCI.20-20-j0001.2000. RC 101. [DOI] [PMC free article] [PubMed] [Google Scholar]
- Klingauf J, Kavalali ET, Tsien RW. Kinetics and regulation of fast endocytosis at hippocampal synapses. Nature. 1998;394:581–585. doi: 10.1038/29079. [DOI] [PubMed] [Google Scholar]
- Kwiecien R, Tseeb V, Kurchikov A, Kordon C, Hammond C. Growth hormone-releasing hormone triggers pacemaker activity and persistent Ca2+ oscillations in rat somatotrophs. Journal of Physiology. 1997;499:613–623. doi: 10.1113/jphysiol.1997.sp021954. [DOI] [PMC free article] [PubMed] [Google Scholar]
- Lagnado L, Gomis A, Job C. Continuous vesicle cycling in the synaptic terminal of retinal bipolar cells. Neuron. 1996;17:957–967. doi: 10.1016/s0896-6273(00)80226-3. [DOI] [PubMed] [Google Scholar]
- Lindau M, Neher E. Patch-clamp techniques for time-resolved capacitance measurements in single cells. Pflügers Archiv. 1988;411:137–146. doi: 10.1007/BF00582306. [DOI] [PubMed] [Google Scholar]
- Lindgren CA, Emery DG, Haydon PG. Intracellular acidification reversibly reduces endocytosis at the neuromuscular junction. Journal of Neuroscience. 1997;17:3074–3084. doi: 10.1523/JNEUROSCI.17-09-03074.1997. [DOI] [PMC free article] [PubMed] [Google Scholar]
- Lussier BT, French MB, Moore BC, Kraicer J. Free intracellular Ca2 + concentration ([Ca2 +]i) and growth hormone release from purified rat somatotrophs. I. GH-releasing factor-induced Ca2 + influx raises [Ca2 +]i. Endocrinology. 1991;128:570–582. doi: 10.1210/endo-128-1-570. [DOI] [PubMed] [Google Scholar]
- Martell AE, Smith AM. Critical Stability Constants. New York: Plenum Press; 1974. [Google Scholar]
- Melikyan GB, Deriy BN, Ok DC, Cohen FS. Voltage-dependent translocation of R18 and DiI across lipid bilayers leads to fluorescence changes. Biophysical Journal. 1996;71:2680–2691. doi: 10.1016/S0006-3495(96)79459-6. [DOI] [PMC free article] [PubMed] [Google Scholar]
- Naumov AP, Herrington J, Hille B. Actions of growth-hormone-releasing hormone on rat pituitary cells: intracellular calcium and ionic currents. Pflügers Archiv. 1994;427:414–421. doi: 10.1007/BF00374255. [DOI] [PubMed] [Google Scholar]
- Neher E, Marty A. Discrete changes of cell membrane capacitance observed under conditions of enhanced secretion in bovine adrenal chromaffin cells. Proceedings of the National Academy of Sciences of the USA. 1982;79:6712–6716. doi: 10.1073/pnas.79.21.6712. [DOI] [PMC free article] [PubMed] [Google Scholar]
- Neher E, Zucker RS. Multiple calcium-dependent processes related to secretion in bovine chromaffin cells. Neuron. 1993;10:21–30. doi: 10.1016/0896-6273(93)90238-m. [DOI] [PubMed] [Google Scholar]
- Nucifora PG, Fox AP. Barium triggers rapid endocytosis in calf adrenal chromaffin cells. Journal of Physiology. 1998;508:483–494. doi: 10.1111/j.1469-7793.1998.483bq.x. [DOI] [PMC free article] [PubMed] [Google Scholar]
- Nucifora PG, Fox AP. Tyrosine phosphorylation regulates rapid endocytosis in adrenal chromaffin cells. Journal of Neuroscience. 1999;19:9739–9746. doi: 10.1523/JNEUROSCI.19-22-09739.1999. [DOI] [PMC free article] [PubMed] [Google Scholar]
- Nusse O, Lindau M. The dynamics of exocytosis in human neutrophils. Journal of Cell Biology. 1988;107:2117–2123. doi: 10.1083/jcb.107.6.2117. [DOI] [PMC free article] [PubMed] [Google Scholar]
- Okano K, Monck JR, Fernandez JM. GTP gamma S stimulates exocytosis in patch-clamped rat melanotrophs. Neuron. 1993;11:165–172. doi: 10.1016/0896-6273(93)90280-5. [DOI] [PubMed] [Google Scholar]
- Pappone PA, Lee SC. Purinergic receptor stimulation increases membrane trafficking in brown adipocytes. Journal of General Physiology. 1996;108:393–404. doi: 10.1085/jgp.108.5.393. [DOI] [PMC free article] [PubMed] [Google Scholar]
- Penner R, Neher E, Dreyer F. Intracellularly injected tetanus toxin inhibits exocytosis in bovine adrenal chromaffin cells. Nature. 1986;324:76–78. doi: 10.1038/324076a0. [DOI] [PubMed] [Google Scholar]
- Rawlings SR, Hoyland J, Mason WT. Calcium homeostasis in bovine somatotrophs: calcium oscillations and calcium regulation by growth hormone-releasing hormone and somatostatin. Cell Calcium. 1991;12:403–414. doi: 10.1016/0143-4160(91)90066-n. [DOI] [PubMed] [Google Scholar]
- Renstrom E, Eliasson L, Rorsman P. Protein kinase A-dependent and -independent stimulation of exocytosis by cAMP in mouse pancreatic B-cells. Journal of Physiology. 1997;502:105–118. doi: 10.1111/j.1469-7793.1997.105bl.x. [DOI] [PMC free article] [PubMed] [Google Scholar]
- Rosenboom H, Lindau M. Exo-endocytosis and closing of the fission pore during endocytosis in single pituitary nerve terminals internally perfused with high calcium concentrations. Proceedings of the National Academy of Sciences of the USA. 1994;91:5267–5271. doi: 10.1073/pnas.91.12.5267. [DOI] [PMC free article] [PubMed] [Google Scholar]
- Rouze NC, Schwartz EA. Continuous and transient vesicle cycling at a ribbon synapse. Journal of Neuroscience. 1998;18:8614–8624. doi: 10.1523/JNEUROSCI.18-21-08614.1998. [DOI] [PMC free article] [PubMed] [Google Scholar]
- Ryan TA, Smith SJ, Reuter H. The timing of synaptic vesicle endocytosis. Proceedings of the National Academy of Sciences of the USA. 1996;93:5567–5571. doi: 10.1073/pnas.93.11.5567. [DOI] [PMC free article] [PubMed] [Google Scholar]
- Schmid SL, McNiven MA, De Camilli P. Dynamin and its partners: a progress report. Current Opinion in Cell Biology. 1998;10:504–512. doi: 10.1016/s0955-0674(98)80066-5. [DOI] [PubMed] [Google Scholar]
- Schroeder TJ, Jankowski JA, Kawagoe KT, Wightman RM, Lefrou C, Amatore C. Analysis of diffusional broadening of vesicular packets of catecholamines released from biological cells during exocytosis. Analytical Chemistry. 1992;64:3077–3083. doi: 10.1021/ac00048a003. (Published erratum appears in Analytical Chemistry 65, 2711 (1993).) [DOI] [PubMed] [Google Scholar]
- Smith C, Neher E. Multiple forms of endocytosis in bovine adrenal chromaffin cells. Journal of Cell Biology. 1997;139:885–894. doi: 10.1083/jcb.139.4.885. [DOI] [PMC free article] [PubMed] [Google Scholar]
- Smith CB, Betz WJ. Simultaneous independent measurement of endocytosis and exocytosis. Nature. 1996;380:531–534. doi: 10.1038/380531a0. [DOI] [PubMed] [Google Scholar]
- Thomas P, Lee AK, Wong JG, Almers W. A triggered mechanism retrieves membrane in seconds after Ca2+- stimulated exocytosis in single pituitary cells. Journal of Cell Biology. 1994;124:667–675. doi: 10.1083/jcb.124.5.667. [DOI] [PMC free article] [PubMed] [Google Scholar]
- Thomas P, Wong JG, Lee AK, Almers W. A low affinity Ca2 + receptor controls the final steps in peptide secretion from pituitary melanotrophs. Neuron. 1993;11:93–104. doi: 10.1016/0896-6273(93)90274-u. [DOI] [PubMed] [Google Scholar]
- Travis ER, Wightman RM. Spatio-temporal resolution of exocytosis from individual cells. Annual Review of Biophysics and Biomolecular Structure. 1998;27:77–103. doi: 10.1146/annurev.biophys.27.1.77. [DOI] [PubMed] [Google Scholar]
- Tse FW, Tse A, Hille B, Horstmann H, Almers W. Local Ca2 + release from internal stores controls exocytosis in pituitary gonadotrophs. Neuron. 1997;18:121–132. doi: 10.1016/s0896-6273(01)80051-9. [DOI] [PubMed] [Google Scholar]
- Von Gersdorff H, Matthews G. Inhibition of endocytosis by elevated internal calcium in a synaptic terminal. Nature. 1994;370:652–655. doi: 10.1038/370652a0. [DOI] [PubMed] [Google Scholar]
- Wightman RM, Schroeder TJ, Finnegan JM, Ciolkowski EL, Pihel K. Time course of release of catecholamines from individual vesicles during exocytosis at adrenal medullary cells. Biophysical Journal. 1995;68:383–390. doi: 10.1016/S0006-3495(95)80199-2. [DOI] [PMC free article] [PubMed] [Google Scholar]
- Xu T, Binz T, Niemann H, Neher E. Multiple kinetic components of exocytosis distinguished by neurotoxin sensitivity. Nature Neuroscience. 1998;1:192–200. doi: 10.1038/642. [DOI] [PubMed] [Google Scholar]
- Zhou Z, Misler S. Amperometric detection of quantal secretion from patch-clamped rat pancreatic beta-cells. Journal of Biological Chemistry. 1996;271:270–277. doi: 10.1074/jbc.271.1.270. [DOI] [PubMed] [Google Scholar]
- Zorec R, Sikdar SK, Mason WT. Increased cytosolic calcium stimulates exocytosis in bovine lactotrophs. Direct evidence from changes in membrane capacitance. Journal of General Physiology. 1991;97:473–497. doi: 10.1085/jgp.97.3.473. [DOI] [PMC free article] [PubMed] [Google Scholar]