

Abstract
Action potential (AP) prolongation typically occurs in heart disease due to reductions in transient outward potassium currents (Ito), and is associated with increased Ca2+ transients. We investigated the underlying mechanisms responsible for enhanced Ca2+ transients in normal isolated rat ventricular myocytes in response to the AP changes that occur following myocardial infarction.
Normal myocytes stimulated with a train of long post-myocardial infarction (MI) APs showed a 2.2-fold elevation of the peak Ca2+ transient and a 2.7-fold augmentation of fractional cell shortening, relative to myocytes stimulated with a short control AP.
The steady-state Ca2+ load of the sarcoplasmic reticulum (SR) was increased 2.0-fold when myocytes were stimulated with trains of long post-MI APs (111 ± 21.6 μmol l−1) compared with short control APs (56 ± 7.2 μmol l−1).
Under conditions of equal SR Ca2+ load, long post-MI APs still resulted in a 1.7-fold increase in peak [Ca2+]i and a 3.8-fold increase in fractional cell shortening relative to short control APs, establishing that changes in the triggering of SR Ca2+ release are largely responsible for elevated Ca2+ transients following AP prolongation.
Fractional SR Ca2+ release calculated from the measured SR Ca2+ load and the integrated SR Ca2+ fluxes was 24 ± 3 and 11 ± 2 % following post-MI and control APs, respectively.
The fractional release (FR) of Ca2+ from the SR divided by the integrated L-type Ca2+ flux (FR/∫FCa,L) was increased 1.2-fold by post-MI APs compared with control APs. Similar increases in excitation-contraction (E-C) coupling gains were observed establishing enhanced E-C coupling efficiency.
Our findings demonstrate that AP prolongation alone can markedly enhance E-C coupling in normal myocytes through increases in the L-type Ca2+ current (ICa,L) trigger combined with modest enhancements in Ca2+ release efficiency. We propose that such changes in AP profile in diseased myocardium may contribute significantly to alterations in E-C coupling independent of other biochemical or genetic changes.
Action potential (AP) prolongation is universally observed in human patients with heart disease as well as in several animal models as a result of a reduction in the expression of potassium channel genes Kv4.2 and Kv4.3 which encode the channels for the transient outward current (Ito) (Beuckelmann et al. 1993; Brooksby et al. 1993; Cerbai et al. 1994; Kaab et al. 1996; Wickenden et al. 1998; Kaprielian et al. 1999). We and others have shown previously that this AP prolongation results in elevated [Ca2+]i (Bouchard et al. 1995; Wickenden et al. 1998; Kaprielian et al. 1999) which enhances contractility of compromised myocardium (Fiset et al. 1997). The increase in Ca2+ transients and contractility observed following AP prolongation may be explained by an enhanced triggered sarcoplasmic reticulum (SR) Ca2+ release, an elevated SR Ca2+ load or both. Previous studies have attributed increases in inotropy following AP prolongation to elevations in SR Ca2+ load (Brooksby et al. 1993; Bouchard et al. 1995). Changes in SR Ca2+ load have also been shown to influence the efficiency of SR Ca2+ release (Han et al. 1994; Janczewski et al. 1995; Santana et al. 1997) although these studies used step depolarizations to trigger Ca2+ release rather than APs. On the other hand, elevations in SR Ca2+ release have also been linked to increases in L-type Ca2+ current (ICa,L) trigger. Specifically, prolongation of step depolarization duration, particularly in the range 2-20 ms, enhanced SR Ca2+ release independently of SR Ca2+ load by increasing the ICa,L trigger (Isenberg & Han, 1994). This strong dependence of SR Ca2+ release on step duration suggests that a similar mechanism may underlie altered Ca2+ release in heart disease since the early repolarization phase of the AP, and the corresponding temporal changes in ICa,L, are primarily affected by Ito reductions (Kaprielian et al. 1999).
Recently, changes in E-C coupling efficiency have been reported in different animal models of hypertensive heart disease, with one study reporting enhanced SR Ca2+ release (Shorofsky et al. 1999) and another finding impaired release (Gomez et al. 1997). Unfortunately neither of these studies took into account the possible effects of AP prolongation that are known to occur in spontaneous hypertensive rats (Brooksby et al. 1993; Cerbai et al. 1994). This is particularly relevant since AP prolongation in spontaneous hypertensive rats (Brooksby et al. 1993) and in rats following myocardial infarction has been directly linked to increased Ca2+ transient amplitudes, although the underlying mechanism for these changes was not thoroughly investigated. In addition, based on previous studies demonstrating ICa,L-independent forms of SR Ca2+ release such as Na+-Ca2+ exchange-mediated release (Levesque et al. 1991; Wasserstrom & Vites, 1996; Sipido et al. 1997; Litwin et al. 1998) and voltage-sensitive release (Ferrier et al. 1998; Howlett et al. 1998), one might anticipate that prolonged APs might also alter the efficiency of Ca2+ release.
This study was designed to determine the mechanism for the changes in Ca2+ transients associated specifically with AP prolongation observed following myocardial infarction in terms of changes in trigger ICa,L versus changes in SR Ca2+ load. We find that when normal myocytes are stimulated with prolonged action potentials, positive inotropic effects are mediated primarily through an increase in triggered Ca2+ release and are secondarily due to an enhancement in SR Ca2+ load. This elevated Ca2+ release appears to result primarily from increased Ca2+ influx mediated by ICa,L combined with a modest enhancement in the efficiency of Ca2+ release evoked by post-MI APs.
METHODS
Isolation of rat ventricular myocytes
The procedure for isolation of adult rat ventricular myocytes was adapted from our previous studies (Wickenden et al. 1997). Male Sprague-Dawley rats (300-400 g, Charles River) were heparinized and killed by intraperitoneal injection of a lethal dose of anaesthetic (sodium pentobarbital, 200 mg kg−1) in accordance with the Guidelines of the Animal Care and Use Committee of the University Health Network. Hearts were cannulated and retrogradely perfused through the aorta for about 1 min with a Ca2+-containing standard Tyrode solution (mm): 140 NaCl, 5.4 KCl, 10 Hepes, 1 MgCl2, 1 CaCl2 and 10 d-glucose, adjusted to pH 7.4 with NaOH at 37 °C. The hearts were then perfused with nominally Ca2+-free standard Tyrode solution for 5 min prior to digestion with the same solution containing collagenase (Type II, 0.38 mg ml−1, Boehringer-Mannheim) and protease (Type XIV, 0.03 mg ml−1, Sigma) for 8-9 min. The enzyme solution was then washed out by perfusing for 2-3 min with a Kraft-Brühe (high K+) solution (mm): 120 potassium glutamate, 20 KCl, 10 Hepes, 1 MgCl2, 0.3 K-EGTA and 10 d-glucose, pH 7.4. All solutions were pre-bubbled with 100 % O2 for 5 min. Following the enzyme washout, the atria and blood vessels were removed and ventricles separated. The right and left ventricular free walls were dissected from the remainder of the heart. Myocytes were minced and mechanically dissociated in high K+ solution and then filtered through a nylon mesh. The cells were then resuspended in high K+ solution containing bovine serum albumin (0.04 % w/v) and gentamycin (0.05 mg ml−1) and used within 12 h after isolation. Only Ca2+-tolerent, quiescent, rod-shaped myocytes with clear cross-striations were selected for electrophysiological, intracellular Ca2+ and unloaded cell shortening measurements.
Intracellular Ca2+ and cell shortening measurements during AP clamps
Freshly isolated rat ventricular myocytes were placed in a bath on the stage of an Olympus IX50 inverted microscope and perfused at room temperature (20-23 °C at approximately 1 ml min−1) with extracellular solution of the following composition (mm): 140 NaCl, 4 KCl, 10 Hepes, 1 MgCl2, 2 CaCl2 and 10 d-glucose, adjusted to 7.4 with NaOH. Myocytes were voltage clamped using the whole-cell patch clamp technique (Hamill et al. 1981) with an Axopatch 200A amplifier (Axon Instruments). Microelectrodes were pulled from thin-walled 1.5 mm diameter borosilicate glass (World Precision Instruments) using a Flaming-Brown micropipette puller (Sutter Instruments) and heat polished to a final resistance of 1-2 MΩ when filled with a solution containing (mm): 140 KCl, 10 Hepes, 1 MgCl2, 10 NaCl, 7 MgATP, 0.060 fura-2 pentapotassium salt, adjusted to pH 7.2 with KOH. Series resistance compensation ranged between 80 and 90 %. Fluorescence measurements were performed using light from a 75 W xenon lamp (Oriel Corp., CT, USA) passed through bandpass filters centred at either 340 or 380 nm (Chromatech, VT, USA). The emitted fluorescence was collected by a × 40 Uapo/340 objective lens (Olympus America, Melville, NY, USA) and passed through a 510 nm filter to a photomultiplier tube (R2693, Hamamatsu, Japan). The photomultiplier output was filtered at 100 Hz, recorded using an A/D data acquisition board (Model PP-50 Warner, CT, USA) and stored in a computer for analysis. The ratio (R) of the background-subtracted fluorescence signal (340/380) was used to estimate [Ca2+]i as described previously (Kaprielian et al. 1999). In our experiments β, which is defined as the ratioof fluorescence measured with 380 nm excitation light in the absence of Ca2+ to that measured at saturating levels of Ca2+ (10 mm), was 11.3 ± 0.3 (n = 2). The fluorescence ratio in the presence of saturating Ca2+ (Rmax) was 5.9 ± 0.1 (n = 2) and that in the absence of Ca2+ (Rmin) was 0.23 ± 0.03 (n = 2). Cells were stimulated with either step depolarizations or AP clamps using waveforms obtained from control and post-MI myocytes (Kaprielian et al. 1999). All [Ca2+]i and cell shortening measurements were made under steady-state conditions following loading trains of these APs or 100 ms steps at a frequency of 0.25 Hz. To obtain a fluorescence measurement from both 340 and 380 nm excitation wavelengths, each protocol was repeated at least once. The reliability of using this approach was validated in several cells by repeated fluorescence measures at 340 and 380 nm excitation following the loading trains and the measurements proved to be stable throughout the duration of the experiment.
Unloaded cell shortening was measured simultaneously with fluorescence using a CCD video camera mounted on the sideport of the microscope. Custom-made relay lenses were installed in the sideport to reduce the image of myocytes to fit into the active area of the camera. Raster lines were positioned over both edges of the myocyte and the focus and detection thresholds were adjusted to maximize the signal-to-noise ratio. Dual-edge motion was monitored by an edge-detection system (Crescent Electronics, Salt Lake City, UT, USA), digitized on-line and stored on a personal computer using pCLAMP software.
The fluorescence signals and cell motion signals were both digitized at 4 kHz. Cell motion was measured at 60 Hz, which is the acquisition rate of the CCD camera used. The fluorescence signals were filtered at 100 Hz.
L-type Ca2+ current during AP clamps
Calcium current and Ca2+ transients were measured simultaneously during an AP clamp by eliminating Na+ and K+ currents followed by a Cd2+ subtraction. Interfering K+ currents were eliminated by replacing almost all intracellular and extracellular K+ with Cs+. The intracellular solution contained (mm): 140 CsCl, 2 KCl, 10 Hepes, 1 MgCl2, 10 NaCl, 7 MgATP and 0.060 fura-2 pentapotassium salt, adjusted to pH 7.2 with CsOH. The extracellular solution contained (mm): 140 NaCl, 4 CsCl, 10 Hepes, 1 MgCl2, 2 CaCl2, 10 d-glucose and 30 μm TTX, pH 7.4 with NaOH. It was applied using a rapid local superfusion device (BMT Research Services, Calgary, Alberta, Canada). After Ca2+ currents and transients were measured the extracellular solution was switched to one containing 500 μm CdCl2 and the trace acquired was used for subtraction to eliminate all other background currents.
Measurement of SR Ca2+ load
SR Ca2+ load was estimated following trains of either eight AP waveforms or 100 ms steps to 10 mV applied every 4 s to establish steady-state SR load conditions. After eight loading pulses the myocyte was rapidly superfused with standard Tyrode solution containing 20 mm caffeine. Application of caffeine caused myocyte contraction as a result of Ca2+ release from the SR (Varro et al. 1993). Throughout the caffeine application the membrane potential was held at -80 mV to enhance INa-Ca and thereby allowed estimation of the SR Ca2+ content by integrating INa-Ca over the duration of the caffeine application. Cell volume was calculated from the mean cell membrane capacitance (178 ± 7 pF, n = 18) and converted to volume by assuming a surface area to volume ratio of 0.5 μm−1 (Page, 1978) and a specific capacity of 1 μF cm−2. Calcium efflux via non-electrogenic pathways was corrected for by dividing by 0.87, in accordance with the findings of Bassani et al. (1994) that 87 % of the Ca2+ flux during a caffeine contracture occurs through Na+-Ca2+ exchange.
Computation of SR Ca2+ flux, Frel, and measurement of E-C coupling gain
The SR Ca2+ release flux (Frel) was determined from Ca2+ transient recordings using the method of Wier et al. (1994). Calcium influx into the myoplasm via sarcolemmal ICa,L is believed to contribute little to the amplitude of the Ca2+ transient in the rat (Terracciano & MacLeod, 1997). Indeed, our calculations confirmed that Ca2+ influx represents less than 6 % of the total Ca2+ released (see below, Fig. 8A). Accordingly, the rate of change of [Ca2+]i is almost entirely determined by the net flux of Ca2+ across the SR membrane plus the binding and unbinding to intracellular ligands as given by:
| (1) |
where Frel is the SR Ca2+ release flux, Fpump is the SR Ca2+ uptake flux via the SR ATPase, Fleak is the background Ca2+ leak from the SR to the cytoplasm (fixed at 0.0175 mm s−1; Balke et al. 1994), [CaL] is the concentration of ligand-bound Ca2+ and d/dt represents the first derivative with respect to time. For the purposes of SR Ca2+ flux estimation, a corrected calcium transient ([Ca2+]i,corr) was calculated taking into account the kinetics of binding of Ca2+ to fura-2 as described by Sipido & Wier (1991):
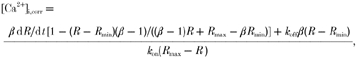 |
(2) |
For this calculation the value of koff was taken to be 23 s−1 (Baylor & Hollingworth, 1988) and kon was determined to be 1.03 × 10⁸m−1 s−1 assuming a KD for fura-2 of 224 nm. The time derivative, d[Ca2+]i,corr/dt, is calculated from the corrected calcium transient recording in a three-point, sliding-window, linear model using a least squares estimator. The expressions for Fpump (Balke et al. 1994) and d[CaL]/dt (Sipido & Wier, 1991) were:
| (3) |
| (4) |
where Vmax is the maximal SR uptake flux defined as 0.2 mm s−1 (Balke et al. 1994), L represents intracellular ligands including calmodulin, troponin and fura-2 and  and
and  are binding rate constants for the respective ligands. The affinity constant (Km) was adjusted for each cell to eliminate baseline SR flux, as done previously (Wier et al. 1994). In nine cells, Km ranged from 0.09 to 0.31 μm with an average of 0.178 ± 0.006 μm, which is comparable to previously reported values (Balke et al. 1994).
Figure 8. Excitation-contraction coupling gains and fractional SR Ca2+ release during short control and long post-MI action potentials.
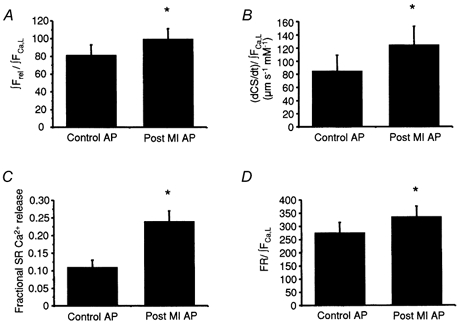
A, a 1.2-fold enhancement in E-C coupling gain in myocytes stimulated with a long post-MI AP (99.6 ± 11.7, n = 9) relative to a short control AP (81.6 ± 11.5, n = 9) when gain is defined as the estimated amount of SR Ca2+ release (∫Frel) over the amount of trigger Ca2+ (∫FCa,L). B, the E-C coupling gain as defined by the rate of cell shortening over the amount of trigger Ca2+. According to this definition, E-C coupling efficiency is elevated 1.5-fold upon stimulation of myocytes with a long post-MI AP (124.6 ± 28.2 μm s−1 mm−1, n = 8) relative to a short control AP (84.8 ± 24.2 μm s−1 mm−1, n = 8). C, fractional release (FR) is enhanced by the post-MI AP (24 ± 3 %, n = 9) over the control AP (11 ± 2 %, n = 9) and the FR normalized to the amount of trigger Ca2+ (∫FCa,L) was increased 1.2-fold (D). *P < 0.05.
Using these definitions, the SR Ca2+ release flux (Frel) can be obtained directly from the kinetically corrected Ca2+ transient (eqn (2)) and eqn (1). The integral of Frel provides a measure of the amount of Ca2+ released by the SR following an AP. An estimate of Ca2+ influx responsible for triggering Ca2+ release (i.e. ∫FCa,L) was determined from the integrated Ca2+ current according to:
where z is the valence of Ca2+, F is Faraday's constant (9.648 × 10⁴ C mol−1), the factor 0.5 is the fraction of the total cell volume assumed to be accessible to Ca2+ (Wier et al. 1994) and V is the total cell volume calculated from the mean cell membrane capacitance (178 ± 7 pF, n = 18) as described above. The term 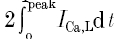 represents twice the integrated ICa,L from the baseline to the peak and reflects the contribution of first openings of L-type Ca2+ channels (i.e. first latency distribution) to ICa,L (Rose et al. 1992). Previous studies have established that the time course of Ca2+ release coincides closely with the first latency of L-type Ca2+ channel activation (Isenberg & Han, 1994; Lopez-Lopez et al. 1995; Sham et al. 1998; Cleemann et al. 1998; Collier et al. 1999) and that the Ca2+ release correlates well with the cumulative probability density distribution of first latency of L-type Ca2+ channels or the activation time course of the whole-cell Ca2+ current (Isenberg & Han, 1994). Therefore,
 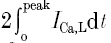 should provide an accurate estimate of the Ca2+ influx that is responsible for triggering Ca2+ release from the SR. It is important to point out that the values obtained using
  to measure trigger Ca2+ are very similar to the integral of ICa,L over the first 20 ms (i.e. ∫ICa,20msdt) which was previously suggested to provide a better measure of ICa,L directly involved in the Ca2+ release process (Fabiato, 1985; Janczewski et al. 1995).
Two definitions of E-C coupling gain were used to assess the efficiency of Ca2+ release from the SR in our studies:
where ∫Frel is the integrated SR Ca2+ release flux or total SR Ca2+ released, and d(CS)/dt is the rate of cell shortening. These estimates of gain are similar to previous definitions of Wier et al. (1994) and Litwin et al. (1998) except that integrated fluxes are used instead of peak fluxes or peak current amplitudes. As a result, the E-C gain was calculated as a ratio of the total SR Ca2+ release to the total trigger Ca2+ influx. This modification was necessary since peak ICa,L amplitude, which has previously been used as a measure of trigger ICa,L during step depolarizations (Wier et al. 1994; Santana et al. 1997; Litwin et al. 1998), depends strongly on the AP profile (see below, Fig. 6) (Bouchard et al. 1995; Kaprielian et al. 1999).
Figure 6. L-type Ca2+ currents and Ca2+ transients evoked by short control and long post-MI action potentials.
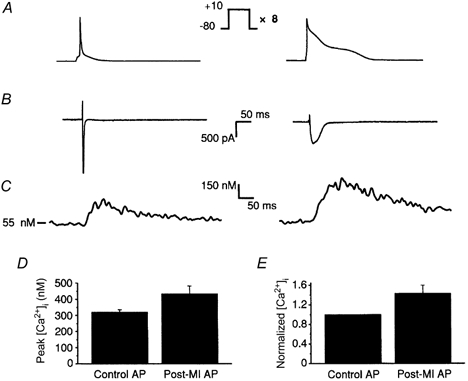
A, the voltage protocols: control (left) and post-MI (right) APs were applied to Cs+-loaded rat ventricular myocytes following a loading train of eight 100 ms steps to +10 mV. B, Ca2+ currents evoked by the control and post-MI APs were measured as Cd2+-sensitive currents and differed in peak amplitude, time to peak and integrated current. Table 1 summarizes the characteristics of ICa,L during control and post-MI APs. C, representative intracellular Ca2+ transients triggered by control and post-MI APs. D, peak systolic Ca2+ was not significantly different between control (319.2 ± 16.1 nm, n = 5) and post-MI APs (433.4 ± 48.2 nm, n = 5). E, normalized peak Ca2+ transients of the post-MI AP were only 1.4-fold greater than the control AP under these intracellular conditions.
From the calculated SR fluxes, another index of calcium release used in our studies was fractional release (FR), which was estimated as the integrated SR Ca2+ flux divided by the measured total SR Ca2+ content following a loading train of 100 ms steps (∫Frel/total SR content).
Data analysis
All data are presented as means ±s.e.m. with the number of cells in parentheses. Comparisons of data for each cell between long post-MI APs and short control APs were performed using Student's two-tailed, paired t test. An unpaired t test was used when comparing data that did not originate from the same myocyte. An experimental P value < 0.05 was considered statistically significant.
RESULTS
Effects of the long post-MI AP profile on [Ca2+]i, cell shortening and SR load
In this study normal, freshly isolated rat cardiomyocytes were stimulated with either short control or long post-MI APs that had been previously recorded in myocytes derived from control or post-MI rats (Fig. 1A). In each case the SR was loaded to a steady-state level by introducing eight conditioning APs (Trafford et al. 1997) after which a test AP was applied. Figure 1B and D (left) shows that peak Ca2+ transient magnitudes in response to stimulation with test APs were significantly elevated from 190 ± 37 nm(n = 5) with short control APs to 417 ± 115 nm(n = 5) with long post-MI APs, without affecting the resting diastolic levels. Associated with elevated Ca2+ transients there was a 2.7-fold increase in peak fractional cell shortening (P < 0.05) triggered by a long post-MI AP (0.084 ± 0.016, n = 7) compared with a short control AP (0.031 ± 0.010, n = 7), shown in Fig. 1C and D (right). These results establish that AP prolongation, as occurs with a reduction in Ito following myocardial infarction, can significantly enhance contractility of the surviving myocytes.
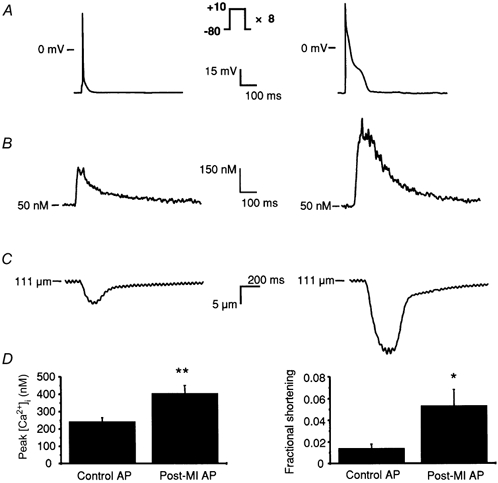
Figure 1. Prolonged action potentials increase Ca2+ transients and unloaded cell shortening in rat cardiac myocytes.

A, trains of eight short control APs (left) and long post-MI APs (right) were used to load the myocyte to steady-state SR Ca2+ load. B, Ca2+ transients measured from the final 9th control AP (left panel) and post-MI AP (right panel). C, unloaded cell shortening associated with the intracellular Ca2+ transient and triggered by the control AP (left) and post-MI AP (right). D, peak intracellular [Ca2+] (left) is elevated 2.2-fold upon stimulation with a post-MI AP relative to the control AP while fractional cell shortening (right) is increased 2.7-fold. *P < 0.05.
The mechanism responsible for increased peak systolic Ca2+ transients and peak cell shortening following AP prolongation may arise from enhanced SR Ca2+ loading, enhanced triggered SR Ca2+ release, or both. To examine the contribution of SR Ca2+ load to these measured changes in [Ca2+]i we recorded the inward Na+-Ca2+ exchange current at -80 mV in response to a rapid application of 20 mm caffeine to the cell, and converted the integrated current into SR Ca2+ content (Varro et al. 1993), using a correction factor of 0.87 to account for Ca2+ extrusion via non-electrogenic means (Bassani et al. 1994). As shown in Fig. 2, the SR Ca2+ content after a train of short control APs (56 ± 7.2 μmol l−1, n = 7) was reduced (P < 0.05) to about half of that measured with long post-MI APs (111 ± 21.6 μmol l−1, n = 4) similar to previous studies (Terracciano et al. 1997).
Figure 2. SR Ca2+ load after conditioning trains of short control and long post-MI action potentials.

Representative current traces of inward Na+-Ca2+ exchange current during a 20 mm caffeine spritz after a train of short control APs (A) and long post-MI APs (B). C, SR Ca2+ content calculated from the integrated Na+-Ca2+ exchange current after loading trains of control APs (56 ± 7.2 μmol l−1, n = 7) and post-MI APs (111 ± 21.6 μmol l−1, n = 4). *P < 0.05.
SR Ca2+ release triggered by control and post-MI APs at equal, low and high SR Ca2+ loads
To address whether the positive inotropic effect of post-MI APs acts via increases in SR Ca2+ load or enhanced triggered Ca2+ release, we applied control and post-MI APs to normal myocytes loaded to a fixed steady-state level of SR Ca2+ using a train of eight 100 ms depolarizing steps to +10 mV (Fig. 3A) (Trafford et al. 1997). Typical intracellular Ca2+ transients and fractional cell shortening are shown in Fig. 3B and C, respectively, while Fig. 3D summarizes the Ca2+ transients and cell shortening from seven to nine cells. On average Ca2+ transients were significantly elevated 1.7-fold (P < 0.005) from 242 ± 22 to 404 ± 46 nm while fractional cell shortening increased 3.8-fold (P < 0.05) from 0.014 ± 0.004 to 0.053 ± 0.015. Thus, under conditions of equal SR Ca2+ load, post-MI AP waveforms alone are capable of triggering significantly more Ca2+ release and evoking a larger degree of cell shortening than control AP waveforms. A comparison of the data in Figs 1 and 3 further reveals that both peak Ca2+ transients and cell shortening triggered by either control or post-MI APs were similar whether myocytes were loaded to different extents with different APs or to the same extent using 100 ms steps. This suggests that changes in the triggering of Ca2+ release, rather than SR load, play a dominant role in mediating enhancements in SR Ca2+ release following AP prolongation under our experimental conditions.
Figure 3. Calcium transients and cell shortening triggered by action potentials under conditions of equal SR load.
A, the voltage protocols: control and post-MI APs were applied to myocytes after a loading protocol of eight 100 ms steps to +10 mV. B, representative Ca2+ transients triggered by the control AP (left) and post-MI AP (right). C, fractional cell shortening associated with the intracellular Ca2+ transients triggered by control (left) and post-MI (right) APs. D, peak Ca2+ transients (left) are elevated 1.7-fold upon stimulation with a post-MI AP relative to the control AP while fractional cell shortening (right) is increased 3.8-fold. *P < 0.05; **P < 0.005.
Next we investigated the possible contributions of SR load in mediating changes in Ca2+ release and cell shortening. Figure 4 shows that, following loading with eight short APs (i.e. low SR load), a post-MI AP triggered significantly (P < 0.05) more Ca2+ release (314 ± 64 nm, n = 7) than a control AP (198 ± 28 nm, n = 7) preceded by eight long post-MI APs (i.e. high SR load). Furthermore, fractional cell shortening was also significantly enhanced (P < 0.05) under these conditions (CScontrol= 0.042 ± 0.010; CSpost-MI= 0.076 ± 0.016, n = 7). Remarkably, the Ca2+ released by a post-MI AP with a low SR load produced a 1.6-fold increase in peak [Ca2+]i transient relative to control APs with a high SR load (Fig. 4D). By comparison, post-MI APs caused a 2.2-fold increase compared with control APs under the opposite loading conditions (Fig. 1). Thus, while the positive inotropic effects of AP prolongation appears to be dominated by enhancements in triggered SR Ca2+ release, a measurable, yet small, contribution of SR Ca2+ load to Ca2+ release also exists under our experimental conditions.
Figure 4. Effect of high and low SR load on Ca2+ transients and cell shortening triggered by action potentials.
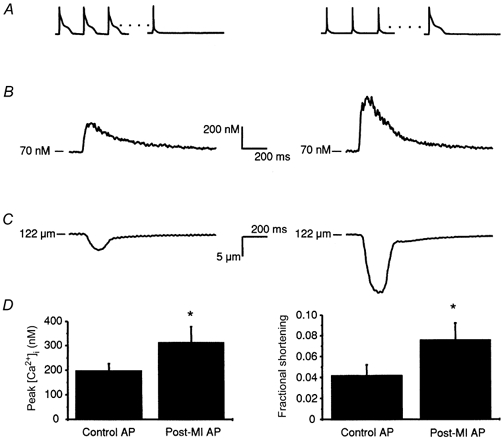
A, the voltage protocols: trains of eight post-MI APs (left) or control APs (right) were used to achieve a high or low steady-state SR load. Ca2+ release was then triggered from the SR with either a control AP (left) or post-MI AP (right). B, representative intracellular Ca2+ transients triggered by the high SR load/control AP protocol (left) and low SR load/post-MI AP protocol (right). C, typical fractional cell shortening associated with the Ca2+ transients shown in B. D, peak Ca2+ transients (left) triggered by post-MI APs under conditions of low SR load are increased 1.6-fold over transients triggered by control APs at a high SR load, while fractional shortening measurements (right) show a 1.8-fold difference between low SR load/post-MI AP and high SR load/control AP protocols. *P < 0.05.
To further quantify the relative contributions of trigger and SR Ca2+ load to the amount of Ca2+ released from the SR following changes in AP profile, we calculated Δ[Ca2+] ([Ca2+]systolic - [Ca2+]diastolic) since this should provide a better measure of the changes in [Ca2+]i resulting from SR Ca2+ release than does peak [Ca2+]i (Han et al. 1994; Isenberg & Han, 1994; Janczewski et al. 1995; Santana et al. 1997). To eliminate inter-cell variability in this analysis, the Δ[Ca2+]i released for each protocol was normalized by the response measured during a control AP following loading with a train of control APs. As shown in Fig. 5, the Ca2+ released at either low or high SR loads increased ≈2-fold when short control APs were replaced with long post-MI APs as expected if the trigger for Ca2+ release is the dominant determinant of release. This is similar to the 1.7-fold enhancement in Ca2+ release shown in Fig. 3 between control and post-MI APs under equal SR Ca2+ load conditions. On the other hand, the relative increase in Ca2+ release due to changes in SR load from low to high was found to be only 1.2-fold when triggered with either a short control or long post-MI AP. Collectively, these data strongly suggest that changes in SR Ca2+ load account for at most about 20 % of the differences in contractility observed following AP prolongation.
Figure 5. Effect of control and post-MI action potentials on Ca2+ release at low and high SR Ca2+ loads.
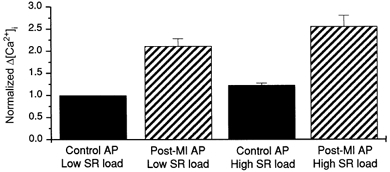
Relative Ca2+ release triggered by control and post-MI APs at low (control AP train) and high (post-MI AP train) SR loads. Data are normalized to the amplitude of Δ[Ca2+]i triggered by the control AP at a low SR load.
Efficiency of SR Ca2+ release by control and post-MI APs
Having demonstrated that alterations in the AP waveform are capable of enhancing SR Ca2+ release, the question remains whether this arises exclusively from changes in ICa,L or whether there are also changes in the efficiency of Ca2+ release by ICa,L. To quantify the efficiency of SR Ca2+ release, ICa,L was measured simultaneously with Ca2+ transients. L-type Ca2+ current was recorded by a near complete replacement of intracellular K+ with Cs+ to eliminate interfering potassium currents and superfusion of the myocytes with extracellular solution containing 30 μm TTX to eliminate Na+ currents. The records in Fig. 6 show the Cd2+-sensitive L-type Ca2+ currents and associated intracellular Ca2+ transients produced by short control (left) and long post-MI APs (right) after loading with eight 100 ms steps. The amplitude and time course of Ca2+ influx driven by control and post-MI APs were remarkably different (Fig. 6B, left and right, respectively) and their characteristics are summarized in Table 1. Despite an ≈2-fold reduction in peak ICa,L (P < 0.001) with the post-MI AP relative to the control AP (ICa,L,control= 13.5 ± 1.9 pA pF−1, ICa,L,post-MI= 6.2 ± 1.4 pA pF−1, n = 5), the total integrated ICa,L (Qcontrol= 8.2 ± 1.4 pC, Qpost-MI= 23.8 ± 4.3 pC, n = 5) was actually increased about 3-fold (P < 0.01).
Table 1.
Parameters describing L-type Ca2+ flux and SR Ca2+ release during control and post-MI APs
| AP | ICa,L (pA pF−1) | QCa,L (pC) | ∫FCa,L (μm) | ∫Frel (μm) | d(CS)/dt (μm s−1) | |
|---|---|---|---|---|---|---|
| Control AP | 13.5 ± 1.9 | 8.2 ± 1.4 | 7.7 ± 1.4 | 0.39 ± 0.07 | 31.7 ± 4.5 | 33 ± 9.4 |
| Post-MI AP | 6.2 ± 1.4* | 23.8 ± 4.3* | 14.1 ± 2.9* | 0.71 ± 0.15* | 70.9 ± 8.4* | 88.8 ± 20* |
Calcium influx and SR Ca2+ release were triggered by AP clamps after loading with eight 100 ms square waves as shown in Figs 6 and 7. ICa,L, peak Ca2+ current; QCa,L, total charge influx obtained by integrating the L-type Ca2+ current trace (n = 5);  indicates the charge influx reflecting the first latency of Ca2+ channel openings (n = 5); ∫FCa,L, the integrated trans-sarcolemmal Ca2+ flux derived from
  (n = 5); ∫Frel, the integrated SR Ca2+ release flux (n = 9); d(CS)/dt, the rate of cell shortening (n = 8). Both ∫FCa,L and ∫Frel are Ca2+ concentrations in the Ca2+-accessible cell volume or half the total cell volume (Sipido & Wier, 1991).
P < 0 05.
As expected from the differences in integrated ICa,L, Fig. 6C and D further establishes that peak Ca2+ transients were elevated following stimulation with post-MI relative to control APs, although the effect was less pronounced, possibly due to the replacement of K+ with Cs+, which impairs SR Ca2+ release (Levi et al. 1996; Wasserstrom & Vites, 1996; Litwin et al. 1998) (see Discussion). On the other hand, Ca2+ channel gating has previously been shown to be largely unaffected by high intracellular [Cs+] (Levi et al. 1996). Therefore, in an attempt to obtain the best estimate of the true E-C coupling gain, we decided to combine the ICa,L recordings from the Cs+ studies with the Ca2+ transient and cell shortening data recorded using high K+ pipette solutions (Isenberg & Han, 1994) (shown previously in Fig. 3), although similar results were observed when Ca2+ transients are recorded in the presence of Cs+ (see Discussion).
Excitation-contraction coupling gains provide estimates of the effectiveness of Ca2+ release in response to the ICa,L trigger and have been calculated previously in a number of different ways (Wier et al. 1994; Janczewski et al. 1995; Santana et al. 1997; Litwin et al. 1998). We used two different definitions (see Methods for rationale and details): E-C gain1=∫Frel/∫FCa,L and E-C gain2= d(CS)/dt/∫FCa,L. As stated in Methods, our definitions required integration of the Frel and FCa,L since the kinetic properties of ICa,L are strongly influenced by the AP profile. Typical SR release fluxes, Frel, triggered by long post-MI and short control APs are shown in Fig. 7C, right and left, respectively, with their associated intracellular Ca2+ transients plotted in Fig. 7B. Figure 7D shows the corresponding rates of cell shortening. For the purposes of calculating E-C coupling gain, the integrated SR Ca2+ flux (∫Frel, see Table 1), was used to provide an estimate of the total Ca2+ released from the SR. Using the first definition of E-C coupling gain, the efficiency of Ca2+ release by ICa,L during a long post-MI AP was elevated about 1.2-fold (P < 0.05) over the control AP (Fig. 8A). Similarly, the second definition of gain indicated a 1.5-fold (P < 0.05) enhancement in SR Ca2+ release efficiency by the long post-MI AP as compared with the short control AP (Fig. 8B). The calcium release from the SR was also quantified by calculating the fractional SR Ca2+ release by post-MI and control APs following 100 ms loading steps. The total SR content under these conditions was measured as 148 ± 15 μmol l−1 and the fraction of SR Ca2+ released (FR) by the post-MI AP (24 ± 3 %, n = 9) was found to be elevated compared with the control AP (11 ± 2 %, n = 9) (Fig. 8C). Normalizing the FR to the integrated L-type Ca2+ flux (FR/∫FCa,L; Fig. 8D) revealed a 1.2-fold relative increase between control and post-MI APs. These results suggest that AP prolongation not only enhances triggered Ca2+ release by producing a more powerful Ca2+ influx trigger, but also modestly increases the efficiency of SR Ca2+ release by ICa,L.
Figure 7. Parameters reflecting Ca2+ release in isolated rat ventricular myocytes.
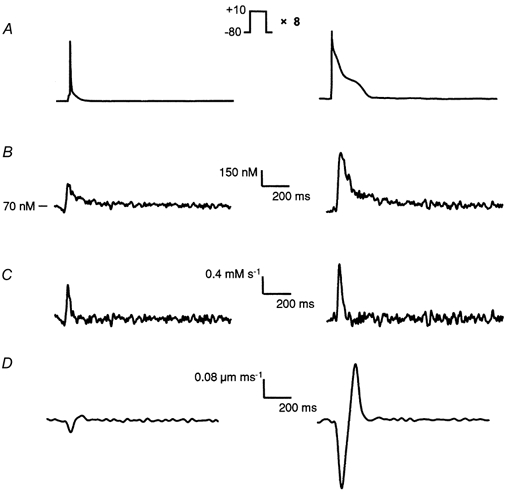
A, control (left) and post-MI (right) APs were applied to myocytes after a loading protocol of eight 100 ms steps to +10 mV. B, kinetically corrected intracellular Ca2+ transients triggered by control and post-MI APs. These data were used to calculate the SR release flux, Frel, according to the equation: d[Ca2+]i/dt =Frel+Fpump+Fleak+Σd[CaL]/dt (see Methods). C, SR release flux, Frel, triggered by short control and long post-MI APs. D, rate of unloaded cell shortening, d(CS)/dt, triggered by control and post-MI APs.
DISCUSSION
Changes in AP morphology and duration occur with heart disease in humans as well as in numerous animal models and are typically associated with reductions in transient outward currents (Beuckelmann et al. 1993; Coulombe et al. 1994; Wettwer et al. 1994; Potreau et al. 1995; Kaab et al. 1996; Wickenden et al. 1998; Kaprielian et al. 1999). We have shown previously that following myocardial infarction Ca2+ transient amplitudes are increased as a result of AP prolongation (Kaprielian et al. 1999). In this study, we extended this work by examining the possible mechanisms responsible for these observations.
Measurements of caffeine-induced Na+-Ca2+ exchange current revealed a doubling of the steady-state SR Ca2+ content in myocytes stimulated with post-MI APs versus control APs. However, changes in SR load only accounted for a fraction of the increased Ca2+ transient amplitude associated with AP prolongation characteristically observed in diseased myocardium (Kaprielian et al. 1999). Specifically, Δ[Ca2+]i was only increased by about 20 % when the SR load was elevated by loading with long post-MI APs whether the trigger for Ca2+ release was a short control or long post-MI AP. By contrast, with equal SR Ca2+ loads, the increase in Ca2+ release triggered by the post-MI AP was consistently found to be about 2-fold larger than the control AP trigger regardless of the loading protocol. This relationship between Ca2+ release, SR load and AP trigger suggests that the effects of SR load on Ca2+ release, under the experimental conditions used in the present study (high intracellular K+, 23 °C), are small relative to the effects of the AP profile in triggering release. At first glance these findings appear to contradict a previous report concluding that the positive inotropic effects following AP prolongation result from increased SR Ca2+ loading (Bouchard et al. 1995). This discrepancy might be readily explained by differences in the experimental conditions. In our study, we compared the effects of long and short APs obtained from post-MI and control myocytes, which may be very different from studies using high doses of 4-aminopyridine (4-AP) to prolong APs. In addition, our experiments were conducted using high intracellular K+ solutions while those of Bouchard et al. (1995) used Cs+ to replace K+. Previous reports have consistently shown significant changes in E-C coupling when K+-based intracellular solutions are replaced with Cs+ (Levi et al. 1996; Wasserstrom & Vites, 1996; Litwin & Bridge, 1997), apparently as a result of the inhibitory action of Cs+ on both SR Ca2+ release (Litwin & Bridge, 1997) and the contribution of the Na+-Ca2+ exchanger to the Ca2+ release process (Levi et al. 1996; Wasserstrom & Vites, 1996). In concordance with these studies we found that the enhancement of peak [Ca2+]i by long post-MI APs relative to short control APs was reduced from 1.7-fold in the presence of high K+ to only 1.4-fold in the presence of Cs+. Regardless, recording in the presence of intracellular K+ is unquestionably more physiologically relevant when studying the mechanism by which changes in AP profile affect intracellular Ca2+ and inotropy in disease (Isenberg & Han, 1994; Levi et al. 1996; Wasserstrom & Vites, 1996).
It is clear that reductions in Ito and resultant prolongation of the rat cardiac AP cause increased Ca2+ release from the SR, independent of the SR Ca2+ load. It seems reasonable to postulate that the differences in the release of Ca2+ between long post-MI and short control APs are a consequence, at least in part, of differences in Ca2+ influx ‘trigger’ (Fig. 6B) (Bassani et al. 1995; Lopez-Lopez et al. 1995; Santana et al. 1996). The Ca2+ current from the control AP has a large amplitude but a very short duration compared with post-MI APs, which probably reflects the relative differences in the rate of deactivation, associated with repolarization, versus inactivation of ICa,L (Kaprielian et al. 1999). The effects of Ito on the trajectory of early repolarization of the AP and its close temporal association with Ca2+ channel gating may account for the ability of changes in Ito to so profoundly modulate Ca2+ influx. Indeed, Ca2+ release depends steeply on the early portion of the pulse stimulus between 0 and 20 ms, and not on pulses of longer duration (Han et al. 1994; Isenberg & Han, 1994; P. H. Backx & R. Kaprielian, unpublished observations). The differences in integrated L-type Ca2+ current between control and post-MI APs may reflect changes in the degree of activation of ICa,L. Since the upstroke velocities and peaks of control and post-MI APs are quite similar, the enhanced activation of ICa,L by the post-MI AP could result from a slower repolarization rate, thereby allowing more time for Ca2+ channel activation. Therefore, the enhanced Ca2+ release triggered by post-MI APs may result from the recruitment of more Ca2+ release units by a larger, more sustained L-type Ca2+ influx. On the other hand, the large but short-lived L-type Ca2+ flux occurring during short control APs may reflect the transient opening of smaller numbers of Ca2+ channels and thus activate fewer Ca2+ release units.
To assess whether the enhanced Ca2+ transient amplitudes could be attributed exclusively to larger Ca2+ triggers or whether changes in the efficiency of Ca2+ release also occur when myocytes are stimulated with a post-MI AP, we calculated the E-C coupling gain. We formulated two definitions of E-C coupling gain, (1) ∫Frel/∫FCa,L and (2) d(CS)/dt/∫FCa,L, based in part on previous reports (Wier et al. 1994; Janczewski et al. 1995; Santana et al. 1997; Litwin et al. 1998). Both definitions of E-C coupling gain predicted that the efficiency of Ca2+ release increased modestly in comparison to enhancements in either cell shortening or Ca2+ transient amplitude when stimulated with long post-MI APs versus short control APs. These findings suggest that it is the increase in trigger Ca2+ through L-type Ca2+ channels that is primarily responsible for the enhancement in contractility observed with AP prolongation.
Interestingly, the relative increase in E-C coupling gain was larger when cell shortening rate (Fig. 8B) rather than SR Ca2+ release (Fig. 8A) was used as a measure of E-C coupling. This finding is consistent with the existence of an inherent amplification factor between intracellular Ca2+ and activation of contractile proteins due to the very steep relationship between contractile force and [Ca2+]i arising from the positive cooperativity of Ca2+ binding to troponin C (Backx et al. 1995). These results suggest that a distinction should generally be made between contraction and release following myocyte excitation. Alternatively, the difference in gains as assessed by Ca2+ release versus cell shortening may also arise from the absence of Na+-Ca2+ exchange current, INa-Ca, in the equation describing Frel. Under our experimental conditions Na+-Ca2+ exchange is present but was not included in the estimation of Frel. Calcium efflux through the exchanger will result in an underestimation of Frel and this efflux is expected to be greater with long post-MI APs since peak intracellular Ca2+ levels are higher.
The mechanism by which a prolonged post-MI AP increases the efficiency of Ca2+ release is unclear. One possible explanation may be enhancements of reverse-mode Na+-Ca2+ exchange since the magnitude and time course of reverse-mode Na+-Ca2+ exchange depend strongly on the profile of the AP during this time period (Bers, 1992). This possibility is supported by recent studies showing that reverse mode Na+-Ca2+ exchange activity works synergistically with ICa,L in triggering Ca2+ release from the SR (Litwin et al. 1998; Cordeiro et al. 2000; Piacentino & Houser, 2000). Studies are currently underway in our laboratory to determine the potential role of the Na+-Ca2+ exchanger in modulating Ca2+ release following changes in action potential profile.
In this study the effects of AP prolongation on E-C coupling following infarction were examined by comparing Ca2+ release in healthy rat ventricular myocytes stimulated with APs previously recorded from control and post-MI rat myocytes. The similarity of the changes in intracellular Ca2+ measured following AP prolongation in normal myocytes versus post-infarction myocytes substantiates further our previous conclusion that elevated Ca2+ transients following infarction are due primarily to AP prolongation (Kaprielian et al. 1999). However, numerous other genetic, biochemical and morphological changes, aside from Ito downregulation, can affect intracellular Ca2+ handling, E-C coupling and AP profile in heart disease (Gwathmey et al. 1987; Beuckelmann et al. 1992; Arai et al. 1993; Gomez et al. 1997; Litwin & Bridge, 1997; Balke & Shorofsky, 1998; O'Rourke et al. 1999; Shorofsky et al. 1999). Therefore, the effect of AP prolongation on E-C coupling shown in our studies may be modulated by other changes affecting Ca2+ handling in diseased myocytes. Nevertheless, our results show that AP profile-mediated alterations in E-C coupling can significantly influence Ca2+ handling in heart disease independent of these other possible contributing effects.
Recently, Shorofsky et al. (1999) and Gomez et al. (1997) published contradictory results regarding changes in E-C coupling in the spontaneous hypertensive rat (SHR). Both studies used square wave voltage clamp waveforms to trigger Ca2+ release and thereby ignored the possible influences of AP profile on E-C coupling. Indeed, SHRs have prolonged APs (Brooksby et al. 1993; Cerbai et al. 1994), reductions in Ito (Cerbai et al. 1994) and elevated Ca2+ transients similar to those seen following myocardial infarction (Kaprielian et al. 1999). Based on our findings, AP prolongation in other heart disease models should be considered when drawing conclusions about changes in E-C coupling within the context of disease.
Although we studied the effects of AP prolongation following myocardial infarction on E-C coupling in the rat, similar changes in AP profile may also affect E-C coupling in failing human myocytes. Human epicardial myocytes have been shown to have a relatively high transient outward current density, which is believed to be responsible for their short, notched APs (Nabauer et al. 1996). In human heart failure, a reduction in Ito is associated with a slowed rate of early repolarization and a loss of the AP notch (Beuckelmann et al. 1993; Kaab et al. 1996). Based on our findings, changes in the profile of the human AP as occur in heart failure could conceivably also affect trigger ICa,L and E-C coupling efficiency thereby influencing contractility in a manner similar to what we have found in rat.
In summary, our results establish that the positive inotropic effects of prolonged APs as observed following myocardial infarction in rat are mediated primarily through increases in triggered Ca2+ release rather than enhanced SR loads. This increase in Ca2+ release is due to stronger trigger Ca2+ influxes through L-type Ca2+ channels coupled with modest enhancements of Ca2+ release efficiency. The effect of Ito on excitation- contraction coupling via alterations in AP morphology may represent an important compensatory process by which the myocardium increases contractility following an infarction.
Acknowledgments
This study was supported by a Heart & Stroke Foundation of Ontario grant to P.H.B. R.S. is the recipient of a MD/PhD Studentship from the Medical Research Council of Canada, R.J.R. is the recipient of a Heart & Stroke/Richard Lewar Centre of Excellence Fellowship, R.K. holds an MRC Doctoral Research Award and P.H.B. is a Career Investigator of the Heart & Stroke Foundation of Ontario. We are grateful for equipment support from the Tiffin Trust Fund and the Centre for Cardiovascular Research at the University of Toronto.
References
- Arai M, Alpert NR, Maclennan DH, Barton P, Periasamy M. Alterations in sarcoplasmic reticulum gene expression in human heart failure. A possible mechanism for alterations in systolic and diastolic properties of the failing myocardium. Circulation Research. 1993;72:463–469. doi: 10.1161/01.res.72.2.463. [DOI] [PubMed] [Google Scholar]
- Backx PH, Gao WD, Azan-Backx MD, Marban E. The relationship between contractile force and intracellular [Ca2+] in intact rat cardiac trabeculae. Journal of General Physiology. 1995;105:1–19. doi: 10.1085/jgp.105.1.1. [DOI] [PMC free article] [PubMed] [Google Scholar]
- Balke CW, Egan TM, Wier WG. Processes that remove calcium from the cytoplasm during excitation- contraction coupling in intact rat heart cells. Journal of Physiology. 1994;474:447–462. doi: 10.1113/jphysiol.1994.sp020036. [DOI] [PMC free article] [PubMed] [Google Scholar]
- Balke CW, Shorofsky SR. Alterations in calcium handling in cardiac hypertrophy and heart failure. Cardiovascular Research. 1998;37:290–299. doi: 10.1016/s0008-6363(97)00272-1. [DOI] [PubMed] [Google Scholar]
- Bassani JW, Bassani RA, Bers DM. Relaxation in rabbit and rat cardiac cells: species-dependent differences in cellular mechanisms. Journal of Physiology. 1994;476:279–293. doi: 10.1113/jphysiol.1994.sp020130. [DOI] [PMC free article] [PubMed] [Google Scholar]
- Bassani JW, Yuan W, Bers DM. Fractional SR Ca release is regulated by trigger Ca and SR Ca content in cardiac myocytes. American Journal of Physiology. 1995;268:C1313–1319. doi: 10.1152/ajpcell.1995.268.5.C1313. [DOI] [PubMed] [Google Scholar]
- Baylor SM, Hollingworth S. Fura-2 calcium transients in frog skeletal muscle fibres. Journal of Physiology. 1988;403:151–192. doi: 10.1113/jphysiol.1988.sp017244. published erratum appears in Journal of Physiology 407,616. [DOI] [PMC free article] [PubMed] [Google Scholar]
- Bers DM. Excitation-Contraction Coupling and Cardiac Contractile Force. Dordrecht, Netherlands: Kluwer Academic Press; 1992. pp. 1–258. [Google Scholar]
- Beuckelmann DJ, Nabauer M, Erdmann E. Intracellular calcium handling in isolated ventricular myocytes from patients with terminal heart failure. Circulation. 1992;85:1046–1055. doi: 10.1161/01.cir.85.3.1046. [DOI] [PubMed] [Google Scholar]
- Beuckelmann DJ, Nabauer M, Erdmann E. Alterations of K+ currents in isolated human ventricular myocytes from patients with terminal heart failure. Circulation Research. 1993;73:379–385. doi: 10.1161/01.res.73.2.379. [DOI] [PubMed] [Google Scholar]
- Bouchard RA, Clark RB, Giles WR. Effects of action potential duration on excitation-contraction coupling in rat ventricular myocytes. Action potential voltage-clamp measurements. Circulation Research. 1995;76:790–801. doi: 10.1161/01.res.76.5.790. [DOI] [PubMed] [Google Scholar]
- Brooksby P, Levi AJ, Jones JV. Investigation of the mechanisms underlying the increased contraction of hypertrophied ventricular myocytes isolated from the spontaneously hypertensive rat. Cardiovascular Research. 1993;27:1268–1277. doi: 10.1093/cvr/27.7.1268. [DOI] [PubMed] [Google Scholar]
- Cerbai E, Barbieri M, Li Q, Mugelli A. Ionic basis of action potential prolongation of hypertrophied cardiac myocytes isolated from hypertensive rats of different ages. Cardiovascular Research. 1994;28:1180–1187. doi: 10.1093/cvr/28.8.1180. [DOI] [PubMed] [Google Scholar]
- Cleemann L, Wang W, Morad M. Two-dimensional confocal images of organization, density, and gating of focal Ca2+ release sites in rat cardiac myocytes. Proceedings of the National Academy of Sciences of the USA. 1998;95:10984–10989. doi: 10.1073/pnas.95.18.10984. [DOI] [PMC free article] [PubMed] [Google Scholar]
- Collier ML, Thomas AP, Berlin JR. Relationship between L-type Ca2+ current and unitary sarcoplasmic reticulum Ca2+ release events in rat ventricular myocytes. Journal of Physiology. 1999;516:117–128. doi: 10.1111/j.1469-7793.1999.117aa.x. [DOI] [PMC free article] [PubMed] [Google Scholar]
- Cordeiro J, Litwin S, Bridge J. Can NCX rapidly set the gain of EC coupling without directly triggering SR Ca release in the heart. Biophysical Journal. 2000;78 A2202 abstract. [Google Scholar]
- Coulombe A, Momtaz A, Richer P, Swynghedauw B, Coraboeuf E. Reduction of calcium-independent transient outward potassium current density in DOCA salt hypertrophied rat ventricular myocytes. Pflügers Archiv. 1994;427:47–55. doi: 10.1007/BF00585941. [DOI] [PubMed] [Google Scholar]
- Fabiato A. Simulated calcium current can both cause calcium loading in and trigger calcium release from the sarcoplasmic reticulum of a skinned canine cardiac Purkinje cell. Journal of General Physiology. 1985;85:291–320. doi: 10.1085/jgp.85.2.291. [DOI] [PMC free article] [PubMed] [Google Scholar]
- Ferrier GR, Zhu J, Redondo IM, Howlett SE. Role of cAMP-dependent protein kinase A in activation of a voltage-sensitive release mechanism for cardiac contraction in guinea-pig myocytes. Journal of Physiology. 1998;513:185–201. doi: 10.1111/j.1469-7793.1998.185by.x. [DOI] [PMC free article] [PubMed] [Google Scholar]
- Fiset C, Clark RB, Larsen TS, Giles WR. A rapidly activating sustained K+ current modulates repolarization and excitation-contraction coupling in adult mouse ventricle. Journal of Physiology. 1997;504:557–563. doi: 10.1111/j.1469-7793.1997.557bd.x. [DOI] [PMC free article] [PubMed] [Google Scholar]
- Gomez AM, Valdivia HH, Cheng H, Lederer MR, Santana LF, Cannell MB, Mccune SA, Altschuld RA, Lederer WJ. Defective excitation-contraction coupling in experimental cardiac hypertrophy and heart failure. Science. 1997;276:800–806. doi: 10.1126/science.276.5313.800. [DOI] [PubMed] [Google Scholar]
- Gwathmey JK, Copelas L, Mackinnon R, Schoen FJ, Feldman MD, Grossman W, Morgan JP. Abnormal intracellular calcium handling in myocardium from patients with end-stage heart failure. Circulation Research. 1987;61:70–76. doi: 10.1161/01.res.61.1.70. [DOI] [PubMed] [Google Scholar]
- Hamill OP, Marty A, Neher E, Sakmann B, Sigworth FJ. Improved patch-clamp techniques for high-resolution current recording from cells and cell-free membrane patches. Pflügers Archiv. 1981;391:85–100. doi: 10.1007/BF00656997. [DOI] [PubMed] [Google Scholar]
- Han S, Schiefer A, Isenberg G. Ca2+ load of guinea-pig ventricular myocytes determines efficacy of brief Ca2+ currents as trigger for Ca2+ release. Journal of Physiology. 1994;480:411–421. doi: 10.1113/jphysiol.1994.sp020371. [DOI] [PMC free article] [PubMed] [Google Scholar]
- Howlett SE, Zhu JQ, Ferrier GR. Contribution of a voltage-sensitive calcium release mechanism to contraction in cardiac ventricular myocytes. American Journal of Physiology. 1998;274:H155–170. doi: 10.1152/ajpheart.1998.274.1.H155. [DOI] [PubMed] [Google Scholar]
- Isenberg G, Han S. Gradation of Ca2+-induced Ca2+ release by voltage-clamp pulse duration in potentiated guinea-pig ventricular myocytes. Journal of Physiology. 1994;480:423–438. doi: 10.1113/jphysiol.1994.sp020372. [DOI] [PMC free article] [PubMed] [Google Scholar]
- Janczewski AM, Spurgeon HA, Stern MD, Lakatta EG. Effects of sarcoplasmic reticulum Ca2+ load on the gain function of Ca2+ release by Ca2+ current in cardiac cells. American Journal of Physiology. 1995;268:H916–920. doi: 10.1152/ajpheart.1995.268.2.H916. [DOI] [PubMed] [Google Scholar]
- Kaab S, Nuss HB, Chiamvimonvat N, O'rourke B, Pak PH, Kass DA, Marban E, Tomaselli GF. Ionic mechanism of action potential prolongation in ventricular myocytes from dogs with pacing-induced heart failure. Circulation Research. 1996;78:262–273. doi: 10.1161/01.res.78.2.262. [DOI] [PubMed] [Google Scholar]
- Kaprielian R, Wickenden AD, Kassiri Z, Parker TG, Liu PP, Backx PH. Relationship between K+ channel down-regulation and [Ca2+]i in rat ventricular myocytes following myocardial infarction. Journal of Physiology. 1999;517:229–245. doi: 10.1111/j.1469-7793.1999.0229z.x. [DOI] [PMC free article] [PubMed] [Google Scholar]
- Levesque PC, Leblanc N, Hume JR. Role of reverse-mode Na+-Ca2+ exchange in excitation-contraction coupling in the heart. Annals of the New York Academy of Sciences. 1991;639:386–397. doi: 10.1111/j.1749-6632.1991.tb17327.x. [DOI] [PubMed] [Google Scholar]
- Levi AJ, Mitcheson JS, Hancox JC. The effect of internal sodium and caesium on phasic contraction of patch-clamped rabbit ventricular myocytes. Journal of Physiology. 1996;492:1–19. doi: 10.1113/jphysiol.1996.sp021284. [DOI] [PMC free article] [PubMed] [Google Scholar]
- Litwin SE, Bridge JH. Enhanced Na+-Ca2+ exchange in the infarcted heart. Implications for excitation-contraction coupling. Circulation Research. 1997;81:1083–1093. doi: 10.1161/01.res.81.6.1083. [DOI] [PubMed] [Google Scholar]
- Litwin SE, Li J, Bridge JH. Na-Ca exchange and the trigger for sarcoplasmic reticulum Ca release: studies in adult rabbit ventricular myocytes. Biophysical Journal. 1998;75:359–371. doi: 10.1016/S0006-3495(98)77520-4. [DOI] [PMC free article] [PubMed] [Google Scholar]
- Lopez-Lopez JR, Shacklock PS, Balke CW, Wier WG. Local calcium transients triggered by single L-type calcium channel currents in cardiac cells. Science. 1995;268:1042–1045. doi: 10.1126/science.7754383. [DOI] [PubMed] [Google Scholar]
- Nabauer M, Beuckelmann DJ, Uberfuhr P, Steinbeck G. Regional differences in current density and rate-dependent properties of the transient outward current in subepicardial and subendocardial myocytes of human left ventricle. Circulation. 1996;93:168–177. doi: 10.1161/01.cir.93.1.168. [DOI] [PubMed] [Google Scholar]
- O'rourke B, Kass DA, Tomaselli GF, Kaab S, Tunin R, Marban E. Mechanisms of altered excitation-contraction coupling in canine tachycardia-induced heart failure, I: experimental studies. Circulation Research. 1999;84:562–570. doi: 10.1161/01.res.84.5.562. [DOI] [PubMed] [Google Scholar]
- Page E. Quantitative ultrastructural analysis in cardiac membrane physiology. American Journal of Physiology. 1978;235:C147–158. doi: 10.1152/ajpcell.1978.235.5.C147. [DOI] [PubMed] [Google Scholar]
- Piacentino V, III, Houser S. Reverse-mode Na+-Ca2+ exchange modulates SR Ca2+ release caused by the L-type Ca2+ current. Biophysical Journal. 2000;78 A2206 abstract. [Google Scholar]
- Potreau D, Gomez JP, Fares N. Depressed transient outward current in single hypertrophied cardiomyocytes isolated from the right ventricle of ferret heart. Cardiovascular Research. 1995;30:440–448. [PubMed] [Google Scholar]
- Rose WC, Balke CW, Wier WG, Marban E. Macroscopic and unitary properties of physiological ion flux through L-type Ca2+ channels in guinea-pig heart cells. Journal of Physiology. 1992;456:267–284. doi: 10.1113/jphysiol.1992.sp019336. [DOI] [PMC free article] [PubMed] [Google Scholar]
- Santana LF, Cheng H, Gomez AM, Cannell MB, Lederer WJ. Relation between the sarcolemmal Ca2+ current and Ca2+ sparks and local control theories for cardiac excitation-contraction coupling. Circulation Research. 1996;78:166–171. doi: 10.1161/01.res.78.1.166. [DOI] [PubMed] [Google Scholar]
- Santana LF, Kranias EG, Lederer WJ. Calcium sparks and excitation-contraction coupling in phospholamban- deficient mouse ventricular myocytes. Journal of Physiology. 1997;503:21–29. doi: 10.1111/j.1469-7793.1997.021bi.x. [DOI] [PMC free article] [PubMed] [Google Scholar]
- Sham JS, Song LS, Chen Y, Deng LH, Stern MD, Lakatta EG, Cheng H. Termination of Ca2+ release by a local inactivation of ryanodine receptors in cardiac myocytes. Proceedings of the National Academy of Sciences of the USA. 1998;95:15096–15101. doi: 10.1073/pnas.95.25.15096. [DOI] [PMC free article] [PubMed] [Google Scholar]
- Shorofsky SR, Aggarwal R, Corretti M, Baffa JM, Strum JM, Al-Seikhan BA, Kobayashi YM, Jones LR, Wier WG, Balke CW. Cellular mechanisms of altered contractility in the hypertrophied heart: big hearts, big sparks. Circulation Research. 1999;84:424–434. doi: 10.1161/01.res.84.4.424. [DOI] [PubMed] [Google Scholar]
- Sipido KR, Maes M, Van de werf F. Low efficiency of Ca2+ entry through the Na+-Ca2+ exchanger as trigger for Ca2+ release from the sarcoplasmic reticulum. A comparison between L-type Ca2+ current and reverse-mode Na+-Ca2+ exchange. Circulation Research. 1997;81:1034–1044. doi: 10.1161/01.res.81.6.1034. [DOI] [PubMed] [Google Scholar]
- Sipido KR, Wier WG. Flux of Ca2+ across the sarcoplasmic reticulum of guinea-pig cardiac cells during excitation- contraction coupling. Journal of Physiology. 1991;435:605–630. doi: 10.1113/jphysiol.1991.sp018528. [DOI] [PMC free article] [PubMed] [Google Scholar]
- Terracciano CM, Macleod KT. Measurements of Ca2+ entry and sarcoplasmic reticulum Ca2+ content during the cardiac cycle in guinea pig and rat ventricular myocytes. Biophysical Journal. 1997;72:1319–1326. doi: 10.1016/S0006-3495(97)78778-2. [DOI] [PMC free article] [PubMed] [Google Scholar]
- Terracciano CM, Tweedie D, Macleod KT. The effects of changes to action potential duration on the calcium content of the sarcoplasmic reticulum in isolated guinea-pig ventricular myocytes. Pflügers Archiv. 1997;433:542–544. doi: 10.1007/s004240050312. [DOI] [PubMed] [Google Scholar]
- Trafford AW, Diaz ME, Negretti N, Eisner DA. Enhanced Ca2+ current and decreased Ca2+ efflux restore sarcoplasmic reticulum Ca2+ content after depletion. Circulation Research. 1997;81:477–484. doi: 10.1161/01.res.81.4.477. [DOI] [PubMed] [Google Scholar]
- Varro A, Negretti N, Hester SB, Eisner DA. An estimate of the calcium content of the sarcoplasmic reticulum in rat ventricular myocytes. Pflügers Archiv. 1993;423:158–160. doi: 10.1007/BF00374975. [DOI] [PubMed] [Google Scholar]
- Wasserstrom JA, Vites AM. The role of Na+-Ca2+ exchange in activation of excitation-contraction coupling in rat ventricular myocytes. Journal of Physiology. 1996;493:529–542. doi: 10.1113/jphysiol.1996.sp021401. [DOI] [PMC free article] [PubMed] [Google Scholar]
- Wettwer E, Amos GJ, Posival H, Ravens U. Transient outward current in human ventricular myocytes of subepicardial and subendocardial origin. Circulation Research. 1994;75:473–482. doi: 10.1161/01.res.75.3.473. [DOI] [PubMed] [Google Scholar]
- Wickenden AD, Kaprielian R, Kassiri Z, Tsoporis JN, Tsushima R, Fishman GI, Backx PH. The role of action potential prolongation and altered intracellular calcium handling in the pathogenesis of heart failure. Cardiovascular Research. 1998;37:312–323. doi: 10.1016/s0008-6363(97)00256-3. [DOI] [PubMed] [Google Scholar]
- Wickenden AD, Kaprielian R, Parker TG, Jones OT, Backx PH. Effects of development and thyroid hormone on K+ currents and K+ channel gene expression in rat ventricle. Journal of Physiology. 1997;504:271–286. doi: 10.1111/j.1469-7793.1997.271be.x. [DOI] [PMC free article] [PubMed] [Google Scholar]
- Wier WG, Egan TM, Lopez-Lopez JR, Balke CW. Local control of excitation-contraction coupling in rat heart cells. Journal of Physiology. 1994;474:463–471. doi: 10.1113/jphysiol.1994.sp020037. [DOI] [PMC free article] [PubMed] [Google Scholar]