

Abstract
The spleen is an important site of atrial natriuretic factor (ANF)-induced fluid extravasation into the systemic lymphatic system. The mechanism underlying this process was studied in a blood-perfused (1 ml min−1) rat spleen using the double occlusion technique. To ensure that our observations were spleen specific, a similar protocol was repeated in the hindquarters.
Rat ANF(1-28), infused into the splenic artery of anaesthetized male rats, caused a dose-dependent (0.3-59 pmol min−1) increase in microvascular pressure from 11.3 ± 0.7 to 14.9 ± 0.5 mmHg and in post-capillary resistance from 7.2 ± 0.6 to 10.1 ± 1.1 mmHg ml−1. ANF elicited no change in splenic pre-capillary resistance or in hindquarter haemodynamics.
Intrasplenic ANF (6.5 pmol min−1) caused a sustained increase in intrasplenic fluid efflux from 0.1 ± 0.1 to 0.3 ± 0.1 ml min−1, and in capillary filtration coefficient (Kf) from 1.2 ± 0.5 to 2.4 ± 0.6 ml mmHg−1 min−1 (100 g tissue)−1.
Mechanical elevation of splenic intravascular pressure (from 11.3 ± 0.7 to 22.4 ± 0.2 mmHg) significantly increased intrasplenic fluid extravasation (from 0.4 ± 0.3 to 1.4 ± 0.3 ml min−1).
The natriuretic peptide receptor-C (NPRC)-specific agonist C-ANF(4-23) (12.5 and 125 pmol min−1) did not alter splenic intravascular pressure or pre-/post-capillary resistance.
The ANF antagonist A71915 (8.3 and 83 pmol min−1), which blocks ANF-stimulated cGMP production via natriuretic peptide receptor-A (NPRA), inhibited the ANF-induced changes in splenic microvascular pressure and post-capillary resistance.
It is concluded that ANF enhances the extravasation of isoncotic fluid from the splenic vasculature both by raising intrasplenic microvascular pressure (increased post-capillary resistance) and by increasing filtration area. The constrictive activity of ANF on the splenic vasculature is mediated through NPRA.
Atrial natriuretic factor (ANF(1-28); ANF) is important in fluid volume homeostasis. It is released in response to atrial distention, as would normally occur during hypervolaemia (Levin et al. 1998). Exogenously administered ANF causes an increase in haematocrit and a decrease in plasma volume, which cannot be accounted for by urinary losses (De Bold et al. 1981). We have shown that these responses are abolished by splenectomy (Kaufman, 1992) and that ANF causes a sustained increase in the haematocrit of blood as it passes through the spleen (Deng & Kaufman, 1996). Since the rat spleen is non-contractile and has virtually no blood storage capacity (Reilly, 1985), the additional red cell mass cannot originate from splenic reservoirs. The increase in haematocrit must therefore derive from a reduction in plasma volume. Indeed, further investigations have revealed that, under normovolaemic conditions, about 25 % of fluid volume flowing into the spleen is removed from the circulating blood and drains into the systemic lymphatic system (Chen & Kaufman, 1996).
These findings have led us to believe that the spleen is a major site of ANF-induced translocation of fluid out of the intravascular space. ANF could potentially cause this increase in fluid extravasation by altering capillary permeability within the spleen, as it has been shown to do this at high doses in a variety of tissues (Trippodo & Barbee, 1987). However, splenic capillary beds have been proven to have a discontinuous endothelium (Takubo et al. 1999), which makes it unlikely that fluid extravasation results from increased capillary permeability. Furthermore, we have shown that there is no change in plasma protein concentration of blood flowing through the spleen, and that lymph draining from the spleen is isoncotic to the plasma; this indicates that the capillary beds are indeed freely permeable to plasma proteins (Kaufman & Deng, 1993). Therefore, we have proposed that changes in splenic fluid extravasation in response to physiological levels of ANF occur, not through changes in capillary permeability, but via alterations in splenic haemodynamics to increase intrasplenic filtration pressure. Such a mechanism would be analogous to the role of ANF in the kidney, where it raises glomerular filtration pressure, thereby increasing glomerular filtration rate (Marin Grez et al. 1986).
The present study was designed to determine the mechanism by which ANF increases fluid efflux from the spleen. The experiments were done in a blood-perfused rat spleen, which enabled us to measure changes in arterial and venous blood flow, intrasplenic microvascular pressure, and pre-/post-capillary resistance in response to close-arterial infusion of ANF.
METHODS
The experiments described in this paper were examined by the local Animal Welfare Committee, and found to be in compliance with the guidelines issued by the Canada Council on Animal Welfare. At the completion of the studies, all animals were killed with an anaesthetic overdose (0.3 ml i.v., Euthanyl, MTC Pharmaceuticals, Cambridge, Ontario, Canada).
Animals and surgery
Male Long-Evans rats (450-650 g body weight) were obtained from Eastern Canada (Charles River, St Foy, Quebec, Canada). Animals were held in the University Animal Facility for at least 1 week prior to surgical or experimental procedures, exposed to a 12 h-12 h light-dark cycle, in a humidity and temperature controlled environment, and maintained on a 0.3 % sodium diet and water ad libitum.
Under isoflurane anaesthesia (2.5 %; IsoFlo, Abbott Laboratories, USA), the femoral vein was cannulated (Silastic, 0.51 mm i.d., 0.94 mm o.d.; Dow Corning, USA), after which sodium pentobarbital (Somnotol, 65 mg ml−1; MTC Pharmaceuticals) could be infused i.v. (50 mg kg−1). Inactin (ethyl-(1-methyl-propyl)-malonyl-thio urea; 80 mg kg−1, s.c.; BYK, Germany) was given at the end of surgery to maintain the rat under a moderate surgical plane of anaesthesia (no paw-pinch response) for the duration of the experiment. Saline was infused (3 ml h−1, i.v.) to maintain adequate hydration of the animal.
Blood-perfused spleen
In order to ensure that the splenic artery and vein supplied and drained only the spleen, all branches running from the splenic vessels to the pancreas, stomach and other surrounding tissues were ligated and divided (Fig. 1). We have previously confirmed, by injecting dye into the splenic artery, that this ensures vascular isolation of the spleen (Chen & Kaufman, 1996).
Figure 1. Anatomy of abdominal blood vessels associated with the spleen.
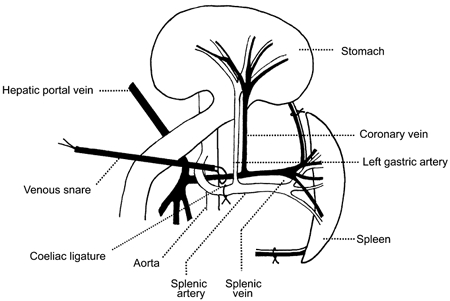
This diagram shows the surgical interventions and cannulation sites related to the preparation of the blood-perfused spleen. The stomach has been reflected out of the peritoneal cavity and placed on the thorax to allow access to the gastric vasculature.
Systemic blood pressure was monitored via a femoral artery cannula (PE-50, 0.58 mm i.d., 0.965 mm, o.d.; Intramedic). The right common carotid artery was occlusively cannulated using PE-90 (0.86 mm i.d., 1.27 mm o.d.) to provide the source of oxygenated blood, which was infused into the spleen via the gastric artery (drawn out PE-50 tubing, 0.58 mm i.d., 0.965 mm o.d.) using a peristaltic pump (1.0 ml min−1). The gastric vein was cannulated with Micro-Renethane tubing (0.30 mm i.d., 0.64 mm o.d.; Braintree Scientific Inc., Braintree, MA, USA); the cannula was advanced to the junction of the gastric vein and the splenic vein, and connected to a pressure transducer to monitor splenic venous outflow pressure. Systemic blood pressure and splenic arterial perfusion and venous outflow pressures were monitored continuously online (D1-400, WINDAQ, DATAQ Instruments, Akron, OH, USA).
Transit time flow probes (1RB, Transonic Systems, Ithaca, NY, USA) were placed around the splenic vein to measure splenic venous outflow. Knowing inflow (1.0 ml min−1), the rate of fluid extravasation could be calculated.
Blood-perfused hindquarters
In order to ensure that any results from our splenic perfusions were spleen specific, we repeated the experiment on the rat hindquarters, following a similar protocol to that used for the spleen. However, the following changes were made from the blood-perfused spleen protocol. The abdominal aorta was cannulated in two locations. The first cannula (PE-50; 0.58 mm i.d., 0.965 mm, o.d.) was inserted non-occlusively into the abdominal aorta to measure systemic blood pressure. A second line (PE-90; 0.86 mm i.d., 1.27 mm o.d.) was inserted just below the first cannula and caudally advanced until it was just above the bifurcation of the abdominal aorta; this served to deliver blood to the hindquarters (3.0 ml min−1). The inferior vena cava was cannulated with Silastic tubing (0.51 mm i.d., 0.94 mm o.d.).
Portal vein occlusion
Over a period of 2 min, a ligature was tightened around the portal vein until an upstream intraluminal pressure of 15 mmHg was achieved. Since the splenic vein drains into the portal vein, splenic venous outflow pressure was similarly raised. Splenic microvascular pressure was measured in the blood-perfused spleen. However, because of technical limitations, fluid extravasation was measured in physiologically intact animals, i.e. the spleen was perfused, not through a pump, but via the normal arterial supply. In this case, fluid efflux was estimated by placing flow probes around both the splenic artery and vein.
Microvascular pressure and resistance
In both the blood-perfused spleen and the blood-perfused hindquarter experiments, microvascular pressure (Pc) was determined using the double vascular occlusion technique (Townsley et al. 1986). After stabilization, inflow and outflow to the vascular bed was occluded for approximately 5 s (Hakim & Kelly, 1989). To this end, the peristaltic pump was stopped and the tubing clamped (inflow). Simultaneously a snare placed around the splenic vein (outflow) was tightened. Arterial pressure (Pa) and venous pressure (Pv) equilibrated rapidly to a value reflective of Pc (Fig. 2) (Barman, 1997). Results of previous studies have shown that microvascular pressures measured by double vascular occlusion are equivalent to those measured by other classical means, such as the micro-puncture technique (Hakim & Kelly, 1989).
Figure 2. Double vascular occlusion technique for determining microvascular pressure.
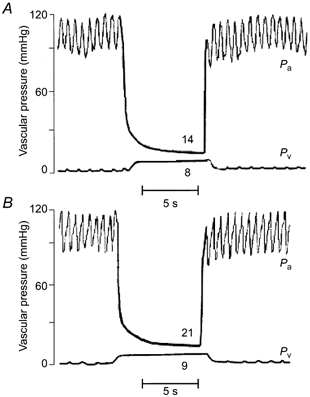
Pressure-time tracings are shown during the double occlusion, where arterial pressure (Pa) and venous pressure (Pv) are shown from the isolated, blood-perfused spleen in control (A) and ANF-infused (59 pmol min−1) animals (B).
The circulation of blood through the spleen and the rat hindquarters may be represented by a simple linear model where Pa is separated from Pc by a pre-capillary resistance (Ra), and Pc is separated from Pv by a post-capillary resistance (Rv) (Barman, 1997). The pre-capillary and post-capillary resistances may be calculated using the following equations:
where Q is equal to flow (ml min−1). Capillary filtration coefficient (Kf), was defined as:
This was normalized to tissue weight. Since we could not measure interstitial fluid pressure, we made the assumption that it was zero. Given that fluid flows freely down the splenic lymphatic duct, this value is probably very low. Net driving force was therefore taken to be Pc.
Experimental protocol
Separate groups of animals were used for the measurement of: (1) ANF-induced changes in splenic and hindquarter haemodynamics, (2) ANF-induced changes in splenic blood flow, (3) haemodynamic consequences of portal hypertension, and (4) characterization of the natriuretic peptide receptor responsible for the haemodynamic effects of ANF in the spleen.
Haemodynamic effects of ANF in the spleen and hindquarters
Once the perfusion of the spleen (1.0 ml min−1) or hindquarters (3.0 ml min−1) had started, heparin (0.15 ml; 10 000 i.u. ml−1) was injected i.v. Following a stabilization period of 30 min, ANF was infused continuously at a rate of 50 μl min−1 for the duration of the experiment. The ANF doses of 0, 0.3, 1.6, 6.5, 20 and 59 pmol min−1(n = 8, 3, 5, 5, 6 and 3, respectively) were infused into the spleen. The ANF doses of 0, 1.6, 6.5 and 20 pmol min−1(n = 4, 3, 3 and 3, respectively) were infused into the hindquarters. Double vascular occlusions were done after 5, 10 and 20 min; the microvascular pressure is reported as mean value of these three readings. Control animals, which had been implanted with the same cannulae and treated in the same manner as the experimental animals, were infused with saline and subjected to the same protocol.
Effect of ANF on splenic blood flow
The spleens were perfused as previously described. ANF (6.5 pmol min−1, n = 3) was infused for a period of 30 min. Splenic venous outflow was averaged over the last 5 min of ANF infusion. Fluid extravasation was estimated as the difference between splenic inflow (1 ml min−1) and outflow. The spleens were removed at the end of the experiment and weighed.
Effect of portal hypertension on splenic microvascular pressure and fluid efflux
After stabilization of the perfused spleen, portal venous pressure was raised to 15.0 mmHg by partial occlusion of the portal vein. Splenic microvascular pressure was then measured using the double occlusion technique as previously described.
The effect of increased portal venous pressure on splenic afferent and efferent blood flow was measured; due to technical difficulties, these experiments were not done in perfused spleens. Splenic venous and arterial blood flows were measured for 30 min after partially occluding the portal vein. Average flow over the last 5 min was calculated. The control animals were treated in the same manner, except that the ligature around the portal vein was not tightened.
Characterization of natriuretic peptide receptors
Separate groups of animals were used for each dose of each pharmacological agent. After 30 min stabilization, the drug was infused continuously for the duration of the experiment via the splenic artery. Intrasplenic microvascular pressure was measured by double vascular occlusion after 5, 10 and 20 min, as previously described. Control animals were infused with saline.
(a) Rat ANF(1-28) (Sigma-Aldrich Canada Ltd, Oakville, Ontario, Canada) was infused into the spleen at two doses (6.5 and 65 pmol min−1, n = 4).
(b) C-ANF (des[Gln18,Ser19,Gly20,Leu21,Gly22]-(ANF 4-23)-NH2; rat) (Bachem Californian Inc., Torrance, CA, USA), an NPRC-specific agonist (Maack et al. 1987), was infused in the same manner as ANF, at concentrations of 12.5 and 125 pmol min−1(n = 3).
(c) A71915 (Arg6,β-cyclohexyl-Ala8,d-Tic16,Arg17,Cys18)-ANF(6-18)-NH2) (Bachem Californian Inc.) is a specific antagonist which competitively binds to ANF receptors preventing the stimulation of guanylyl cyclase (Von Geldern et al. 1990; Delporte et al. 1992). It was infused into the spleen at two concentrations (8.3 and 83 pmol ml−1, n = 4). After testing for intrinsic activity (infused alone), A71915 was combined with ANF and infused into the spleen at the following doses:
ANF (6.5 pmol ml−1) plus A71915 (8.3 pmol ml−1; n = 4);
ANF (6.5 pmol ml−1) plus A71915 (83 pmol ml−1; n = 4);
ANF (65 pmol ml−1) plus A71915 (8.3 pmol ml−1; n = 4); and
ANF (65 pmol ml−1) plus A71915 (83 pmol ml−1; n = 4).
The infusions continued for the duration of the experiment. Microvascular pressure was measured by the double occlusion technique after 5, 10 and 20 min.
Statistical analysis
The significance of ANF-induced alterations of the microvascular pressure and the pre- and post-capillary resistances of the rat spleen and hindquarters was assessed by ANOVA followed by Student-Neuman-Keuls post hoc test for multiple comparisons. The level of statistical significance was set at P < 0.05.
The significance of ANF-induced alterations in capillary filtration coefficient, as well as blood flow in the perfused spleen and the portal hypertensive group, were assessed by Student's t test for paired data, since both control and experimental readings were taken in the same animals. The difference in spleen weight in response to ANF was analysed using Student's t test for unpaired data. Significance was set at P < 0.05, with data being expressed as mean values ±s.e.m.
RESULTS
There was a dose-dependent increase in splenic microvascular pressure in response to ANF (Fig. 3A and Fig. 4). There was no significant change in pre-capillary resistance (Ra) in the ANF-infused groups compared to the control animals (Fig. 3B). However, post-capillary resistance (Rv) of the experimental groups rose significantly in a dose-dependent manner (Fig. 3C).
Figure 3. Effect of ANF on microvascular pressure (A), pre-capillary resistance (B) and post-capillary resistance (C), in the spleen (•) and hindquarters (○).
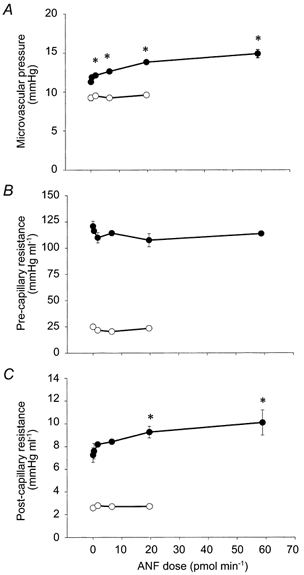
ANF was infused continuously intra-arterially into the respective vascular beds, and the responses were measured after 5, 10 and 20 min using the double occlusion technique. Isotonic saline was infused into the control animals (0 pmol min−1). Separate animals were used for each dose of ANF. For the splenic measurement, the sample sizes for each dose were n = 8, 3, 5, 5, 6 and 3, in order of increasing ANF dose. For the hindquarters measurements, the sample sizes for each dose were n = 4, 3, 3 and 3). The vertical error bars indicate s.e.m. *P < 0.05 relative to saline values (ANOVA plus Student-Neuman-Keuls post hoc test for multiple comparisons).
Figure 4. Effect of ANF and portal hypertension on splenic microvascular pressure.
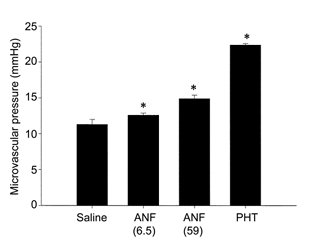
ANF was infused continuously via the splenic artery at doses of 6.5 pmol min−1(n = 5) and 59 pmol min−1(n = 3). The control animals were infused with isotonic saline (n = 8). Portal hypertension (PHT) was achieved by tightening a ligature around the portal vein until upstream intraluminal pressure reached 15 mmHg (n = 4). The responses were measured at 5, 10 and 20 min using the double occlusion technique. The vertical error bars indicate s.e.m. *P < 0.05 relative to saline values (ANOVA plus Student-Neuman-Keuls post hoc test for multiple comparisons).
The highest dose of ANF (59 pmol min−1) did not significantly alter mean arterial pressure. Basal pressure was 105 ± 4 mmHg. At the end of 20 min infusion of ANF, it was 105 ± 2 mmHg (n = 3).
In the hindquarters, even the highest dose of ANF (20 pmol min−1, n = 3) did not alter microvascular pressure compared to the saline-infused control animals (ANF: 9.2 ± 0.4 mmHg; saline: 9.6 ± 0.1 mmHg; n = 4; Fig. 3A). Nor were there any significant changes in Ra and Rv (Fig. 3B and Fig. 3C).
In the isolated, blood-perfused spleen, intrasplenic infusions of ANF (6.5 pmol min−1) for 30 min resulted in a significant drop in venous blood flow from control values of 0.9 ± 0.1 ml min−1 to 0.7 ± 0.1 ml min−1(n = 3, P < 0.05), in the absence of any change in splenic inflow (1 ml min−1). The arterio-venous difference increased from 0.1 ± 0.1 to 0.3 ± 0.1 ml min−1. Since splenic weight remained constant for the duration of ANF infusion (ANF: 0.99 ± 0.02 g, n = 3, vs. saline-infused controls: 0.99 ± 0.03 g, n = 3), one may calculate that there was a total fluid efflux of 9 ml from plasma over the 30 min period of ANF infusion.
In response to infusion of ANF (6.5 pmol min−1), intrasplenic microvascular pressure rose from 11.5 ± 0.7 mmHg (n = 8) to 12.6 ± 0.3 mmHg (n = 5). This was associated with an increase in fluid extravasation from 0.14 ± 0.06 (n = 3) to 0.30 ± 0.08 ml min−1(n = 3). On the assumption that tissue interstitial pressure was insignificantly low and that the driving force for fluid efflux was equal to microvascular pressure, one may calculate that ANF caused the capillary filtration coefficient (Kf) to rise from 1.2 ± 0.5 ml mmHg−1 min−1 (100 g tissue)−1 (saline-infused control, n = 3) to 2.4 ± 0.6 ml mmHg−1 min−1 (100 g tissue)−1(n = 3) (P < 0.05).
When portal venous pressure was increased to 15 mmHg (resting pressure was 3.1 ± 0.5 mmHg, n = 4), intrasplenic microvascular pressure increased from 11.2 ± 0.1 to 22.4 ± 0.2 mmHg (n = 4) (P < 0.05) in the isolated, blood-perfused spleen (Fig. 4).
In the physiologically intact spleen, splenic arterial blood flow did not change in response to partial occlusion of the portal vein (portal hypertension: 2.1 ± 0.3 ml min−1, n = 5, vs. control: 1.9 ± 0.4 ml min−1, n = 8). However, venous blood flow was markedly lower (portal hypertension: 0.7 ± 0.3 ml min−1, n = 5, vs. control: 1.6 ± 0.2 ml min−1, n = 8), resulting in a sustained increase in the arterio-venous difference in blood flow (portal hypertension: 1.7 ± 0.3 ml min−1, n = 5, vs. control: 0.4 ± 0.3 ml min−1, n = 8).
Intrasplenic infusion of the NPRC-specific agonist C-ANF (12.5 and 125 pmol min−1; n = 3 for each) did not significantly alter either microvascular pressure or post-capillary resistance (Fig. 5).
Figure 5. Effects of C-ANF on splenic microvascular pressure (A) and post-capillary resistance (B).
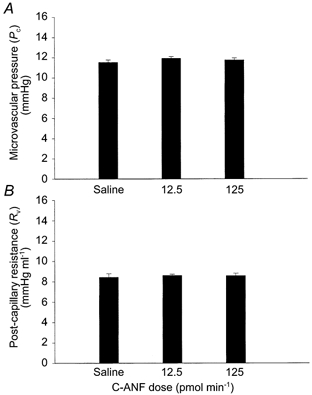
C-ANF, a NPRC-specific agonist, was infused continuously via the splenic artery at doses of 12.5 pmol min−1(n = 3) and 125 pmol min−1(n = 3). The control animals were infused with isotonic saline. Intrasplenic haemodynamics were measured after 5, 10 and 20 min using the double occlusion technique. The vertical error bars indicate s.e.m. There were no significant differences between the groups.
The ANF antagonist A71915 did not demonstrate any intrinsic activity; splenic Pc and Rv were unchanged for the duration of both low (8.3 pmol min−1; n = 4) and high dose (83 pmol min−1; n = 4) infusions. However, A71915 dose-dependently inhibited ANF-mediated alterations in splenic haemodynamics (Fig. 6). The high dose of A71915 (83 pmol min−1) completely inhibited the responses to both high (65 pmol min−1) and low doses (6.5 pmol min−1) of ANF. The low dose of A71915 (8.5 pmol min−1) completely blocked the low dose of ANF, and reduced the response to the high dose from 14.9 ± 0.5 mmHg to 12.8 ± 0.2 mmHg (saline control: 11.5 ± 0.2 mmHg).
Figure 6. Effects of the ANF antagonist A71915 on ANF-induced changes in splenic microvascular pressure (A) and post-capillary resistance (B).
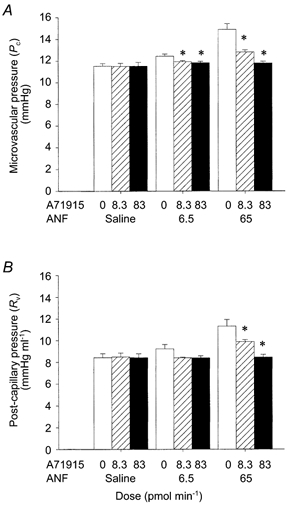
A71915 (8.3 pmol min−1, ; and 83 pmol min−1, ▪) was co-infused with ANF (6.5 and 65 pmol min−1) continuously via the splenic artery. The control animals were infused with isotonic saline (□). The haemodynamic responses were measured at 5, 10 and 20 min using the double occlusion technique. Separate animals were used for each dose (n = 4 for each group). The vertical error bars indicate s.e.m. *P < 0.05 (ANOVA plus Student-Neuman-Keuls post hoc test for multiple comparisons).
DISCUSSION
The results of this study are consistent with our proposal that ANF influences splenic fluid extravasation through changes in microvascular pressure; ANF dose-dependently increased splenic microvascular pressure (Pc) (Fig. 3A). This was achieved by increasing post-capillary resistance (Fig. 3C), rather than by decreasing pre-capillary resistance (Fig. 3B), i.e. ANF acts as a vasoconstrictor in the splenic vasculature. These effects were peculiar to the spleen, since there were no significant alterations in Pc, Ra or Rv in the perfused hindquarter under the same conditions. Fluid extravasation also increased when intrasplenic microvascular pressure was raised mechanically by increasing splenic venous outflow pressure (portal vein occlusion).
The validity of the double vascular occlusion technique in accurately determining microvascular pressure has been well documented in a variety of different vascular beds, such as the lung, skeletal muscle and the gastro-intestinal tract (Granger et al. 1983; Townsley et al. 1986). When compared with classical methods of determining Pc such as the micro-puncture technique, double vascular occlusion has consistently yielded accurate and extremely rapid estimates of microvascular pressure (Townsley et al. 1986). The occlusion pressures within the experimental groups of our study were consistently within 1 mmHg of each other, reflecting the precision of the technique. Since mean arterial blood pressure was stable for the duration of the perfusions and the spleen was denervated, it can be assumed that there were no changes in hormonal or neural input to the spleen from the rest of the body. Splenic blood flow was held constant throughout the experiment by the peristaltic perfusion pump. The haemodynamic changes (Pc, Ra and Rv) were thus due to ANF-induced alterations within the splenic vascular bed.
In order to demonstrate that the ANF-induced increase in microvascular pressure and post-capillary resistance was accompanied by fluid extravasation, venou-s outflow was measured before and after intrasplenic administration of ANF (6.5 pmol min−1). It is important to emphasize that that, unlike the dog, the rat spleen is not contractile and is unable to act as a blood or lymph storage organ (Reilly, 1985). Therefore, the effects of ANF on splenic haemodynamics are considered to be independent of blood sequestration into the spleen. Since blood flow into the spleen was held constant, the fall in venous outflow from 0.9 ± 0.1 ml min−1 to 0.7 ± 0.1 ml min−1 during the infusion of ANF confirms that the increase in microvascular pressure was indeed correlated with transfer of fluid out of the vasculature.
The total volume of fluid translocated from the blood was about 9 ml (0.3 ml min−1 over a 30 min period of ANF infusion). This is many times the total intrasplenic volume (splenic weight ∼ 1 g). Since splenic weight did not change during ANF infusion, the fluid extravasated from the spleen must have been transferred to another storage site. The fate of splenic extravasate has been confirmed in earlier studies, when Evan's Blue dye was found to pass freely from the splenic blood into lymphatic ducts draining from the spleen (Kaufman & Deng, 1993). Under normal circumstances, when intra-abdominal architecture has not been disrupted by surgery, this fluid would flow into the systemic lymphatic system
ANF increased the capillary filtration coefficient (Kf) in the spleen. This can potentially result from a change in hydraulic permeability and/or surface area. Given that the splenic vessels are freely permeable to plasma proteins (Kaufman & Deng, 1993), and that ANF does not alter splenic venous plasma protein (Deng & Kaufman, 1996), we suggest that ANF increases Kf by increasing the area of filtration. This can be readily be explained by a change in the route by which blood flows through the spleen. It is well established that blood can flow either through superficial shunts, or through a tortuous route into the splenic pulp (Takubo et al. 1999). In the pulp, there is ultrastructural evidence for filtration (Moghimi et al. 1993). We propose that ANF causes a preferential flow into the splenic pulp, i.e. that the filtration area is increased. This is in agreement with the proposed mechanism of action of ANF on the microvasculature described by Renkin & Tucker (1996) and by Huxley & Meyer (1990). However, whereas they suggest that the capillary beds are opened up by the vasodilatory actions of ANF, we propose that it is the vasoconstrictive actions of the peptide on the shunts, which forces blood into the alternate capillary beds.
The concept that ANF is able to alter splenic haemodynamics is consistent with the fact that ANF and ANF receptors, as well as their respective gene-transcripts, have been identified in the spleen of a variety of species (Kurihara et al. 1987; Vollmar et al. 1989; Throsby et al. 1991; Gerbes et al. 1994). In order to isolate the natriuretic peptide receptor (NPR) subtype responsible for mediating splenic vasoconstriction, we studied the effects of ANF, NPRC-specific ligand C-ANF, and the ANF antagonist A71915 in the same blood-perfused model. ANF binds with high specificity to both NPRA and NPRC at the doses used in this study (Barclay et al. 1992; Anand-Srivastava & Trachte, 1993). We demonstrated that NPRA is responsible for mediating the ANF-induced vasoconstriction of the splenic vasculature, while activation of NPRC does not appear to influence intrasplenic haemodynamics. Activation of NPRA stimulates the production of cGMP and is believed to be the primary mediator of the cardiovascular effects of ANF (Koller & Goeddel, 1992). In contrast to the well-documented ability of ANF to cause vasodilatation through the cGMP-dependent signalling cascade, the mechanism by which ANF mediates vasoconstriction remains unclear. However, despite the generally accepted view that ANF acts primarily as a vasodilator, the paradoxical vasoconstriction we observed is not without support in the literature; ANF has been shown to induce vasoconstriction in a variety of other vascular beds and species (Marin Grez et al. 1986; Shen et al. 1991; Woods & Jones, 1999).
The actions of ANF in the spleen are analogous to those seen in the kidney, where ANF causes dilatation of the glomerular afferent arteriole and constriction of the efferent arteriole (Marin Grez et al. 1986; Atlas et al. 1986); this increases glomerular filtration rate (Endlich, 1997). We have demonstrated that in the spleen, ANF likewise increases Pc and Rv, thereby elevating the hydrostatic pressure and increasing fluid efflux. However, unlike the renal glomerulus, the splenic circulation is freely permeable to plasma proteins (Kaufman & Deng, 1993; Deng & Kaufman, 1996), i.e. there is no colloid osmotic gradient across the capillary wall to oppose fluid efflux, and modest increases in splenic microvascular hydraulic pressure are able to induce a significant increase in fluid extravasation. Thus, microvascular hydraulic pressure, although higher than that observed in the hindquarter vasculature, is not elevated to the same extent as seen in the renal circulation (Vander, 1995).
Through this, and previous studies, we have shown that ANF can control the efflux of isoncotic fluid from the splenic blood into the systemic lymphatic system (Deng & Kaufman, 1996). ANF is also able to increase lymphatic capacity, and slows the return of lymphatic fluid to the vasculature by inhibiting smooth muscle contractility in lymphatic vessels (Valenzuela-Rendon & Manning, 1990; Ohhashi et al. 1990). Through these combined actions in the spleen and lymphatic system, ANF is able to achieve a sustained decrease in intravascular volume. The complementary actions of ANF in the spleen and the kidney reaffirm the established role of ANF in the control of fluid volume homeostasis within the body.
Acknowledgments
This work was supported by the Medical Research Council of Canada.
References
- Anand-Srivastava MB, Trachte GJ. Atrial natriuretic factor receptors and signal transduction mechanisms. Pharmacological Reviews. 1993;45:455–497. [PubMed] [Google Scholar]
- Atlas SA, Volpe M, Sosa RE, Laragh JH, Camargo MJF, Maack T. Effect of atrial natriuretic factor on blood pressure and the renin angiotensin aldosterone system. Federation Proceedings. 1986;45:2115–2121. [PubMed] [Google Scholar]
- Barclay PL, Bennett JA, Greengrass PM, Griffin A, Samuels GMR, Sheperson NB. The pharmacokinetics of I-125-atrial natriuretic factor in anaesthetized rats - effects of neutral endopeptidase inhibition with candoxatrilat and of ANF-C receptor blockade. Biochemical Pharmacology. 1992;44:1013–1022. doi: 10.1016/0006-2952(92)90362-m. [DOI] [PubMed] [Google Scholar]
- Barman SA. Role of calcium-activated potassium channels and cyclic nucleotides on pulmonary vasoreactivity to serotonin. American Journal of Physiology. 1997;273:142–147. doi: 10.1152/ajplung.1997.273.1.L142. [DOI] [PubMed] [Google Scholar]
- Chen A, Kaufman S. Splenic blood flow and fluid efflux from the intravascular space in the rat. Journal of Physiology. 1996;490:493–499. doi: 10.1113/jphysiol.1996.sp021160. [DOI] [PMC free article] [PubMed] [Google Scholar]
- De Bold AJ, Borenstein HB, Veress AT, Sonnenberg H. A rapid and potent natriuretic response to intravenous injection of atrial myocardial extract in rats. Life Sciences. 1981;28:89–94. doi: 10.1016/0024-3205(81)90370-2. [DOI] [PubMed] [Google Scholar]
- Delporte C, Winand J, Poloczek P, Vongeldern T, Christophe J. Discovery of a potent atrial natriuretic peptide antagonist for ANPA receptors in the human neuroblastoma NB-OK-1 cell line. European Journal of Pharmacology. 1992;224:183–188. doi: 10.1016/0014-2999(92)90803-c. [DOI] [PubMed] [Google Scholar]
- Deng Y, Kaufman S. Influence of atrial natriuretic factor on fluid efflux from the splenic circulation of the rat. Journal of Physiology. 1996;491:225–230. doi: 10.1113/jphysiol.1996.sp021210. [DOI] [PMC free article] [PubMed] [Google Scholar]
- Endlich K, Steinhausen M. Natriuretic peptide receptors mediate different responses in rat renal microvessels. Kidney International. 1997;52:202–207. doi: 10.1038/ki.1997.320. [DOI] [PubMed] [Google Scholar]
- Gerbes AL, Dagnino L, Nguyen T, Nemer M. Transcription of brain natriuretic peptide and atrial natriuretic peptide genes in human tissues. Journal of Clinical Endocrinology and Metabolism. 1994;78:1307–1311. doi: 10.1210/jcem.78.6.8200930. [DOI] [PubMed] [Google Scholar]
- Granger DN, Perry MA, Kvietys PR, Taylor AE. A new method for estimating intestinal capillary pressure. American Journal of Physiology. 1983;244:G341–344. doi: 10.1152/ajpgi.1983.244.3.G341. [DOI] [PubMed] [Google Scholar]
- Hakim TS, Kelly S. Occlusion pressures vs. micropipette pressures in the pulmonary circulation. Journal of Applied Physiology. 1989;67:1277–1285. doi: 10.1152/jappl.1989.67.3.1277. [DOI] [PubMed] [Google Scholar]
- Huxley VH, Meyer DJ. Capillary permeability - atrial peptide action is independent of protein effect. American Journal of Physiology. 1990;259:H1351–1356. doi: 10.1152/ajpheart.1990.259.5.H1351. [DOI] [PubMed] [Google Scholar]
- Kaufman S. Role of spleen in ANF-induced reduction in plasma volume. Canadian Journal of Physiology and Pharmacology. 1992;70:1104–1108. doi: 10.1139/y92-153. [DOI] [PubMed] [Google Scholar]
- Kaufman S, Deng Y. Splenic control of intravascular volume in the rat. Journal of Physiology. 1993;468:557–565. doi: 10.1113/jphysiol.1993.sp019788. [DOI] [PMC free article] [PubMed] [Google Scholar]
- Koller KJ, Goeddel DV. Molecular biology of the natriuretic peptides and their receptors. Circulation. 1992;86:1081–1088. doi: 10.1161/01.cir.86.4.1081. [DOI] [PubMed] [Google Scholar]
- Kurihara M, Katamine S, Saavedra JM. Atrial natriuretic peptide, ANP (99–126), receptors in rat thymocytes and spleen cells. Biochemical and Biophysical Research Communications. 1987;145:789–796. doi: 10.1016/0006-291x(87)91034-5. [DOI] [PubMed] [Google Scholar]
- Levin ER, Gardner DG, Samson WK. Natriuretic peptides. New England Journal of Medicine. 1998;339:321–328. doi: 10.1056/NEJM199807303390507. [DOI] [PubMed] [Google Scholar]
- Maack T, Suzuki M, Almeida FA, Nussenzveig D, Scarborough RM, Mcenroe GA, Lewicki JA. Physiological role of silent receptors of atrial natriuretic factor. Science. 1987;238:675–678. doi: 10.1126/science.2823385. [DOI] [PubMed] [Google Scholar]
- Marin grez M, Fleming JT, Steinhausen M. Atrial natriuretic peptide causes preglomerular vasodilatation and post glomerular vasoconstriction in rat kidney. Nature. 1986;324:473–476. doi: 10.1038/324473a0. [DOI] [PubMed] [Google Scholar]
- Moghimi SM, Hedeman H, Muir IS, Illum L, Davis SS. An investigation of the filtration capacity and the fate of large filtered sterically-stabilized microspheres in rat spleen. Biochimica et Biophysica Acta. 1993;1157:233–240. doi: 10.1016/0304-4165(93)90105-h. [DOI] [PubMed] [Google Scholar]
- Ohhashi T, Watanabe N, Kawai Y. Effects of atrial natriuretic peptide on isolated bovine mesenteric lymph vessels. American Journal of Physiology. 1990;259:H42–47. doi: 10.1152/ajpheart.1990.259.1.H42. [DOI] [PubMed] [Google Scholar]
- Reilly FD. Innervation and vascular pharmacodynamics of the mammalian spleen. Experientia. 1985;41:187–192. doi: 10.1007/BF02002612. [DOI] [PubMed] [Google Scholar]
- Renkin EM, Tucker VL. Atrial natriuretic peptide as a regulator of transvascular fluid balance. News in Physiological Sciences. 1996;11:138–143. [Google Scholar]
- Shen YT, Graham RM, Vatner SF. Effects of atrial natriuretic factor on blood flow distribution and vascular resistance in conscious dogs. American Journal of Physiology. 1991;260:H1893–1902. doi: 10.1152/ajpheart.1991.260.6.H1893. [DOI] [PubMed] [Google Scholar]
- Takubo K, Miyamoto H, Imamura M, Tobe T. Morphology of the human and dog spleen with special reference to intrasplenic microcirculation. Japanese Journal of Surgery. 1999;16:29–35. doi: 10.1007/BF02471066. [DOI] [PubMed] [Google Scholar]
- Throsby M, Lee D, Huang WQ, Yang Z, Copolov DL, Lim AT. Evidence for atrial natriuretic peptide-(5–28) production by macrophages of the rat spleen - an immunochemical and nonradioactive in situ hybridization approach. Endocrinology. 1991;129:991–1000. doi: 10.1210/endo-129-2-991. [DOI] [PubMed] [Google Scholar]
- Townsley MI, Korthuis RJ, Rippe B, Parker JC, Taylor AE. Validation of double vascular occlusion method for Pc, i in lung and skeletal muscle. Journal of Applied Physiology. 1986;61:127–132. doi: 10.1152/jappl.1986.61.1.127. [DOI] [PubMed] [Google Scholar]
- Trippodo NC, Barbee RW. Atrial natriuretic factor decreases whole body capillary absorption in rats. American Journal of Physiology. 1987;252:R915–920. doi: 10.1152/ajpregu.1987.252.5.R915. [DOI] [PubMed] [Google Scholar]
- Valenzuela-Rendon J, Manning RDJR. Chronic transvascular fluid flux and lymph flow during volume-loading hypertension. American Journal of Physiology. 1990;258:H1524–1533. doi: 10.1152/ajpheart.1990.258.5.H1524. [DOI] [PubMed] [Google Scholar]
- Vander AJ. Renal Physiology. NY, USA: McGraw Hill; 1995. [Google Scholar]
- Vollmar AM, Frriedrich A, Schulz R. Immunoreactive atrial natriuretic peptide in the guinea pig spleen. Life Sciences. 1989;45:1293–1297. doi: 10.1016/0024-3205(89)90132-x. [DOI] [PubMed] [Google Scholar]
- Von geldern TW, Budzik GP, Dillon TP, Holleman WH, Holst MA, Kiso Y, Novosad EI, Opgenorth TJ, Rockway TW, Thomas AM, Yeh S. Atrial natriuretic peptide antagonists - biological evaluation and structural correlations. Molecular Pharmacology. 1990;38:771–778. [PubMed] [Google Scholar]
- Woods RL, Jones MJM. Atrial, B-type, and C-type natriuretic peptides cause mesenteric vasoconstriction in conscious dogs. American Journal of Physiology. 1999;276:R1443–1452. doi: 10.1152/ajpregu.1999.276.5.R1443. [DOI] [PubMed] [Google Scholar]