

Abstract
Maximal voluntary contraction (MVC), series elastic stiffness and total joint stiffness during elbow flexion were investigated in healthy boys and in boys with Duchenne muscular dystrophy (DMD) in order to assess changes in mechanical properties induced by the disease.
Two methods were used to perform stiffness measurements: (i) the application of sinusoidal perturbations to the joint during flexion efforts, allowing the calculation of total joint stiffness; (ii) the use of quick-release movements of the elbow, which had previously been maintained in isometric contraction, allowing the calculation of series elastic stiffness. In each case, stiffness was linearly related to torque, leading to the calculation of a normalized stiffness index as the slope of this stiffness-torque relationship.
As expected, mean MVC was found to be much higher for healthy boys (20.02 ± 5.20 N m) than for DMD patients (3.09 ± 2.44 N m). Furthermore, the results showed that it was possible to characterize healthy and DMD children by virtue of the mechanical properties measured. Mean series elastic stiffness index was higher for DMD children (142.55 ± 136.58 rad−1) than for healthy subjects (4.39 ± 2.53 rad−1). The same holds for mean total joint stiffness index: 43.68 ± 67.58 rad−1 for DMD children and 2.26 ± 0.70 rad−1 for healthy subjects. In addition, increases in stiffness were more marked in DMD patients exhibiting high levels of muscle weakness.
These changes are interpreted in terms of the adaptation of the properties of the muscles and joint involved, i.e. muscle fibres, tendons, peri- and intra-articular structures.
Duchenne muscular dystrophy (DMD) is characterized by a direct effect on muscle fibres leading to muscle atrophy and weakness due to a lack of muscle dystrophin. Dystrophin is a sarcolemma cytoskeletal protein whose deficit leads to segmental necrosis of the muscle fibre. DMD is thus characterized by a decrease in the number of muscle fibres, which are progressively replaced by fibro-adipose tissue. The first observed clinical signs relate to difficulties in running or climbing stairs and calf hypertrophy. Gait then becomes lordotic and waddling. Between 6 and 11 years of age, limb and torso muscles progressively and steadily decrease in strength. Loss of ambulation occurs (average 10.5 years of age) and all torso and limb muscles decrease in size.
The assessment of muscle mechanical properties in DMD patients is mostly limited to a more or less sensitive evaluation of strength production, generally in static conditions and occasionally during a locomotor act. Two kinds of non-invasive technique are generally used to characterize muscle functional properties in DMD patients. (i) Semi-quantitative measurements (manual testing, timed scores during motor acts) are performed in routine clinical practice and afford a functional evaluation (Edwards & Hide, 1977; Brooke et al. 1981; Aitkens et al. 1989). For instance, manual testing (scored from 0 to 5) is based on an international graduated scale of muscle ability: MRC scale (Medical Research Council, 1943) reorganized from 0 to 10 (Brooke et al. 1981). (ii) Quantitative measurements (manual dynamometry) can be performed in some muscle groups and give a maximal voluntary contraction (MVC) measurement (Munsat, 1989).
Understanding of the mechanisms responsible for muscle adaptation to altered functional demand (pathology or training) requires quantification of muscle mechanical properties. For instance, muscle contractility and muscle elasticity were experimentally found to be sensitive to periods of hyperactivity as well as hypoactivity (Goubel & Marini, 1987; Almeida Silveira et al. 1994; Canon & Goubel, 1995). The same holds for viscoelastic properties of joints (Heerkens et al. 1986; Tipton et al. 1986). It can therefore be hypothesized that muscle elastic properties and joint characteristics are modified by alterations induced by DMD. This was shown regarding the muscle stiffness of knee extensors (Cornu et al. 1998). A classical method of obtaining quantitative information on isolated muscle series elastic component (SEC) behaviour is the quick-release movement first used by Hill, who specified the concept of SEC from his muscle model (Hill, 1938). The same technique can be applied in human muscle groups with some protocol modifications (Goubel & Pertuzon, 1973; Pousson et al. 1990; Hof, 1997; Tognella et al. 1997; Cornu et al. 1998). Another widely used approach to measure viscoelastic properties is to apply sinusoidal disturbances over a range of frequencies. Considering displacement and force parameters, frequency-dependent changes in compliance and phase shifting reflect the classical features of mixed mechanical contributions from inertia, viscosity and elasticity of the considered structures (Cannon & Zahalak, 1982; Winters et al. 1988; Kearney & Hunter, 1990). The existence of viscoelastic behaviour during sinusoidal perturbations was first quantified in the soleus muscle of the cat by Rack (1966). In humans, an identical goal was pursued: to develop a tool to characterize musculo-articular behaviour in order to determine the role played by muscles, tendons and joints in movement. For this purpose, Joyce et al. (1974) applied sinusoidal perturbations to the elbow joint and Agarwal & Gottlieb (1977) and Kearney & Hunter (1990) to the ankle joint.
The present study was designed to determine and compare SEC stiffness and total joint stiffness changes in DMD children during elbow flexion. This was done using the quick-release technique and the sinusoidal perturbation method, respectively, to give stiffness indices, which were examined for changes related to the stage of the disease.
METHODS
Materials
Experiments were performed with an ergometer especially designed to test the mechanical properties of the muscle groups and joint during elbow flexion and extension on both sides in children (Fig. 1). Briefly, this ergometer consists of a platform supporting a power unit and a seat associated with a driving unit. The seat, including restraining systems, is adaptable to child morphology, and is three-dimensionally adjustable to optimize the subject's position. A fixed column supports: (i) a direct drive actuator (NSK Megatorque) with a rotation axis held in the vertical position; (ii) a forearm support directly fixed onto the rotor, allowing the subject's forearm to be maintained in the horizontal plane such that the elbow rotation axis coincides with that of the actuator; (iii) specific transducers: angular position is measured by an ‘absolute coding’-type transducer giving the instantaneous absolute position of the rotor. The resolution of the displacement measurement is one-tenth of a degree. Angular velocity is recorded from the resolver of the actuator except for velocities greater than 3 laps s−1, which require a tachometer (Minimotor). Torque is obtained by a torque transducer whose axis coincides with the motor axis. Its sensitivity in measuring strength non-perpendicular to the main shaft is virtually nil. In the quick-release test, inertia of the moving part must be as low as possible in order to obtain release in a few milliseconds (Goubel & Pertuzon, 1973; Tognella et al. 1997). This was achieved by using an electromagnetic clutch allowing quick coupling/uncoupling of the actuator and of the forearm support.
Figure 1.
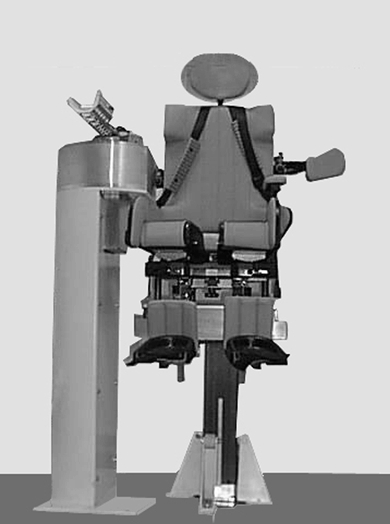
Elbow ergometer
The driving unit was composed of a PC equipped with a specific 12-bit A/D converter and a timer board allowing ergometer piloting and data acquisition after signal conditioning. The computer controlled the position of the actuator according to a specific software menu. The software controlled all procedures, from the choice of test to real-time commands, signal acquisition and storage. Motor control was mediated by transistor-transistor logic lines plus one RS 232 link, connected to the driver unit of the actuator. Mechanical variables were also stored in the computer. Signals were processed by specific software allowing expression of the results in terms of characteristic parameters.
Experimental protocol
The main experiment was designed as follows. A full test session, including rest periods, lasted about 1 h and comprised: (i) an explanation of the tests, (ii) preparation of the subject, (iii) habituation to the tests, (iv) the actual tests.
For the tests, the subject was placed on the seat and maintained by special restraint systems in order to keep his body and head against the seat back and headrest, respectively. The subject's legs were supported by an adjustable foothold so that the knee joint angle was near 90 deg in order to prevent potential circulatory compression. The seat was adjusted by means of a moving system near the fixed column so that the subject's forearm rested on the forearm support. The motor rotation axis was aligned with the epitrochlea-epicondyle axis of the humerus, which gives the elbow a remarkably constant radius of rotation (Wilkie, 1950). The hand was placed in the prone position by taking a horizontal grip, the distance of which from the motor rotation axis could be adjusted. A crucial point was to prevent, during either quick-release or sinusoidal perturbation tests, movement of the wrist in the horizontal plane when moving the elbow joint; wrist movement would lead to changes in inertia and then in stiffness. This was achieved by virtue of the raised edge of the forearm support, which kept the hand immobilized, and with restraint systems holding the forearm to its support. The general posture of the subject during the experiment was with the arm and forearm in the horizontal plane, with an angle of 45 deg between the frontal plane and the arm, and the elbow joint angle set at 90 deg.
MVC was first measured for the elbow flexors under isometric conditions. Three tests were performed and the best was retained as the real elbow flexor MVC. Quick-release movements (QR) during elbow flexion were then performed at three submaximal isometric torques (35, 50 and 75 % MVC), with three measurements per torque. Lastly, sinusoidal perturbations (SP) were imposed on the right elbow (4-12 Hz, 3 deg peak-to-peak harmonic angular displacement), during which the subject developed a mean constant torque equal to 35, 50 or 75 % MVC. Each trial lasted 4 s. The trials were separated by a rest period to prevent muscle fatigue. Instructions to the subjects were displayed on a PC screen and an oscilloscope for QR and SP, respectively.
In order to improve the comparison between normal and DMD subjects, an additional experiment was designed in which normal subjects had to develop torques in a similar range to DMD subjects. The same tests (i.e. QR and SP) were performed at three submaximal isometric torques (1, 4 and 7 N m).
Subjects
Twenty-two DMD boys (mean age, 13.55 ± 3.03 years; range, 9-21 years) and fifteen healthy boys (mean age, 11.02 ± 1.66 years; range, 9-15 years) volunteered for the main experiment, whilst nine boys (mean age, 11.44 ± 1.99 years; range, 8-15 years) volunteered for the additional experiment. Some physical characteristics of the subjects are shown in Table 1. All children and their legal guardians were informed of the nature and the aim of this study and signed a consent form. The study was authorized by the Ethics Committee of the Hôpital de la Pitié-Salpêtrière (Paris, France) and was carried out in accordance with the Declaration of Helsinki.
Table 1.
Physical characteristics of the experimental subjects
| Subject | 1 | 2 | 3 | 4 | 5 | 6 | 7 | 8 | 9 | 10 | 11 | 12 | 13 | 14 | 15 | 16 | 17 | 18 | 19 | 20 | 21 | 22 | 23 | 24 |
|---|---|---|---|---|---|---|---|---|---|---|---|---|---|---|---|---|---|---|---|---|---|---|---|---|
| DMD | ||||||||||||||||||||||||
| H (m) | 1.40 | 1.25 | 1.51 | 1.32 | 1.65 | 1.57 | 1.55 | 1.40 | 1.34 | 1.54 | 1.57 | 1.52 | 1.50 | 1.25 | 1.36 | 1.34 | 1.65 | 1.60 | 1.25 | 1.38 | 1.51 | 1.62 | — | — |
| W (kg) | 43.0 | 23.0 | 52.0 | 36.0 | 70.0 | 34.5 | 30.0 | 45.0 | 26.5 | 31.0 | 33.5 | 50.0 | 55.0 | 24.5 | 36.0 | 37.0 | 77.5 | 56.0 | 24.5 | 31.5 | 51.0 | 50.0 | — | — |
| I | 0.058 | 0.031 | 0.049 | 0.053 | 0.097 | 0.047 | 0.045 | 0.033 | 0.030 | 0.052 | 0.026 | 0.032 | 0.061 | 0.033 | 0.027 | 0.019 | 0.067 | 0.066 | 0.026 | 0.029 | 0.026 | 0.046 | — | — |
| Healthy | ||||||||||||||||||||||||
| H (m) | 1.27 | 1.45 | 1.40 | 1.38 | 1.29 | 1.40 | 1.48 | 1.31 | 1.50 | 1.38 | 1.58 | 1.45 | 1.47 | 1.55 | 1.68 | 1.62 | 1.65 | 1.25 | 1.70 | 1.50 | 1.45 | 1.20 | 1.45 | 1.22 |
| W (kg) | 29.0 | 51.0 | 40.0 | 39.0 | 31.0 | 38.0 | 39.0 | 28.0 | 53.0 | 37.5 | 56.0 | 40.0 | 39.0 | 39.5 | 55.0 | 50.0 | 50.0 | 25.0 | 50.0 | 42.0 | 34.0 | 29.0 | 30.0 | 26.5 |
| I | 0.032 | 0.035 | 0.047 | 0.043 | 0.027 | 0.038 | 0.041 | 0.026 | 0.023 | 0.029 | 0.023 | 0.037 | 0.042 | 0.030 | 0.056 | 0.037 | 0.035 | 0.016 | 0.029 | 0.022 | 0.021 | 0.018 | 0.019 | 0.015 |
Elbow inertia (I; Nms2 rad−1) is the mean value of that estimated from QR and SP experiments.Abbreviations: H, height; W, weight.
Data processing
Quick-release movement: stiffness index calculation (SIQR)
For each QR trial, the parameters collected (see Fig. 2) were (i) isometric torque before the release (T), and (ii) changes in angular position (Δθ) and changes in angular acceleration (Δθ‘’) calculated from the derivation with respect to time of the angular speed signal. These two parameters were characterized at the very beginning of the quick release of the system (30 ms after the acceleration peak). Series elastic stiffness (SQR) is conventionally calculated at the start of motion (Goubel & Pertuzon, 1973; Tognella et al. 1997), i.e. when the series elastic component (SEC) is supposed to recoil. Thus the stiffness index (SIQR) is expressed as the ratio between changes in angular acceleration (Δθ‘’) and angular displacement (Δθ), multiplied by the corresponding inertia value (I):
| (1) |
In this equation, inertia is assumed to be constant. This can be easily calculated by considering the transition between the static phase and the dynamic phase of the test. At this moment, static torque (T) equals dynamic torque and acceleration is maximal (θ‘’max). Then:  and
and
| (2) |
SQR was related to the corresponding isometric torque (T) exerted by the subject. The slope of the linear stiffness-torque relationship so obtained gave the series elastic stiffness index (SIQR), which was used to normalize stiffness data. In addition, I was related to T in order to assess its constancy.
Figure 2. Typical raw data for quick-released movement.
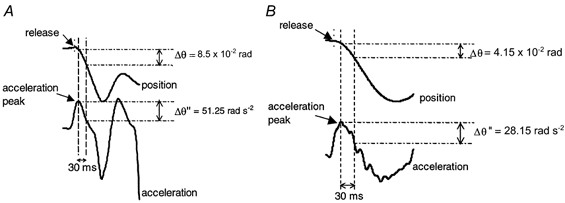
A, healthy subject; B, DMD patient. Changes in acceleration (Δθ‘’) and position (Δθ) were calculated during the first 30 ms after release.
Sinusoidal perturbations: stiffness index calculation (SISP)
During a SP trial the recorded variables were angular displacement and torque (Fig. 3). The mechanical analysis only considered torque modulated at the driving frequency, and non-linearities were therefore neglected (Kearney & Hunter, 1990). For each maintained torque, averaged position-to-torque amplitude ratios (compliance curve) and position-to-torque difference in phase (phase curve) were plotted against the imposed frequencies on a Bode diagram after compensation for actuator dynamics. As in other studies (see for review Kearney & Hunter, 1990), frequency-dependent changes in compliance and phase shifting reflected the classical features of a mixed mechanical contribution from inertia (I), viscosity (B) and elasticity (K) of the musculo-articular system. Such a feature can be observed providing that a frequency range of 4-12 Hz is imposed. So, by using identification techniques (Levy, 1959), a second-order model including such parameters was adjusted to the Bode diagrams as expressed by the formula:
| (3) |
where T is the external torque (N m) and θ is the angular position (rad).
Figure 3. Typical raw data for sinusoidal perturbation test.
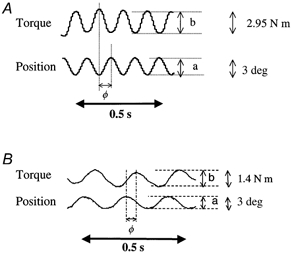
A, healthy subject; B, DMD patient. Position-to-torque amplitude ratio (a/b) and position-to-torque difference in phase (φ) were calculated for each imposed frequency.
So, for each level of torque, the stiffness, K (N m rad−1), the viscosity, B (N m s rad−1), and the inertia, I (N m s2 rad−1), can be determined.
The K values were related to the maintained torque by using data obtained at 35, 50 and 75 % of MVC. The slope of the linear stiffness relationship so obtained gave the total joint stiffness index (SISP), which was used to normalize the stiffness data. In addition, I was related to T in order to assess its constancy.
Manual testing
Manual testing data were collected during medical consultation by specialized physiotherapists using an international standardized scale (Medical Research Council, 1943). This semi-quantitative method estimates disease severity using a scale between 5 for healthy subjects and 0 when no movement is possible. Muscle grades were then reorganized in order to build a numerical scale between 10 (healthy subjects) and 0 (no movement) according to the method proposed by Brooke et al. (1981).
Statistics
A correlation coefficient, r2, was calculated for each plotted fit, and also when plotting Bode diagrams in order to determine, for each frequency, the scattering with regard to the theoretical behaviour governed by eqn (3). A Cochran t test was used for comparison of the global values presented with standard deviation (s.d.). An analysis of variance (ANOVA) was performed for comparison of the mean values. The level of significance was set at P < 0.05.
RESULTS
Maximal voluntary contraction (MVC)
MVC was always much lower for DMD patients than for healthy subjects. Mean MVC was significantly higher for healthy boys (20.02 ± 5.20 N m) than for DMD patients (3.09 ± 2.44 N m). When associating healthy and DMD subjects, an exponential relationship was found between mean MVC and the corresponding manual testing score (r2= 0.92, P < 0.05).
Series elastic stiffness: SQR and SIQR
Inertia determined during QR experiments was found to be independent of torque (Fig. 4). For the healthy subjects, the mean slope of the I-T relationship was 0.0021 ± 0.0018 s2 rad−1, i.e. nearly horizontal. The same holds for DMD patients, for whom the mean slope was 0.027 ± 0.034 s2 rad−1. This allowed us to estimate the inertia of each subject by subtracting the contribution of the apparatus, leading to mean values of 0.037 ± 0.013 and 0.038 ± 0.021 N m s2 rad−1 for healthy and DMD subjects, respectively.
Figure 4. Typical series elastic stiffness-torque and inertia-torque relationships.
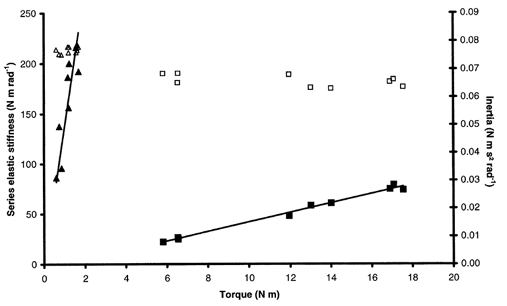
Stiffness (▴) and inertia (▴) for a DMD patient. Stiffness (▪) and inertia (□) for a healthy subject.
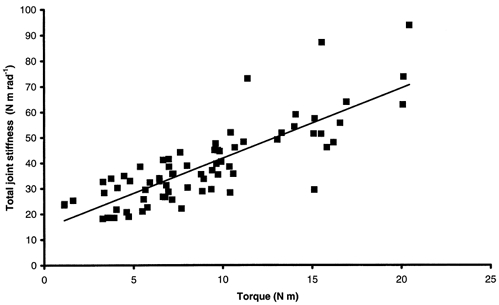
SQR increased linearly with torque irrespective of the subject (Fig. 4). This relationship was also linear for data pooled for healthy subjects from the main experiment and gave a global SIQR of 5.14 ± 0.29 rad−1 (r2= 0.74, P < 0.05). The global relationship between SQR and torque for DMD patients showed a clear dissociation into two populations (Fig. 5). One population with lower stiffness and exercising higher torque corresponded to DMD patients with test scores ≥ 5. The global stiffness-torque relationship for this population was linear and gave a global SIQR of 3.41 ± 0.57 rad−1 (r2= 0.46, P < 0.05). A second population with higher stiffness and exercising lower torque corresponded to DMD patients with test scores < 5. For this population, the stiffness-torque relationship was also linear and gave a global SIQR of 138.36 ± 10.67 rad−1 (r2= 0.70, P < 0.05). Moreover, stiffness calculated for healthy subjects from the additional experiment, i.e. developing low torques, was in a lower range than stiffness calculated for healthy subjects from the main experiment. Pooling the data for all healthy subjects (main and additional experiments) led to a linear stiffness-torque relationship that gave a global SIQR of 3.85 ± 0.22 rad−1 (r2= 0.61, P < 0.05; Fig. 6). In spite of inter-individual variations, mean SIQR was significantly lower for healthy subjects (4.39 ± 2.53 rad−1) than for DMD patients (142.55 ± 136.58 rad−1; P < 0.05). More precisely, mean SIQR was significantly lower for healthy subjects in both experiments (5.44 ± 2.40 rad−1 in the main experiment; 2.48 ± 1.34 rad−1 in the additional experiment) and for DMD subjects with test scores ≥ 5 (5.31 ± 2.87 rad−1) than for DMD subjects with test scores < 5 (220.97 ± 109.20 rad−1; P < 0.05). Moreover, no significant difference in mean SIQR was found between healthy subjects of both experiments and DMD subjects with test scores ≥ 5 (P > 0.05). A mean SIQR value was calculated for each available grade of manual testing, and indicated a large increase in SIQR with the severity of the disease when the test score of the elbow flexors dropped below 5 (Table 2).
Figure 5. Global series elastic stiffness-torque relationship for DMD patients.
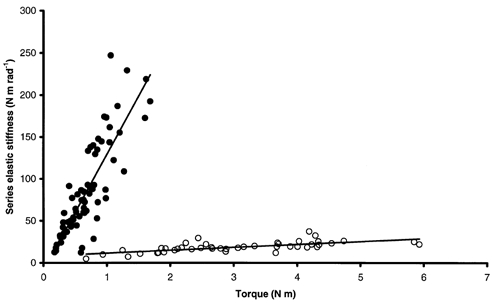
A clear dissociation of the population is observed. •, linear relationship for DMD patients with test scores < 5 (r2= 0.70, SIQR= 138.36 rad−1). ○, linear relationship for DMD patients with test scores ≥ 5 (r2= 0.46, SIQR= 3.41 rad−1).
Figure 6. Global series elastic stiffness-torque relationship for healthy subjects.
r2= 0.61, global SIQR= 3.85 rad−1.
Table 2.
Changes in mean series elastic stiffness index (SIQR) and in mean total joint stiffness index (SISP) with test score
| Test score | 10 | 7 | 5 | 4 | 3 | 2 |
| n | 24 | 3 | 5 | 2 | 7 | 5 |
| Mean SIQR (rad−1) | 4.39 ± 2.53 | 3.75 ± 1.03 | 6.25 ± 1.53 | 186.69 ± 52.98 | 197.77 ± 51.86 | 267.15 ± 62.44 |
| Mean SISP (rad−1) | 2.26 ± 0.70 | 6.67 ± 0.95 | 3.94 ± 0.90 | 29.90 ± 2.79 | 28.41 ± 6.18 | 132.54 ± 50.90 |
A score of 10 corresponds to healthy subjects and a score of 0 is given when no movement is possible.n, number of subjects with the corresponding test score.
Total joint stiffness: SSP and SISP
Inertia determined during SP experiments was found to be independent of torque (Fig. 7). For the healthy population, the mean slope of the I-T relationship was 0.0004 ± 0.0003 s2 rad−1, i.e. nearly horizontal. The same holds for DMD patients, for whom the mean slope was 0.047 ± 0.059 s2 rad−1. This allowed us to estimate the inertia of each subject by subtracting the contribution of the apparatus. These inertias were not significantly different from those deduced from QR experiments.
Figure 7. Typical total joint stiffness-torque and inertia-torque relationships.
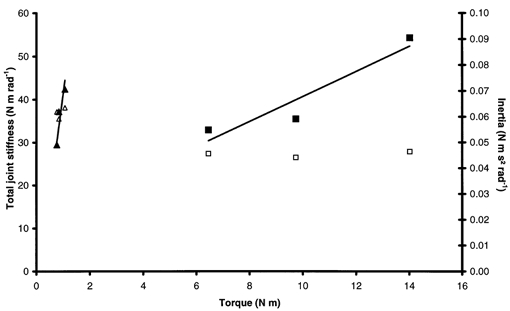
Stiffness (▴) and inertia (▵) for a DMD patient. Stiffness (▪) and inertia (□) for a healthy subject.
In Bode diagrams, the compliance curve in healthy subjects from the main experiment showed a peak for the resonant frequency followed by a linear decrease with a slope of -40 dB decade−1 and the phase diagram showed a -90 deg phase lag for the resonant frequency (Fig. 8a). In DMD subjects, the resonant frequency was shifted towards lower values, resulting in truncated diagrams (Fig. 8B and Fig. 9). The same holds for healthy subjects developing low torques (Fig. 9). Moreover, Fig. 9 shows that fitting a second-order model equation to the experimental data revealed a resonant frequency for subjects developing low torques that was not observable within the frequency range used for the experiments. Finally, for every subject, the second-order model gave a satisfactory fit: the correlation coefficient, r2, was between 0.71 and 0.99 for DMD patients and between 0.77 and 0.98 for healthy subjects from both experiments.
Figure 8. Bode diagrams.
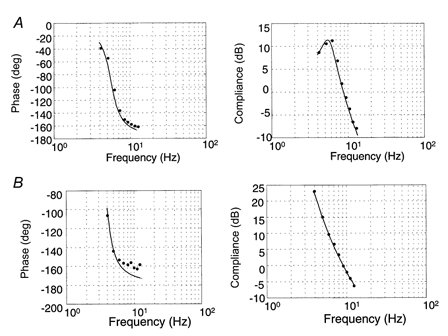
A, typical compliance and phase diagrams for healthy subjects. The compliance curve shows a peak in the resonant frequency followed by a linear decrease with a slope of -40 dB decade−1 (r2= 0.95). B, typical compliance and phase diagrams for DMD patients. Resonant frequency shifted towards lower frequencies, leading to truncated diagrams (r2= 0.90).
Figure 9. Simulated Bode diagrams from the second-order model obtained by virtue of experimental data for a DMD patient and a healthy subject working at low torque.
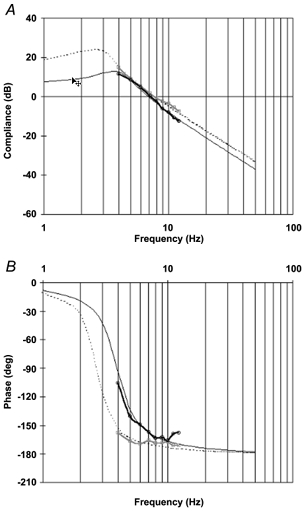
A, compliance diagram; B, phase diagram. □, experimental data for a DMD patient exerting a mean torque of 0.95 N m (r2= 0.99). ○, experimental data for a healthy subject exerting a mean torque of 1.14 N m (r2= 0.97). Simulated data in the 1-50 Hz frequency range are shown for a DMD patient (dotted line) and a healthy subject (continuous line).
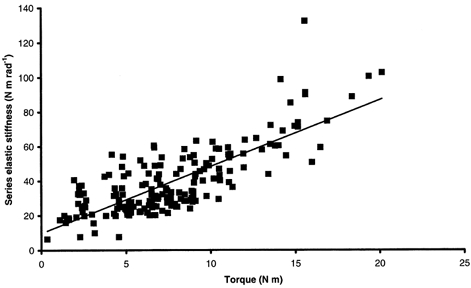
SSP increased linearly with torque irrespective of the subject (Fig. 7). This relationship was also linear for data pooled for all healthy subjects from the main experiment, giving a global SISP of 2.89 ± 0.33 rad−1 (r2= 0.63, P < 0.05). The global relationship between SSP and torque for DMD patients showed a dissociation into two populations (Fig. 10). In fact, a linear relationship for DMD patients with test scores ≥ 5 gave a global SISP of 3.75 ± 1.15 rad−1 (r2= 0.32, P < 0.05). No obvious relationship was observed between stiffness and torque for DMD patients with test scores < 5 (r2= 0.028, P < 0.05). Stiffness calculated for healthy subjects from the additional experiment, i.e. developing low torques, was in a lower range than stiffness calculated for healthy subjects from the main experiment. Pooling data for all healthy subjects (main and additional experiments) led to a linear stiffness-torque relationship that gave a global SISP of 2.74 ± 0.23 rad−1 (r2= 0.67, P < 0.05; Fig. 11). In spite of inter-individual variations, no significant difference in mean SISP was found between healthy subjects from the two experiments (2.50 ± 0.45 rad−1 in the main experiment; 2.16 ± 0.79 rad−1 in the additional experiment). Furthermore, mean SISP was significantly lower for healthy subjects from both experiments (2.26 ± 0.70 rad−1) than for DMD subjects (43.68 ± 67.58 rad−1; P < 0.05). More precisely, significant differences in mean SISP were found for three groups (P < 0.05): healthy subjects, DMD subjects with test scores ≥ 5 (4.96 ± 2.21 rad−1) and DMD subjects with test scores < 5 (65.81 ± 76.98 rad−1). A mean SISP was calculated for each available grade of manual testing. This indicated a large increase in SISP with the severity of disease when the test score of the elbow flexors dropped below 5 (Table 2).
Figure 10. Global total joint stiffness-torque relationship for DMD patients.
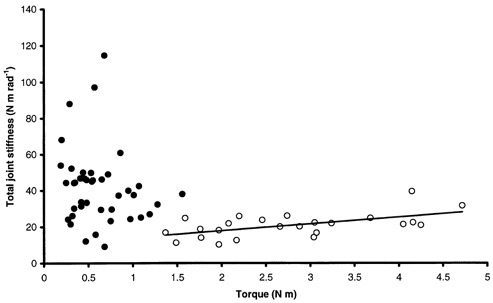
No obvious global relationship is observed whereas a linear relationship can be observed for DMD patients with test scores ≥ 5 (○; r2= 0.32, SISP= 3.78 rad−1). •, DMD patients with test scores < 5.
Figure 11. Global total joint stiffness-torque relationship for healthy subjects.
r2= 0.67, global SISP= 2.74 rad−1.
Series elastic stiffness index and total joint stiffness index comparison
Mean SISP (2.26 ± 0.70 rad−1) was significantly lower than mean SIQR (4.39 ± 2.53 rad−1) in healthy subjects (P < 0.05). The same holds for DMD patients, whose mean SISP was 43.68 ± 67.58 rad−1 and mean SIQR was 142.55 ± 136.58 rad−1 (P < 0.05).
DISCUSSION
The present experiment was designed to quantify both muscle and joint mechanical properties in healthy and DMD boys during elbow flexion. As expected, mean MVC was considerably higher for healthy subjects than for DMD patients. Moreover, considering mean MVC and the corresponding test score for the elbow flexors for all subjects, a clear exponential relationship was noted, confirming the loss of strength with the severity of disease (see for review Engel et al. 1994). Furthermore, for the first time to our knowledge, elastic characteristics were calculated during elbow flexion in DMD patients by means of two methods, allowing the determination of two kinds of stiffness index, SIQR and SISP.
Series elastic stiffness: SQR and SIQR
The results demonstrate that the quick-release technique can be used to follow disease progression. In an isolated muscle, the initial phase of the quick-release movement corresponds to a SEC recoil (Wilkie, 1956). The SEC consists of an active fraction that is located in the cross-bridges (Huxley & Simmons, 1971) and a passive fraction that is located in the tendon (Jewell & Wilkie, 1958). The use of the quick-release technique in humans differs in some regards from its use in isolated muscle (Goubel & Pertuzon, 1973). In fact, the stiffness measurement is performed during the SEC recoil, which is very brief in isolated muscle (1-5 ms) but longer in the case of in situ human experiments (40-50 ms): this is due to inertia opposed to the movement (limb and experimental device), which does not permit an instantaneous shortening of elastic elements. However, it was necessary to perform measurements before the appearance of an unloading reflex (Angel et al. 1965), which is known to occur about 30 ms after the release. For the low levels of torque when the SEC stiffness is low, the passive resistance of the antagonistic muscles and passive structures can interfere with the SEC recoil. Agonistic compliance can then be minimized, i.e. SEC stiffness increased (Shorten, 1987). However, the quick-release estimate of human SEC stiffness is in fair agreement with those obtained with alternative methods such as small amplitude oscillation experiments (Cannon & Zahalak, 1982) and the free vibration technique (Shorten, 1987). Furthermore, the characteristics of SEC stiffness of human muscle were also found to change according to the functional demand (Pousson et al. 1990; Goubel, 1997; Lambertz et al. 2001). This coherence in the reported data suggests that the quick-release method can be satisfactorily applied to in vivo human experiments.
The increasing linear relationship between SQR and torque irrespective of the subject shows that SEC stiffness depends on activated contractile elements (Goubel & Pertuzon, 1973). The same kind of relationship can be deduced from the compliance-force relationship of the elbow equivalent flexor (Goubel & Pertuzon, 1973; Pousson et al. 1990) or compliance-torque of triceps surae (Tognella et al. 1997). This yields a stiffness index (SIQR), which characterizes the musculo-tendinous behaviour of a subject in terms of normalized stiffness. Interestingly, the global SQR-torque relationship for DMD patients clearly dissociated the whole population into two groups according to test scores of ≥ 5 and < 5. This shows the sensitivity of the quick-release method. On the other hand, no dissociation into two groups was found for the global SQR-torque relationship for healthy subjects when including additional results obtained for low torques. This reinforces the differences in SIQR observed between DMD and healthy subjects.
Total joint stiffness: SSP and SISP
Mechanical responses were studied after elimination of changes in torque signal due to the reflex response resulting from sinusoidal perturbations. Thus, neurophysiological aspects of the musculo-articular structure's behaviour were not taken into account. Bode diagrams obtained in this study for healthy children are in accordance with those reported in the literature (Agarwal & Gottlieb, 1977; Kearney & Hunter, 1990). Moreover, the low torques exercised by DMD patients and healthy subjects in the additional experiment shifted the resonant frequency in Bode diagrams towards low frequencies. A second-order model fitted the data satisfactorily, despite the lack of experimental data for frequencies below the resonant frequency.
The increasing linear relationship between SSP and torque irrespective of the subject is in accordance with data reported in the literature (Joyce et al. 1974; Zahalak & Heyman, 1979; Cannon & Zahalak, 1982). This dependence between SSP and active torque indicates that muscle structures contribute to stiffness measured by using SP. It was used to calculate a stiffness index (SISP) characterizing the joint behaviour of a subject in terms of normalized stiffness. DMD patients were separated into two groups (test scores ≥ 5 and < 5) by the global SSP-torque relationship. Nevertheless, a linear relationship was only found for DMD patients with a test score ≥ 5. For these DMD subjects, a significant difference in mean SISP compared with that of healthy subjects pointed to the sensitivity of the sinusoidal perturbation method. Furthermore, additional results for healthy subjects developing low torques did not change the global SISP. This reinforces the differences in SISP observed between healthy subjects and DMD patients.
Stiffness indices and muscle weakness
When considering either healthy subjects or DMD patients, mean SISP was significantly lower than mean SIQR (P < 0.05). This shows that these two kinds of stiffness have different origins. SIQR reflects SEC muscle ability to release potential energy stored during a previous contraction. SISP indicates musculo-tendinous and joint structure abilities to react to an imposed displacement disturbance. In the present study, both mean stiffness indices were significantly higher for DMD patients than for healthy subjects. These indices increased substantially as the disease worsened: the increase in stiffness was more marked for children with lower scores on Brooke's scale (Brooke et al. 1981). Surprisingly, and especially for quick-release results, stiffness-torque relationships separated the DMD population into two groups, whereas DMD is known to be a progressive dystrophy. Nevertheless, these results are in accordance with those presented in Table 2, showing exponential increases in stiffness index with the stage of disease. In fact, a large increase in stiffness index is observed from the test score threshold value of 5. This is not easily explainable in terms of genetic factors but could be due to a more marked increase in the balance between fibro-adipose tissue and muscle tissue from this stage of the disease.
In terms of SEC stiffness, SIQR changes are explainable in terms of structural changes in DMD muscles reported in the literature. More precisely, increases in SIQR can be explained by changes in active structures (muscle fibres) as well as passive structures (tendons, surrounding tissues). Regarding active structures, the contractile component, located in cross-bridges, is known to be modified according to changes in functional demand (Fitts & Holloszy, 1977; Almeida Silveira et al. 1994). Moreover, several studies have shown that it was possible to induce fibre-type transitions and SEC stiffness changes simultaneously in the rat soleus muscle in response to training (Goubel & Marini, 1987) or disuse (Canon & Goubel, 1995). However, data on skinned fast-twitch and slow-twitch fibres indicate no differences in the elastic characteristics of cross-bridges whatever the myosin heavy chain isoform (Galler et al. 1996). It is also conceivable that elastic structures in series with slow-twitch fibres and those in series with fast-twitch fibres have different stiffness characteristics. This could explain discrepancies between the results obtained with skinned fibres and whole muscle. Nonetheless, when a whole muscle decreases its proportion of fast-twitch fibres, its SEC stiffness increases in proportion. Type I fibres are considered to predominate in DMD muscles (Dubowitz & Brooke, 1973) and it is generally accepted that during disease progression the proportion of type I fibres increases whereas type IIB fibre deficiency is observed (Nonaka et al. 1981; Webster et al. 1988). Such changes can contribute to the observed increase in SEC stiffness.
Regarding passive structures, DMD is characterized by a direct effect on muscle fibres leading to a deficit and muscular atrophy. The primary muscular process is segmentary necrosis of muscle fibres, which is incompletely compensated by fibre regeneration by necrosis-activated satellite cells. Marked interstitial fibrosis then progressively develops. The observed muscle weakness parallels the progressive loss of muscular tissue and its replacement by fibro-adipose tissue (Bell & Conen, 1968). This can obviously explain the observed increase in SEC stiffness with disease progression. Furthermore, the increase in joint resistance could interfere with SEC recoil during the initial phase of the quick-release movement, leading to an increase in SEC stiffness. This could partially explain the gap observed in the stiffness index between test scores of 5 and 4. In fact, from a test score of ≤ 4, patients have contractures that cause an additional resistance to movement. All of these features concerning changes in both active and passive structures in DMD subjects can explain the increase in SIQR with disease-related changes characterized by the quick-release method.
In terms of total joint stiffness, changes in SISP may result from structural changes in DMD muscle, tendon and in peri- and intra-articular structures. Then, the parallel elastic component (PEC) of Hill's muscle model has to be considered (Hill, 1938). PEC comprises the sarcolemma, connective tissue and titin (Horowits, 1992). Its characteristics can be modified according to functional demand (Kovanen et al. 1989). Moreover, as a consequence of the disease, the relative immobilization of the musculo-articular structures can lead to an increase in passive resistance of the joint. It is well known that intra-articular and peri-articular structures are more responsive to disuse than to an increase in use (Tipton et al. 1986). Noyes (1977) found a decrease in elasticity modules of a bone-ligament-bone preparation after immobilization. This result was confirmed by Klein et al. (1982). Immobilization was also found to increase considerably the passive resistance of the human knee joint (Heerkens et al. 1986). Such changes due to relative immobilization of the elbow joint contribute to the observed increase in SISP with disease. Furthermore, as has been previously shown with the quick-release method, the increase in total joint stiffness in DMD results at least partly from the increase in SEC stiffness.
In this study, it has been shown that SIQR and SISP increased as the disease progressed. This suggests that these parameters can be used to monitor DMD progression and may be of use in other muscle diseases. Both quick-release and sinusoidal perturbation methods are sufficiently sensitive to characterize DMD changes, giving information about changes in series elastic stiffness and in total joint stiffness. This should complete the clinical picture obtained by using devices where stiffness is only evaluated in terms of rigidity, i.e. resistance to motion performed by the examiner (Ghika et al. 1993; Caligiuri, 1994; Prochazka et al. 1997). However, further experiments combining mechanical and neurophysiological approaches are needed to improve knowledge of the predominant behaviour of passive and active structures that leads to the functional consequences observed in DMD.
Acknowledgments
We are very grateful to J. Paulus and M. Meunier who performed the manual muscle tests. This work was supported by grants from the A.F.M. (Association Française contre les Myopathies). The authors thank David Marsh for correcting the English.
References
- Agarwal GC, Gottlieb GL. Oscillation of the human ankle joint in response to applied sinusoidal torque on the foot. Journal of Physiology. 1977;268:151–176. doi: 10.1113/jphysiol.1977.sp011852. [DOI] [PMC free article] [PubMed] [Google Scholar]
- Aitkens S, Lord AF, Bernauer E. Relationship of manual muscle testing to objective strength measurements. Muscle and Nerve. 1989;12:173–177. doi: 10.1002/mus.880120302. [DOI] [PubMed] [Google Scholar]
- Almeida silvera MI, Pérot C, Pousson M, Goubel F. Effects of stretch-shortening cycle training on mechanical properties and fibre type transition in the rat soleus muscle. Pflügers Archiv. 1994;427:289–294. doi: 10.1007/BF00374536. [DOI] [PubMed] [Google Scholar]
- Angel RW, Eppler W, Iannone A. Silent period produced by unloading of muscle during voluntary contractions. Journal of Physiology. 1965;180:864–870. doi: 10.1113/jphysiol.1965.sp007736. [DOI] [PMC free article] [PubMed] [Google Scholar]
- Bell CD, Conen PE. Histopathologic changes in Duchenne muscular dystrophy. Journal of the Neurological Sciences. 1968;7:529–544. doi: 10.1016/0022-510x(68)90058-0. [DOI] [PubMed] [Google Scholar]
- Brooke MH, Griggs RC, Mendel JR. Clinical trial in Duchenne dystrophy: The design of the protocol. Muscle and Nerve. 1981;4:186–197. doi: 10.1002/mus.880040304. [DOI] [PubMed] [Google Scholar]
- Caligiuri MP. Portable device for quantifying parkinsonian wrist rigidity. Movement Disorders. 1994;9:57–63. doi: 10.1002/mds.870090109. [DOI] [PubMed] [Google Scholar]
- Cannon SC, Zahalak GI. The mechanical behavior of active human skeletal muscle in small oscillations. Journal of Biomechanics. 1982;15:111–121. doi: 10.1016/0021-9290(82)90043-4. [DOI] [PubMed] [Google Scholar]
- Canon F, Goubel F. Changes in stiffness induced by hindlimb suspension in rat soleus muscle. Pflügers Archiv. 1995;429:332–337. doi: 10.1007/BF00374147. [DOI] [PubMed] [Google Scholar]
- Cornu C, Goubel F, Fardeau M. Stiffness of knee extensors in Duchenne muscular dystrophy. Muscle and Nerve. 1998;21:1772–1774. doi: 10.1002/(sici)1097-4598(199812)21:12<1772::aid-mus21>3.0.co;2-0. [DOI] [PubMed] [Google Scholar]
- Dubowitz V, Brooke MH. Muscle Biopsy: A Modern Approach. London: Saunders; 1973. [Google Scholar]
- Edwards RHT, Hide S. Methods of measuring muscle strength and fatigue. Physiotherapy. 1977;63:51–55. [PubMed] [Google Scholar]
- Engel AG, Yamamoto M, Fischbeck KH. Dystrophinopathy. In: Engel AG, Armstrong C, editors. Myology. Vol. 2. New York: McGraw-Hill; 1994. pp. 1133–1187. [Google Scholar]
- Fitts RH, Holloszy JO. Contractile properties of rat soleus muscle: effects of training and fatigue. American Journal of Physiology. 1977;233:86–91. doi: 10.1152/ajpcell.1977.233.3.C86. [DOI] [PubMed] [Google Scholar]
- Galler S, Hilber K, Pette D. Force responses following stepwise length changes of rat skeletal muscle fibre types. Journal of Physiology. 1996;493:219–227. doi: 10.1113/jphysiol.1996.sp021377. [DOI] [PMC free article] [PubMed] [Google Scholar]
- Ghika J, Wiegner AW, Fang JJ, Davies L, Young RR, Growdon JH. Portable system for quantifying motor abnormalities in Parkinson's disease. IEEE Transactions on Biomedical Engineering. 1993;40:276–283. doi: 10.1109/10.216411. [DOI] [PubMed] [Google Scholar]
- Goubel F. Changes in mechanical properties of human muscle as a result of spaceflight. International Journal of Sports Medicine. 1997;18:S285–287. doi: 10.1055/s-2007-972727. [DOI] [PubMed] [Google Scholar]
- Goubel F, Marini JF. Fibre type transition and stiffness modification of soleus muscle of trained rats. Pflügers Archiv. 1987;410:321–325. doi: 10.1007/BF00580283. [DOI] [PubMed] [Google Scholar]
- Goubel F, Pertuzon E. Evaluation de l'élasticité du muscle in situ par une méthode de quick-release. Archives Internationales de Physiologie et Biochimie. 1973;81:697–707. [PubMed] [Google Scholar]
- Heerkens YF, Woittiez RD, Huijing PA, Huson A. Passive resistance of the human knee: The effect of immobilization. Journal of Biomedical Engineering. 1986;8:95–104. doi: 10.1016/0141-5425(86)90043-9. [DOI] [PubMed] [Google Scholar]
- Hill AV. The heat of shortening and the dynamic constants of muscle. Proceedings of the Royal Society. 1938;126:B136–195. [Google Scholar]
- Hof AL. Correcting for limb inertia and compliance in fast ergometer. Journal of Biomechanics. 1997;30:295–297. doi: 10.1016/s0021-9290(96)00128-5. [DOI] [PubMed] [Google Scholar]
- Horowits R. Passive force generation and titin isoforms in mammalian skeletal muscle. Biophysical Journal. 1992;61:392–398. doi: 10.1016/S0006-3495(92)81845-3. [DOI] [PMC free article] [PubMed] [Google Scholar]
- Huxley AF, Simmons RM. Proposed mechanism of force generation in striated muscle. Nature. 1971;233:533–538. doi: 10.1038/233533a0. [DOI] [PubMed] [Google Scholar]
- Jewell BR, Wilkie DR. An analysis of the mechanical components in frog's striated muscle. Journal of Physiology. 1958;143:515–540. doi: 10.1113/jphysiol.1958.sp006075. [DOI] [PMC free article] [PubMed] [Google Scholar]
- Joyce GC, Rack PM, Ross HF. The forces generated at the human elbow joint in response to imposed sinusoidal movements of the forearm. Journal of Physiology. 1974;240:351–374. doi: 10.1113/jphysiol.1974.sp010614. [DOI] [PMC free article] [PubMed] [Google Scholar]
- Kearney RE, Hunter LW. System identification of human joint dynamics. Critical Reviews in Biomedical Engineering. 1990;18:55–87. [PubMed] [Google Scholar]
- Klein L, Player JS, Heipke KG, Bahniuk E, Goldberg VM. Isotopic evidence for resorption of soft tissues and bone in immobilized dogs. Journal of Bone and Joint Surgery. 1982;64A:225–230. [PubMed] [Google Scholar]
- Kovanen V. Effects of ageing and physical training on rat skeletal muscle. Acta Physiologica Scandinavica. 1989;135(suppl. 577):1–56. [PubMed] [Google Scholar]
- Lambertz D, Pérot C, Kaspranski R, Goubel F. Effects of long-term spaceflight on mechanical properties of muscles in humans. Journal of Applied Physiology. 2001;90:179–188. doi: 10.1152/jappl.2001.90.1.179. [DOI] [PubMed] [Google Scholar]
- Levy EC. Complex curve fitting. IEEE Transactions on Automatic Control. 1959;4:37–43. [Google Scholar]
- Medical Research Council. Aids to the Evaluation of Peripheral Nerve Injuries. London: Her Majesty's Stationery Office; 1943. pp. 11–46. [Google Scholar]
- Munsat TL. Quantification of Neuromuscular Deficit. Boston: Butterworth-Heinemann; 1989. [Google Scholar]
- Nonaka I, Takagi A, Sugita H. The significance of type 2C muscle fibers in Duchenne muscular dystrophy. Muscle and Nerve. 1981;4:326–333. doi: 10.1002/mus.880040409. [DOI] [PubMed] [Google Scholar]
- Noyes FR. Functional properties of knee ligaments and alterations induced by immobilization. Clinical Orthopaedics. 1977;123:210–242. [PubMed] [Google Scholar]
- Pousson M, Van Hoecke J, Goubel F. Changes in elastic characteristics of human muscle induced by eccentric exercise. Journal of Biomechanics. 1990;23:343–348. doi: 10.1016/0021-9290(90)90062-8. [DOI] [PubMed] [Google Scholar]
- Prochazka A, Bennet DJ, Stephens MJ, Patrick SK, Sears-Duru R, Roberts T, Jhamandas JH. Measurement of rigidity in Parkinson's disease. Movement Disorders. 1997;12:24–32. doi: 10.1002/mds.870120106. [DOI] [PubMed] [Google Scholar]
- Rack PM. The behaviour of a mammalian muscle during sinusoidal stretching. Journal of Physiology. 1966;183:1–14. doi: 10.1113/jphysiol.1966.sp007848. [DOI] [PMC free article] [PubMed] [Google Scholar]
- Shorten MR. Muscle elasticity and human performance. In: Van gheluwe B, editor. Medicine and Sport Science. Vol. 25. 1987. Atha J 1 18 Basel Karger. [Google Scholar]
- Tipton CM, Vailas AC, Matthes RD. Experimental studies on the influence of physical activity on ligaments, tendons and joints: a brief review. Acta Medica Scandinavica. 1986;711(suppl):157–168. doi: 10.1111/j.0954-6820.1986.tb08945.x. [DOI] [PubMed] [Google Scholar]
- Tognella F, Mainar A, Vanhoutte C, Goubel F. A mechanical device for studying mechanical properties of human muscles in vivo. Journal of Biomechanics. 1997;30:1077–1079. doi: 10.1016/s0021-9290(97)00067-5. [DOI] [PubMed] [Google Scholar]
- Webster C, Silberstein L, Hays AP, Blau HM. Fast muscle fibers are preferentially affected in Duchenne muscular dystrophy. Cell. 1988;52:503–513. doi: 10.1016/0092-8674(88)90463-1. [DOI] [PubMed] [Google Scholar]
- Wilkie DR. The relation between force and velocity in human muscle. Journal of Physiology. 1950;110:249–280. doi: 10.1113/jphysiol.1949.sp004437. [DOI] [PMC free article] [PubMed] [Google Scholar]
- Wilkie DR. The mechanical properties of muscle. British Medical Bulletin. 1956;12:177–182. doi: 10.1093/oxfordjournals.bmb.a069546. [DOI] [PubMed] [Google Scholar]
- Winters J, Starck L, Seif-Naraghi AH. An analysis of the sources of musculo-skeletal system impedance. Journal of Biomechanics. 1988;21:1011–1025. doi: 10.1016/0021-9290(88)90248-5. [DOI] [PubMed] [Google Scholar]
- Zahalak GI, Heyman SJ. A quantitative evaluation of the frequency-response characteristics of active human skeletal muscle in vivo. Journal of Biomechanical Engineering. 1979;101:28–37. [Google Scholar]