

Abstract
In skeletal muscle, dihydropyridine (DHP) receptors control both Ca2+ entry (L-type current) and internal Ca2+ release in a voltage-dependent manner. Here we investigated the question of whether elimination of the skeletal muscle-specific DHP receptor subunit γ1 affects excitation-contraction (E–C) coupling. We studied intracellular Ca2+ release and force production in muscle preparations of a mouse deficient in the γ1 subunit (γ–/–).
The rate of internal Ca2+ release at large depolarization (+20 mV) was determined in voltage-clamped primary-cultured myotubes derived from satellite cells of adult mice by analysing fura-2 fluorescence signals and estimating the concentration of free and bound Ca2+. On average, γ–/– cells showed an increase in release of about one-third of the control value and no alterations in the time course.
Voltage of half-maximal activation (V1/2) and voltage sensitivity (k) were not significantly different in γ–/– myotubes, either for internal Ca2+ release activation or for the simultaneously measured L-type Ca2+ conductance. The same was true for maximal Ca2+ inward current and conductance.
Contractions evoked by electrical stimuli were recorded in isolated extensor digitorum longus (EDL; fast, glycolytic) and soleus (slow, oxidative) muscles under normal conditions and during fatigue induced by repetitive tetanic stimulation. Neither time course nor amplitudes of twitches and tetani nor force-frequency relations showed significant alterations in the γ1-deficient muscles.
In conclusion, the overall results show that the γ1 subunit is not essential for voltage-controlled Ca2+ release and force production.
The transverse tubules of skeletal muscle cells contain a high density of DHP binding sites (reviewed by Lamb, 1992). Two functions have been assigned to the DHP-binding proteins (DHP receptors): the activation of a Ca2+ conductance (L-type Ca2+ current) with exceptionally slow kinetics, and the activation of intracellular release of Ca2+ from the sarcoplasmic reticulum (SR) (reviewed in Melzer et al. 1995). The latter process is probably the result of direct interaction between DHP receptor and Ca2+-release channels (ryanodine receptors) (reviewed in Melzer & Dietze, 2001) and does not depend on Ca2+ entering the cell during the depolarization (Spiecker et al. 1979; Brum et al. 1988; Dirksen & Beam, 1999). The transverse tubular DHP receptor forms a heteropentameric complex consisting of the voltage-sensitive, channel-forming polypeptide α1S that contains the DHP binding sites and molecular determinants for interaction with the ryanodine receptor (Grabner et al. 1999) and four auxiliary subunits: β, γ, α2 and δ (for review see Walker & De Waard, 1998). α1S and β have been shown to be essential for E-C coupling (Beam et al. 1986; Gregg et al. 1996) and their elimination is lethal. The fact that the γ subunit (γ1 isoform) could only be detected in skeletal muscle also suggests a role for this polypeptide that is important for muscle function (Jay et al. 1990; Powers et al. 1993; Wissenbach et al. 1998). γ1 is a transmembrane protein of 32 kDa (222 amino acid residues) containing four putative membrane-spanning segments (Bosse et al. 1990; Jay et al. 1990). Functional studies of the γ1 subunit have up to now been restricted to measuring transmembrane ionic currents. The effects of γ1 on Ca2+ or Ba2+ inward currents have been investigated by coexpression of the subunit with the cardiac muscle α1C subunit in heterologous expression systems (Singer et al. 1991; Wei et al. 1991; Lerche et al. 1996; Eberst et al. 1997; Sipos et al. 2000). An alternative approach to studying the role of subunits is the use of specific knockout systems. A recently generated γ1-deficient mouse now permits the study of the effects of γ1 on α1S in its normal environment (Freise et al. 2000). In myotubes of neonatal γ1-deficient mice, a change in the voltage dependence of slow inactivation and enhanced activation of inward current have been reported (Freise et al. 2000). Because of the skeletal muscle specificity of γ1 and because of the critical role of the DHP receptor in controlling Ca2+ release in skeletal muscle, one might expect γ1 to play a crucial part in this process. Attempts have been made, but they failed to reconstitute voltage-controlled Ca2+ release by coexpressing ryanodine receptors and DHP receptor subunits in non-muscle cells (Takekura et al. 1995). Here we describe the first investigation of E-C coupling in γ1-deficient mice. We focused on the voltage-dependent activation process. For this purpose we studied the time course of activation of Ca2+ release in primary cultured myotubes and its voltage dependence as well as characteristics of contraction of mature fast and slow muscles under both normal and fatigue conditions.
METHODS
Experimental animals
γ+/+ and γ–/– mice carrying the 129SVJ genetic background were used for the experiments. They were bred and kept in the essential specific pathogen-free animal facility of the University at Homburg. The procedure of generating the γ–/– mouse has been described by Freise et al. (2000). We used mice ranging in age from 78 to 150 days for γ+/+ and from 58 to 141 days for γ–/–. The animals were killed by exposure to a rising concentration of CO2, in agreement with the regulations of the local animal welfare committee. The genotype of the mice was confirmed by a polymerase chain reaction assay using tail clips.
Cell culture
Pieces of muscle weighing 100-400 mg were excised from the hindlimbs, cut into small pieces and subjected to enzymatic dissociation at 37 °C for 60 min. The dissociation solution consisted of F12 medium (Gibco) and contained 1.5 mg ml−1 collagenase (17449, Serva I), 2 mg ml−1 protease (P6141, Sigma Type IX), 50 μg ml−1 gentamycin (Biochrom), 2 mm Hepes, pH 7.2. After filtering (pore size 20 μm), the suspension was centrifuged and the pellet was resuspended in F12/CMRL growth medium with 5 % fetal calf serum (Gibco) and 5 % horse serum (Gibco) and seeded in culture flasks. Two days later the cells were detached from the flasks by trypsin solution (0.15 % trypsin and 0.08 % EDTA in Ca2+- and Mg2+-free phosphate-buffered saline (PBS)) and plated on carbon- and collagen-coated coverslips. The next day the medium was changed to F12/CMRL medium with 5 % horse serum to induce differentiation. Throughout the culture, the cells were kept at 37 °C. Most measurements were carried out 4-7 days after reduction of the serum concentration.
Experimental solutions
The solutions for fluorescence and current measurements had the following composition. Bathing solution (mm): 130 tetraethylamonium hydroxide (TEA-OH), 127 HCl, 10 CaCl2, 1 MgCl2, 10 Hepes, 2.5 4-aminopyridine (4-AP), 0.0013 tetrodotoxin (TTX); pH was adjusted with HCl to 7.4. Pipette solution (mm): 145 CsOH, 110 HCl, 1.5 CaCl2 (resulting in 20 nm free Ca2+), 10 Hepes, 15 EGTA, 5 MgATP, 5 sodium creatine phosphate, 0.2 fura-2 (pentapotassium salt), pH 7.2. The Krebs-Ringer solution used for contraction measurements (purchased from Gibco) was composed of (mm): 118 NaCl, 3.4 KCl, 0.8 MgSO4, 1.2 KH2PO4, 11.1 glucose, 25.0 NaHCO3, 2.5 CaCl2, pH 7.4.
Current measurements and analysis
Myotubes were voltage clamped in the whole-cell configuration with an EPC-7 patch-clamp amplifier with an extended range of capacitance compensation (1000 pF). Pipettes were pulled from borosilicate glass and had resistances between 1.5 and 2 MΩ when filled with pipette solution. Fluorescence and current data were recorded simultaneously at 4 kHz using a DA/AD interface (Digidata 1200, Axon Instruments) connected to a 486DX computer. For data acquisition and analysis the pCLAMP 6.0 software package (Axon Instruments) and Excel (Microsoft) were used. The last 8 ms of depolarization in each trace were averaged and plotted vs. voltage. To obtain the current-voltage relations of the L-type current, the data were least-squares fitted with eqn (1) in which the first term is used to correct for a linear leak component:
| (1) |
| (2) |
Here, gleak and Vleak are the conductance and reversal potential of the leak component and gCa,max and VCa are the maximal conductance and reversal potential of the Ca2+ current. The gating function f(V) is defined by eqn (2). V1/2 and k are the voltage of half-maximal activation and the voltage sensitivity, respectively.
Fluorescence measurements and determination of Ca2+ release
The cells were loaded with the indicator dye (see above) by diffusion from the patch pipette. Fura-2 fluorescence was detected with a photomultiplier system (SF, Zeiss) attached to an inverted epifluorescence microscope (IMT-2, Olympus) at the emission wavelength of 510 nm (interference filter: Omega Optical, bandwidth 40 nm). Excitation wavelengths of 380 nm (for Ca2+ signals) and 358 nm (isosbestic point) were used (interference filters: Schott, bandwidth 14 and 9 nm, respectively). The experiments were carried out at room temperature (20-23 °C).
Using the ratio of the fluorescence signals (F380/F358) at the two excitation wavelengths, free Ca2+ and Ca2+ input flux, i.e. the total flux of Ca2+ into the myoplasm, were estimated as described by Dietze et al. (2000). The Ca2+ flux was calculated using a program written in Delphi (Borland International, Scotts Valley, CA, USA) (for equations see Baylor et al. 1983, and Brum et al. 1988) assuming the presence of fura-2 (0.2 mm), EGTA (15 mm) and troponin C (0.24 mm of fast Ca2+-specific T-sites and 0.24 mm of slow Ca2+-Mg2+ sites with parvalbumin-type behaviour, P-sites; rate constants from Baylor & Hollingworth, 1998) as intracellular Ca2+ buffers. The binding parameter values used were as follows. Fura-2: kon,Ca,Fura= 173 μm−1 s−1, koff,Ca,Fura= 30 s−1 (Dietze et al. 1998); T-sites: kon,Ca,T= 88.5 μm−1 s−1, koff,Ca,T= 115 s−1; P-sites: kon,Ca,P= 41.7 μm−1 s−1, koff,Ca,P= 0.5 s−1, kon,Mg,P= 0.033 μm−1 s−1, koff,Mg,P= 3 s−1. For EGTA we chose the rate constants of Smith et al. (1984): kon,Ca,EGTA= 1.5 μm−1 s−1, koff,Ca,EGTA= 0.3 s−1 and a modified set (same KD) to obtain close to zero release immediately after repolarization (see Results and Dietze et al. 2000). ΔF/F, the depolarization-induced fluorescence change divided by the resting fluorescence at the same wavelength, was used for determining the voltage dependence of the release process.
Contraction measurements
Both EDL and soleus muscles were dissected from the hindlimbs of the animals and mounted vertically in an organ bath filled with Krebs-Ringer solution (see Solutions) that was saturated with carbogen (95 % O2-5 % CO2) by continuous bubbling and held at a temperature of 25 °C. The muscles were stretched to optimal length and stimulated via platinum field electrodes using 1 ms supramaximal shocks (20 V). Isometric force was measured with a force-voltage transducer (Model FT03, Grass Instruments, Quincy, USA). The force signals were digitized with a Digidata 1200 analog-digital board (Axon Instruments). The sampling frequency was 1 kHz. Data sampling was synchronized with the output of TTL pulses that triggered the analog device used for extracellular stimulation. Data acquisition and analysis were carried out by software written in Delphi (Borland) running on a Pentium computer.
Statistics
Mean data are presented and plotted as means ±s.e.m. (n = number of experiments). Student's two-sided t test was used to test for significant differences of mean values (assuming two independent populations; P = 0.05 unless otherwise stated). Statistical power calculations were carried out using software tools provided by R. V. Lenth on the public domain of the Department of Statistics and Actuarial Science, University of Iowa (www.stat.uiowa.edu/≈rlenth/) and with the program Power and Precision (version 1.20, Biostat, Teaneck, NJ, USA).
RESULTS
Ca2+ release rate in myotubes
We chose primary cultured myotubes derived from satellite cells of adult muscle to compare Ca2+ release in γ+/+ and γ–/– muscle under voltage-clamp conditions. Myotubes have been used in various molecular physiology studies as model systems to investigate voltage-controlled Ca2+ release of skeletal muscle and they show characteristics of this process similar to mature vertebrate muscle (e.g. Garcia & Beam, 1994; Strube et al. 1996; Dietze et al. 1998, 2000). Satellite cells were enzymatically isolated from the mouse skeletal muscle tissue and cultured as described in Methods. After seal formation and breaking the patch, the loading of the myotube with the artificial internal solution of the pipette was observed by the rise of the fura-2 resting fluorescence. After at least 5 min loading time, stimulation of internal Ca2+ release was started by applying depolarizing pulses of 100 ms duration from the holding potential of -90 mV.
We used the fluorescence decrease of fura-2 at 380 nm excitation that originates from Ca2+ release to estimate the rate of Ca2+ release as described previously (Dietze et al. 1998, 2000). The procedure is shown in Fig. 1 for a single depolarization to +20 mV in a γ+/+ (Fig. 1a) and a γ–/– (Fig. 1B) myotube, respectively. It first involves the calculation of free Ca2+ (b panels) from the fura-2 ratio signal (a panels; Klein et al. 1988) and in a second step the calculation of total myoplasmic Ca2+ by solving a set of differential equations describing the binding of Ca2+ to myoplasmic binding sites (Baylor et al. 1983). The time derivative of the total myoplasmic Ca2+ is the input flux of Ca2+ into the myoplasmic space (c panels). The method suffers from the fact that parameters such as the concentrations of intrinsic binding sites and their binding rate constants that are used in the calculation have to be assumed, based on biochemical data from other vertebrate muscles. To mitigate this problem, we applied a high concentration (15 mm) of the chelator EGTA together with the indicator, a method that was originally introduced by Gonzalez & Rios (1993) for experiments on frog muscle fibres. Under these conditions EGTA dominates intracellular Ca2+ binding. Therefore, errors made in quantifying intrinsic binding sites and consequently possible differences in the expression of Ca2+-binding proteins between the two groups of cells will be of minor effect (Dietze et al. 1998). In addition, the EGTA prevents movement artefacts and avoids excessive saturation of the indicator dye. In Fig. 1 we used the rate constants of EGTA determined by Smith et al. (1984) in vitro for the input Ca2+ flux estimate (see Methods).
Figure 1. Estimating the time course of Ca2+ release in myotubes using fura-2 fluorescence transients.
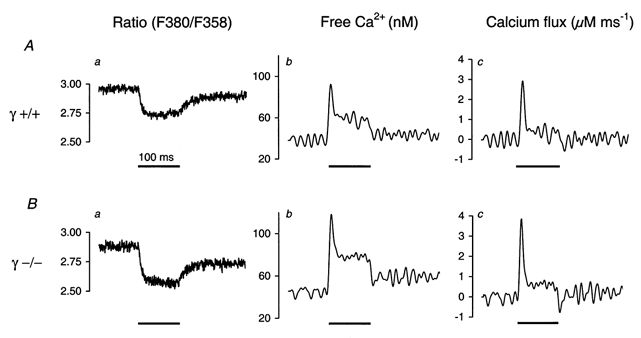
A, ratio F380/F358 of single fura-2 fluorescence signals obtained at a 100 ms depolarization to +20 mV (horizontal bar) in a γ+/+ myotube (a), calculated free Ca2+ after correction for the indicator time response (b) and Ca2+ input flux (c) (see Results and Methods). B, corresponding calculations for a γ–/– myotube.
Figure 2 shows averaged calculation results of signals obtained with pulses to +20 mV from 23 γ+/+ (A) and 14 γ–/– experiments (B). Similar to a previous study on porcine myotubes (Dietze et al. 2000), an undershoot of the calculated input flux below baseline values resulted (a panels) when using the same set of literature values for the rate constants as in Fig. 1. This undershoot could be reduced by increasing the values of both EGTA rate constants. A minimal undershoot relative to the signal amplitude was obtained when raising both rate constants tenfold (b panels in Fig. 2). The overall shape of the flux time course changed relatively little. The thin lines indicate the standard errors of the means. The higher peak release rate of the γ–/– cells (32.6 % increase in (a) and 32.0 % in (b)) was statistically significant at P = 0.01. Similarly, the total Ca2+ released within 100 ms of depolarization at +20 mV was about 30 % higher in the γ-deficient cells (see legend of Fig. 2). These estimated alterations were independent of the choice of EGTA parameters. On the other hand, the ratio of the peak: end values of the rate of release was not significantly different (γ+/+: 6.18 ± 1.11 (Fig. 2Aa) and 4.08 ± 0.35 (Fig. 2Ab);γ–/–: 6.17 ± 0.52 (Fig. 2Ba) and 3.82 ± 0.23 (Fig. 2Bb)).
Figure 2. Mean time course of the Ca2+ release rate in myotubes.
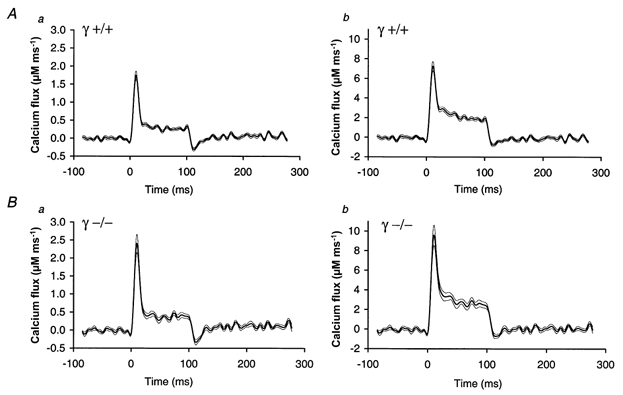
Comparison of calculated Ca2+ release rate using the means of 23 measurements in γ+/+ myotubes (A) and 14 measurements in γ–/– myotubes (B). Release was activated by a 100 ms depolarization to +20 mV. For panels Aa and Ba, the parameters used in the calculation were the same as in Fig. 1. In panels Ab and Bb, the rate constants of EGTA were altered at constant KD to match more accurately the condition of zero release following repolarization to the holding potential. Thin lines indicate s.e.m. On average, the peak release rate in the γ–/– cells was about one-third higher than the value estimated for γ+/+: 2.41 ± 0.26 μm ms−1vs. 1.75 ± 0.12 μm ms−1 in a and 9.60 ± 1.00 μm ms−1vs. 7.27 ± 0.47 μm ms−1 in b. The release rate during the steady level (averaged over the last 10 ms of the pulse) was similarly different: 0.39 ± 0.06 μm ms−1vs. 0.25 ± 0.03 μm ms−1 in a and 2.51 ± 0.29 μm ms−1vs. 1.78 ± 0.12 μm ms−1 in b. These changes led to a corresponding fractional increase of the total Ca2+ released during the pulse (a, 31.2 %; b, 29.7 %). Free Ca2+ values immediately before the pulses derived from the resting fluorescence ratios were 49 ± 10 nm in γ+/+ and 72 ± 14 nm in γ–/–. They were not significantly different (P = 0.15).
Voltage dependence of Ca2+ current and Ca2+ transients in myotubes
The calculation of free Ca2+ and of release involved numerical derivatives. To obtain a sufficient signal-noise ratio for the release estimates at smaller depolarizations requires signal averaging. Because the stability of the cells generally did not permit us to carry out the required number of measurements, the voltage dependence of the release process was determined by using the original fluorescence records at different voltage steps. Figure 3a and B exemplifies records of Ca2+ signals (b panels) and simultaneously measured Ca2+ inward currents (a panels) in individual myotubes of γ+/+ and γ–/– animals, respectively.
Figure 3. Voltage dependence of L-type Ca2+ conductance and Ca2+ release in myotubes.
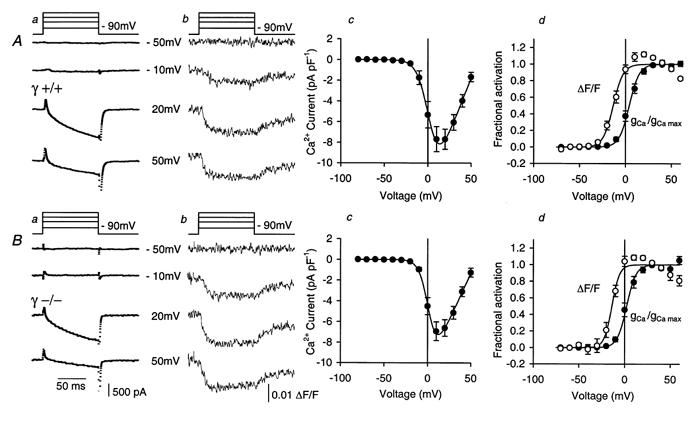
A, typical Ca2+ inward currents (a) and fluorescence transients (ΔF/F) (b) at different voltages, mean current-voltage relation (c) and normalized activation curves (d) of Ca2+ conductance (•) and Ca2+ release (○) in 14 experiments on γ+/+ myotubes. Best-fit parameter values of individual fits by eqn (1) and (2): gCa,max= 211 ± 22 pS pF−1, VCa= 59 ± 2 mV, V1/2= 4.11 ± 1.84 mV, k = 5.44 ± 0.26 mV. Fluorescence: V1/2= -12.72 ± 1.70 mV, k = 4.91 ± 0.36 mV. The curves were drawn using these parameter values. B, corresponding data to A of individual measurements (a and b) and mean values (c and d) of 8 experiments on γ–/– myotubes. Best-fit parameters: gCa,max= 180 ± 21 pS pF−1, VCa= 57 ± 2 mV, V1/2= 2.15 ± 2.10 mV, k = 5.10 ± 0.52 mV. Fluorescence: V1/2= -13.56 ± 2.91 mV, k = 4.04 ± 0.53 mV. Maximal inward current, maximal inward current density and voltage of maximal inward current were not significantly different: 1.06 ± 0.16 nA, 8.28 ± 1.18 pA pF−1 and 14.3 ± 1.6 mV, respectively, in the γ+/+ group vs. 1.14 ± 0.20 nA, 7.00 ± 0.84 pA pF−1 and 11.9 ± 2.0 mV, respectively, in the γ–/– group. Similarly, cell capacitance, series resistance, gleak and Vleak showed no significant difference: 133 ± 18 pF, 5.83 ± 0.43 MΩ, 17.32 ± 5.87 pS pF−1 and 20.4 ± 4.1 mV, respectively, for γ+/+vs. 149 ± 14 pF, 6.86 ± 1.23 MΩ, 17.65 ± 4.17 pS pF−1 and 14.4 ± 2.81 mV, respectively, for γ–/–.
The data for the current-voltage relations (c panels) and for the activation of conductance and Ca2+ release (d panels) in Fig. 3 were obtained by averaging results from 14 γ+/+ (Fig. 3A) and 8 γ–/– cells (Fig. 3B). The fitting procedures described in Methods were applied for each cell individually. From the raw current data, the fitted linear leak component was subtracted and eqn (1) was solved for the fractional conductance activation f(V). The means of the fitted parameters of the different cells are listed in the figure legend and were used for constructing the continuous curves in Fig. 3Ad and Bd.
The activation characteristics of both groups of cells were similar to those reported by Dietze et al. (1998) for myotubes of the mouse diaphragm: the Ca2+ current had its threshold at about -20 mV and reached its maximum at about 12 mV. Ca2+ signals were activated at less depolarizing potentials. However, the voltage of half-maximal activation, V1/2, and the voltage sensitivity parameter k of both Ca2+ conductance and intracellular Ca2+ signal showed no significant difference between γ–/– and γ+/+ cells (for values, see legend of Fig. 3). Similarly, the maximal current densities and maximal conductances were not significantly different. This was also the case for the set of experiments in Fig. 2 (current density at the end of the pulse: 10.42 ± 0.77 pA pF−1 in γ+/+vs. 8.92 ± 1.06 pA pF−1 in γ–/–). The data, however, do not allow us to rule out a difference in the order of 20 % of the maximal current density as reported by Freise et al. (2000) based on experiments on myotubes from neonatal mice.
In summary, the results described so far indicate only a modest increase in the Ca2+ release rate at large voltages in γ–/– myotubes.
Force activation in mature EDL and soleus muscle
To get information on E-C coupling of mature muscle we carried out experiments on isolated adult limb muscles from the two groups of mice and measured contractions induced by extracellular electrical stimulation. To be able to distinguish between possible alterations specific to different types of muscle fibres, we chose the extensor digitorum longus (EDL) muscle, which consists primarily of fast twitch fibres, and the soleus muscle, which is a slow twitch muscle.
Figure 4a shows recordings of contractions obtained with single pulses and with repetitive stimulation. The frequency of stimulation varied between 25 and 150 Hz in EDL and between 10 and 100 Hz in soleus. In between the 350 ms stimulation intervals muscles were allowed to rest for 60 s.
Figure 4. Contractile activation in fast and slow twitch muscles.
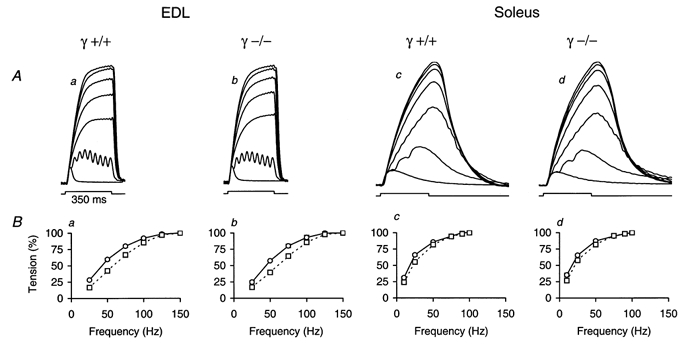
A, single twitches and contractions measured at different stimulation frequencies in EDL (a and b) and soleus muscle (c and d). Example recordings of γ+/+ (a and c) and γ–/– muscles (b and d) are shown. The rectangular signal below the traces shows the time interval of 350 ms in which repetitive stimulation was activated. Frequencies of 25, 50, 75, 100, 125 and 150 Hz were applied in EDL and of 10, 25, 50, 75, 90 and 100 Hz in soleus. The signals were normalized to the maximum. The maximal force values were 141 mN (a), 194 mN (b), 101 mN (c) and 74 mN (d). B, force-frequency relations derived from recordings similar to those shown in A. The normalized mean force values at the end of the stimulation period are plotted. In both γ+/+ and γ–/–, experiments were carried out on 4 EDL (a and b) and 3 soleus (c and d) muscles. The error bars indicating s.e.m. are smaller than the symbol sizes. ○, measured before fatigue; □, measured after stimulation leading to fatigue (tetanus amplitude 30 % of original value in EDL and 50 % in soleus, see Fig. 5) and a subsequent 30 min recovery interval. The mean values of the frequency that generated half-maximal force (F1/2) were 42.47 ± 1.01 Hz (γ+/+, n = 4) vs. 44.31 ± 0.71 Hz (γ–/–, n = 4) for EDL and 18.17 ± 0.73 Hz (γ+/+, n = 3) vs. 17.21 ± 1.19 Hz (γ–/–, n = 3) for soleus. After fatigue and 30 min recovery the corresponding values were 57.90 ± 1.89 Hz (γ+/+) vs. 60.29 ± 2.08 Hz (γ–/–) for EDL and 22.50 ± 0.79 Hz (γ+/+) vs. 21.39 ± 1.79 Hz (γ–/–) for soleus.
To quantify contractile properties we measured peak tension, time to peak (tpeak) and half-time of relaxation (t1/2) for single twitches, and maximal tension, time to half-maximal contraction within the 350 ms stimulation period (t1/2,contract) and time to half-relaxation after the end of stimulation (t1/2,relax) for tetani. The results are summarized in Table 1.
Table 1.
Comparison of twitch and tetanus parameters in γ+/+ and γ−/− muscles
| EDL (n = 8) | Soleus (n = 7) | |||||||
|---|---|---|---|---|---|---|---|---|
| γ+/+ | S.E.M. | γ−/− | S.E.M. | γ+/+ | S.E.M. | γ−/− | S.E.M. | |
| Twitch | ||||||||
| Tension (mN) | 23.27 | 1.46 | 20.38 | 2.34 | 8.98 | 0.70 | 8.48 | 0.53 |
| tpeak (ms) | 18.16 | 1.10 | 16.80 | 1.04 | 51.21 | 4.73 | 58.43 | 6.66 |
| t1/2 (ms) | 26.13 | 1.43 | 24.63 | 1.85 | 98.83 | 22.85 | 121.38 | 32.66 |
| Tetanus | ||||||||
| Tension (mN) | 179.89 | 13.43 | 154.57 | 15.01 | 96.54 | 12.78 | 78.29 | 8.49 |
| t1/2,contract (ms) | 56.95 | 2.86 | 50.98 | 2.43 | 122.10 | 7.02 | 116.43 | 2.79 |
| t1/2,relax (ms) | 36.93 | 0.56 | 38.61 | 0.74 | 147.47 | 7.23 | 164.61 | 16.51 |
| Twitch/tetanus | 0.131 | 0.005 | 0.131 | 0.006 | 0.103 | 0.037 | 0.112 | 0.006 |
For each genotype, 8 experiments were carried out on EDL and 7 experiments on soleus muscle. For single twitches values are: peak tension; tpeak, time to peak; and t1/2, half-time of relaxation. For tetani values are: maximal tension; t1/2,contract, time to half-maximal contraction within the 350 ms stimulation period; and t1/2,relax, time to half-relaxation after the end of stimulation.
In addition, the force-frequency relation, i.e. the dependence of maximal force at the end of a fixed stimulation period (350 ms) on pulse frequency, was determined. Mean force-frequency relations measured before a fatigue procedure (see below) and following a 30 min recovery period after fatigue are shown in Fig. 4B. Alterations in the action potentials, in potentiation or inactivation of Ca2+ release or changes in the contraction time course, induced by preceding activation, will influence the shape of this curve. The curves were defined by determining the frequency for half-maximal amplitude (F1/2, see legend of Fig. 4 for values).
None of the contraction parameters of the γ–/– muscles showed a statistically significant difference compared with γ+/+.
Fatigue in EDL and soleus muscle
A change in the function of γ1-deficient DHP receptors might reveal itself only under extreme physiological conditions. Notably, E-C coupling is one of the events that appear to be affected in muscle fatigue (for a review see Stephenson et al. 1998). Therefore, we carried out a series of experiments to study contraction of isolated fast and slow twitch muscles during periods of repetitive tetanic stimulation that lead to fatigue. A protocol similar to the one previously applied to single mouse muscle fibres by Lännergren & Westerblad (1991) was applied. Stimulation intervals (pulse frequency 125 Hz for EDL and 75 Hz for soleus) were initially separated by recovery intervals of 4 s. The duration of the recovery intervals was shortened by 20 % every 2 min. The stimulation continued until a time when tetanic tension was reduced to 30 % (T30 %) and 50 % (T50 %) of the initial tension for EDL and soleus, respectively. A single twitch was applied 500 ms before each tetanus to determine twitch/tetanus ratios (Fig. 5a and B).
Figure 5. Fatigue in fast and slow twitch muscle.
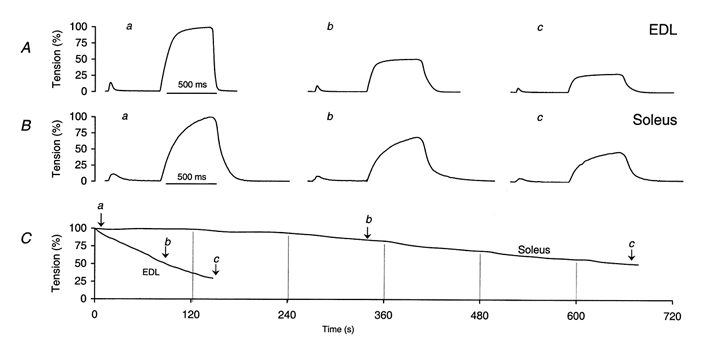
Examples of twitch and tetanus recordings in EDL (A) and soleus (B) at different times during fatigue stimulation (see text for details). C, amplitude change of tetanic contraction in EDL and soleus plotted against time to exemplify fatigue runs. a, b and c indicate the times when the signals shown in A and B were recorded. Vertical lines indicate times when the tetanus repetition rate was increased (see text for details).
Figure 5 exemplifies the changes in amplitude and time course of twitches and tetani during a fatigue run for one EDL and one soleus experiment. Due to its higher oxidative capacity (Westerblad et al. 1991), soleus is considerably more resistant to fatigue than EDL. Note also the prolongation of relaxation in parallel with the progressive amplitude decrease in EDL.
To compare the changes of the tetanus parameters during fatigue in γ+/+ and γ–/– muscle for each genotype, four experiments were carried out on EDL and three experiments on soleus, respectively. The twitch/tetanus ratio increased slightly over time in EDL and remained essentially constant in soleus. The relaxation of the tetani in EDL became considerably slower within the first minute of stimulation and then the half-time of relaxation remained about constant at more than twice the initial value; there was no comparable change in soleus. Apart from a small increase in T30 % of EDL (P = 0.048), all differences between γ+/+ and γ–/– remained below the significance threshold. Mean values of T30 % (EDL) were 146.5 ± 2.3 s for γ+/+ and 166.8 ± 7.9 s for γ–/–. T50 % values were 91.1 ± 2.2 s (γ+/+) vs. 101.3 ± 4.3 s (γ–/–) in EDL and 655.0 ± 46.5 s (γ+/+) vs. 732.5 ± 15.6 s (γ–/–) in soleus. The mean contraction parameters at T50 % for EDL and soleus and at T30 % for EDL are listed in Table 2.
Table 2.
Comparison of twitch and tetanus parameters in fatigued γ+/+ and γ−/− muscles
| At T50% | At T30% | |||||||||||
|---|---|---|---|---|---|---|---|---|---|---|---|---|
| EDL (n = 4) | Soleus (n = 3) | EDL (n = 4) | ||||||||||
| γ+/+ | S.E.M. | γ−/− | S.E.M. | γ+/+ | S.E.M. | γ−/− | S.E.M. | γ+/+ | S.E.M. | γ−/− | S.E.M. | |
| Twitch | ||||||||||||
| Tension (mN) | 18.27 | 1.35 | 15.64 | 1.22 | 5.58 | 1.32 | 8.47 | 0.59 | 13.44 | 1.07 | 10.73 | 0.93 |
| tpeak (ms) | 19.80 | 0.50 | 18.20 | 0.98 | 29.33 | 2.36 | 37.73 | 3.67 | 18.40 | 0.65 | 17.55 | 0.57 |
| t1/2 (ms) | 25.10 | 1.97 | 25.20 | 2.56 | 65.46 | 8.08 | 91.33 | 1.93 | 25.30 | 1.98 | 24.70 | 2.30 |
| Tetanus | ||||||||||||
| Tension (mN) | 105.91 | 4.21 | 90.71 | 9.87 | 35.55 | 4.45 | 34.07 | 3.15 | 63.29 | 2.41 | 58.84 | 4.53 |
| t1/2, contract (ms) | 45.50 | 1.55 | 42.75 | 2.25 | 118.00 | 3.06 | 126.00 | 2.31 | 39.75 | 0.85 | 38.50 | 1.66 |
| t1/2,relax (ms) | 92.00 | 1.22 | 85.5 | 3.66 | 133.67 | 9.17 | 147.67 | 2.96 | 87.00 | 2.12 | 79.75 | 4.27 |
| Twitch/tetanus | 0.170 | 0.008 | 0.168 | 0.007 | 0.133 | 0.041 | 0.165 | 0.047 | 0.195 | 0.015 | 0.189 | 0.012 |
For each genotype four experiments were carried out on EDL and three experiments on soleus muscle. Values were determined when the tetanus amplitude had declined to 50% of its initial value (T50%) in EDL and soleus and to 30% in EDL (T30%). For definitions see Table 1 and for description see text.
It is known that after fatigue resulting from repeated tetanic stimulation the maximal tetanic force (i.e. obtained at high stimulation frequency) recovers more rapidly than the force obtained at low stimulation frequencies (Westerblad et al. 1993). In force-frequency relations this effect shows up as a shift to higher frequencies (Fig. 4B, dashed lines). The finding has been attributed to a depression of Ca2+ release (Westerblad et al. 1993) and might, therefore, be different in muscles with altered DHP receptors. However, the force- frequency relations obtained after fatigue were indistinguishable between controls and knockout muscle (Fig. 4B).
DISCUSSION
In an initial study on myotubes from neonatal mice deficient in the DHP receptor γ1-subunit that focused on properties of the ionic current, it was reported that voltage-dependent inactivation became slower, that the voltage of half-maximal steady-state inactivation was displaced to depolarizing potentials and that the amplitude of inward current density increased, indicating enhanced Ca2+ influx during voltage-dependent activation (Freise et al. 2000).
In skeletal muscle the main source of Ca2+ for the activation of force is the sarcoplasmic reticulum. Voltage control of SR Ca2+ release is based on mechanical interaction between the DHP receptor and the ryanodine receptor (‘conformational’ E-C coupling, Rios et al. 1991). Because the tissue-specific expression of γ1 suggested a skeletal muscle-specific function, it was suspected (e.g. Wissenbach et al. 1998) that γ1 may play a crucial role in E-C coupling. If this is the case, one should expect large effects of a specific knockout of the protein on physiological signals related to this process. Therefore, in this investigation we measured - in addition to Ca2+ inward currents - Ca2+ release and contraction in muscle of γ1-deficient mice.
While the Ca2+ inward flux can be determined directly by measuring the transmembrane current, the flux of Ca2+ release from the SR can only be estimated indirectly based on the measured indicator signals, and this estimate depends on assumptions made for the kinetics of Ca2+ binding to myoplasmic sites. We are aware of the fact that the determination is subject to a number of uncertainties. Nevertheless, the phasic-tonic time course of the Ca2+ input flux resembles the signals in adult amphibian and mammalian muscle fibres, similarly measured in the presence of millimolar intracellular EGTA (Shirokova et al. 1996). We, therefore, think that our determination comes close to the real time course. To search for differences in the release characteristics of two groups of cells, the approach used here definitely seems adequate.
The characteristics of depolarization-induced Ca2+ release, assessed at +20 mV in our myotubes derived from satellite cells of murine limb muscle, were similar to those described previously by our laboratory for myotubes from satellite cells of the mouse diaphragm or of the porcine longissimus dorsi muscle (Dietze et al. 1998, 2000). The rate of voltage-controlled Ca2+ release showed a maximum soon after the beginning of a depolarization and dropped to a lower non-zero level. Release remained under the control of membrane voltage during depolarizations lasting 100 ms because it could be lowered rapidly by repolarization to the holding potential (Fig. 2).
At the potential of +20 mV, peak and steady level rates of release in the γ–/– cells were about one-third higher than in controls (see legend of Fig. 2). This result would be in line with the conclusion reached by Freise et al. (2000) that elimination of the γ1 subunit may enhance rather than suppress the function of the DHP receptor. The observed difference in release rate at a potential leading to close to full activation may be due to a number of causes, for instance different efficiencies of coupling between DHP and ryanodine receptors or different degrees of loading of the SR. Our hypothesis that the gating characteristics might be altered and release might, therefore, show larger differences at other voltages could not be confirmed. Like the voltage dependence of activation of Ca2+ conductance, the voltage dependence of the Ca2+ signals showed no statistically significant change.
If the γ-subunit modulates SR Ca2+ release, its effect may be more pronounced in the native muscle tissue than in myotubes. In particular, the artificial solutions used for the Ca2+ release determination are of concern. We, therefore, also investigated the force response of isolated adult limb muscles to single stimuli and repetitive stimulation. Here, muscle cells function under more physiological conditions. With the stimulation protocols used, which should cover most of the situations experienced by a muscle during normal activity, no alterations could be noticed in the γ–/– muscles. The mean values of force amplitudes (Table 1) showed small decreases rather than increases (in contrast to the myotube results). The changes were, however, well below our threshold for statistical significance. In previous work, the persistent depression of the force response to low frequency stimulation after repetitive stimulation by short tetani (‘low-frequency fatigue’) has been shown to go along with smaller intracellular Ca2+ signals, indicating a suppression of Ca2+ release from the SR (Westerblad et al. 1993). This type of fatigue might therefore be affected by a structural alteration of the DHP receptor. However, the force-frequency relations after the repetitive tetanic stimulation (that revealed low-frequency fatigue - in particular in EDL) showed no difference between γ+/+ and γ–/– muscle (Fig. 4B).
Thus, on the level of contractile activation of isolated skeletal muscle, there was no evidence for altered Ca2+ release as indicated by the myotube results. Yet we might make a type II error, i.e. accept the null hypothesis of no change despite the presence of changes that are hidden by the signal variances. Therefore, we estimated the probability of avoiding type II errors at different assumed effect sizes by calculating the ‘statistical power’ of the test (see Methods). We expect that the complete elimination of a crucial mechanistic element should produce a clear decrease or increase in functional parameters. At an assumed effect size of 50 % change from the control value, almost all of the contraction data gave statistical power values above 0.8 (for 33 out of 42 investigated parameters we obtained values of 0.9 and higher) showing that a fractional change equal to or above 50 % of the control is unlikely. Exceptions with very low power were the half-time of relaxation (t1/2) of twitch in soleus (Table 1) and twitch force and twitch/tetanus ratio of soleus at T50 %. At a power of 0.8, there was no increase in regular twitch force of larger than 20-30 % in EDL and soleus. Therefore, it appears unlikely that in native muscle fibres the elimination of the γ1 subunit causes a larger effect on peak Ca2+ release than the relatively small increase found in myotubes. Consequently our findings lead us to the conclusion that γ1 plays no crucial role in skeletal muscle activation during E-C coupling. Smaller, more subtle changes, however, cannot be ruled out.
It seems surprising that the elimination of an accessory component exhibiting absolute specificity for a protein that proved to be essential for E-C coupling does not have a more serious impact on this process. Recently, four putative isoforms with relatively low sequence identity to γ1 have been described (Klugbauer et al. 2000). They are predominantly expressed in the brain, but one of these isoforms (γ5) is also found in skeletal muscle. One might, therefore, argue that γ5 could have replaced γ1 in its function. However, heterologous expression using α1C as the indicator subunit showed that γ5 exerts none of the functional effects of γ1 on the ionic current, suggesting that γ5 does not interact with L-type channels. There is no evidence that γ5 can be associated with the skeletal muscle DHP receptor, while all biochemical studies published so far show that γ1 is a tightly associated component.
It is also possible that additional as yet unknown conditions must be met for a function of γ1 on E-C coupling to become more evident. It is for instance known that certain point mutations in the α1S subunit of the DHP receptor cause hypokalaemic periodic paralysis, a disease leading to sporadic muscle failure under conditions of hypokalaemia and an elevated concentration of insulin (reviewed in Lehmann-Horn & Jurkat-Rott, 1999). It may, therefore, be worthwhile to study the effect of other environmental factors, for instance hormonal activation of intracellular second messenger cascades, on the function of γ-deficient skeletal muscle in future experiments. Also, different protocols to enhance fatigue might be tried, perhaps using drugs interfering with ATP replenishment, because a slight increase in fatigue resistance of EDL may be indicated by the data (see legend of Table 2: T30 % but not T50 %). Furthermore, Ca2+ release at long depolarizations that lead to voltage-dependent inactivation may be altered in the γ–/– preparations. This process could be a strategic point in modulating the strength of Ca2+ release in skeletal muscle. Its investigation is experimentally challenging because in isolated muscle cells the Ca2+ release mechanism does not tolerate long depolarizations well. Nevertheless, such studies seem worthwhile because of the reported change of steady-state inactivation of L-type Ca2+ conductance (Freise et al. 2000).
In summary, elimination of the γ1 subunit caused a mild increase of the voltage-activated Ca2+ release in myotubes from adult mice and no alteration in its voltage dependence. In mature muscle, contractile activation induced by a single excitation event or by short sequences of action potentials does not seem to be altered to any appreciable degree in the absence of γ1 in either fast or slow twitch muscle. We conclude that the γ-subunit of the skeletal muscle DHP receptor plays no crucial part in the normal signal transduction leading from the sarcolemmal depolarization to SR Ca2+ release. Further studies are needed to decide whether γ1 plays a modulatory role in skeletal muscle E-C coupling, perhaps leading to stronger functional changes under special conditions.
Acknowledgments
We thank Drs M. Hoth and B. Held for stimulating discussions and we are grateful to Dr F. Lehmann-Horn for support, Dr A. Struk and Mr R. P. Schuhmeier for providing calculation software, and Mrs S. Schäfer and Mr E. Schoch for expert technical help. This work was funded by a grant of the DFG (Me-713/10-2) to W.M.
References
- Baylor SM, Chandler WK, Marshall MW. Sarcoplasmic reticulum calcium release in frog skeletal muscle fibres estimated from Arsenazo III calcium transients. Journal of Physiology. 1983;344:625–666. doi: 10.1113/jphysiol.1983.sp014959. [DOI] [PMC free article] [PubMed] [Google Scholar]
- Baylor SM, Hollingworth S. Model of sarcomeric Ca2+ movements, including ATP Ca2+ binding and diffusion, during activation of frog skeletal muscle. Journal of General Physiology. 1998;112:297–316. doi: 10.1085/jgp.112.3.297. [DOI] [PMC free article] [PubMed] [Google Scholar]
- Beam KG, Knudson CM, Powell JA. A lethal mutation in mice eliminates the slow calcium current in skeletal muscle cells. Nature. 1986;320:168–170. doi: 10.1038/320168a0. [DOI] [PubMed] [Google Scholar]
- Bosse E, Regulla S, Biel M, Ruth P, Meyer HE, Flockerzi V, Hofmann F. The cDNA and deduced amino acid sequence of the gamma subunit of the L-type calcium channel from rabbit skeletal muscle. FEBS Letters. 1990;267:153–156. doi: 10.1016/0014-5793(90)80312-7. [DOI] [PubMed] [Google Scholar]
- Brum G, Rios E, Stefani E. Effects of extracellular calcium on calcium movements of excitation-contraction coupling in frog skeletal muscle fibres. Journal of Physiology. 1988;398:441–473. doi: 10.1113/jphysiol.1988.sp017052. [DOI] [PMC free article] [PubMed] [Google Scholar]
- Dietze B, Bertocchini F, Barone V, Struk A, Sorrentino V, Melzer W. Voltage-controlled Ca2+ release in normal and ryanodine receptor type 3 (RyR3)-deficient mouse myotubes. Journal of Physiology. 1998;513:3–9. doi: 10.1111/j.1469-7793.1998.003by.x. [DOI] [PMC free article] [PubMed] [Google Scholar]
- Dietze B, Henke J, Eichinger HM, Lehmann-Horn F, Melzer W. Malignant hyperthermia mutation Arg615Cys in the porcine ryanodine receptor alters voltage dependence of Ca2+ release. Journal of Physiology. 2000;526:507–514. doi: 10.1111/j.1469-7793.2000.t01-1-00507.x. [DOI] [PMC free article] [PubMed] [Google Scholar]
- Dirksen RT, Beam KG. Role of calcium permeation in dihydropyridine receptor function. Insights into channel gating and excitation-contraction coupling. Journal of General Physiology. 1999;114:393–403. doi: 10.1085/jgp.114.3.393. [DOI] [PMC free article] [PubMed] [Google Scholar]
- Eberst R, Dai S, Klugbauer N, Hofmann F. Identification and functional characterization of a calcium channel γ subunit. Pflügers Archiv. 1997;433:633–637. doi: 10.1007/s004240050324. [DOI] [PubMed] [Google Scholar]
- Freise D, Held B, Wissenbach U, Pfeifer A, Trost C, Himmerkus N, Schweig U, Freichel M, Biel M, Hofmann F, Hoth M, Flockerzi V. Absence of the γ subunit of the skeletal muscle dihydropyridine receptor increases L-type Ca2+ currents and alters channel inactivation properties. Journal of Biological Chemistry. 2000;275:14476–14481. doi: 10.1074/jbc.275.19.14476. [DOI] [PubMed] [Google Scholar]
- Garcia J, Beam KG. Measurement of calcium transients and slow calcium current in myotubes. Journal of General Physiology. 1994;103:107–123. doi: 10.1085/jgp.103.1.107. [DOI] [PMC free article] [PubMed] [Google Scholar]
- Gonzalez A, Rios E. Perchlorate enhances transmission in skeletal muscle excitation-contraction coupling. Journal of General Physiology. 1993;102:373–421. doi: 10.1085/jgp.102.3.373. [DOI] [PMC free article] [PubMed] [Google Scholar]
- Grabner M, Dirksen RT, Suda N, Beam KG. The II-III loop of the skeletal muscle dihydropyridine receptor is responsible for the bi-directional coupling with the ryanodine receptor. Journal of Biological Chemistry. 1999;274:21913–21919. doi: 10.1074/jbc.274.31.21913. [DOI] [PubMed] [Google Scholar]
- Gregg RG, Messing A, Strube C, Beurg M, Moss R, Behan M, Sukhareva M, Haynes S, Powell JA, Coronado R, Powers PA. Absence of the β subunit (cchb1) of the skeletal muscle dihydropyridine receptor alters expression of the α1 subunit and eliminates excitation- contraction coupling. Proceedings of the National Academy of Sciences of the USA. 1996;93:13961–13966. doi: 10.1073/pnas.93.24.13961. [DOI] [PMC free article] [PubMed] [Google Scholar]
- Jay SD, Ellis SB, Mccue AF, Williams ME, Vedvick TS, Harpold MM, Campbell KP. Primary structure of the γ subunit of the DHP-sensitive calcium channel from skeletal muscle. Science. 1990;248:490–492. doi: 10.1126/science.2158672. [DOI] [PubMed] [Google Scholar]
- Klein MG, Simon BJ, Szücs G, Schneider MF. Simultaneous recording of calcium transients in skeletal muscle using high- and low-affinity calcium indicators. Biophysical Journal. 1988;53:971–988. doi: 10.1016/S0006-3495(88)83178-3. [DOI] [PMC free article] [PubMed] [Google Scholar]
- Klugbauer N, Dai S, Specht V, Lacinova L, Marais E, Bohn G, Hofmann F. A family of γ-like calcium channel subunits. FEBS Letters. 2000;470:189–197. doi: 10.1016/s0014-5793(00)01306-5. [DOI] [PubMed] [Google Scholar]
- Lamb GD. DHP receptors and excitation-contraction coupling. Journal of Muscle Research and Cell Motility. 1992;13:394–405. doi: 10.1007/BF01738035. [DOI] [PubMed] [Google Scholar]
- Lännergren J, Westerblad H. Force decline due to fatigue and intracellular acidification in isolated fibres from mouse skeletal muscle. Journal of Physiology. 1991;434:307–322. doi: 10.1113/jphysiol.1991.sp018471. [DOI] [PMC free article] [PubMed] [Google Scholar]
- Lehmann-Horn F, Jurkat-Rott K. Voltage-gated ion channels and hereditary disease. Physiological Reviews. 1999;79:1317–1372. doi: 10.1152/physrev.1999.79.4.1317. [DOI] [PubMed] [Google Scholar]
- Lerche H, Klugbauer N, Lehmann-Horn F, Hofmann F, Melzer W. Expression and functional characterization of the cardiac L-type calcium channel carrying a skeletal muscle DHP-receptor mutation causing hypokalaemic periodic paralysis. Pflügers Archiv. 1996;431:461–463. doi: 10.1007/BF02207287. [DOI] [PubMed] [Google Scholar]
- Melzer W, Dietze B. Acta Physiologica Scandinavica. MELZER; 2001. Malignant hyperthermia and excitation-contraction coupling. in the Press. [DOI] [PubMed] [Google Scholar]
- Powers PA, Liu S, Hogan K, Gregg RG. Molecular characterization of the gene encoding the gamma subunit of the human skeletal muscle 1,4-dihydropyridine-sensitive Ca2+ channel (CACNLG), cDNA sequence, gene structure, and chromosomal location. Journal of Biological Chemistry. 1993;268:9275–9279. [PubMed] [Google Scholar]
- Rios E, Ma JJ, Gonzalez A. The mechanical hypothesis of excitation-contraction (E-C) coupling in skeletal muscle. Journal of Muscle Research and Cell Motility. 1991;12:127–135. doi: 10.1007/BF01774031. [DOI] [PubMed] [Google Scholar]
- Singer D, Biel M, Lotan I, Flockerzi V, Hofmann F, Dascal N. The roles of the subunits in the function of the calcium channel. Science. 1991;253:1553–1557. doi: 10.1126/science.1716787. [DOI] [PubMed] [Google Scholar]
- Sipos I, Pika-Hartlaub U, Hofmann F, Flucher BE, Melzer W. Effects of the dihydropyridine receptor subunits γ and α2δ on the kinetics of heterologously expressed L-type Ca2+ channels. Pflügers Archiv. 2000;439:691–699. doi: 10.1007/s004249900201. [DOI] [PubMed] [Google Scholar]
- Smith PD, Liesegang GW, Berger RL, Czerlinski G, Podolsky RJ. A stopped-flow investigation of calcium ion binding by ethylene glycol bis(β·aminoethyl ether)-N,N'-tetraacetic acid. Analytical Biochemistry. 1984;143:188–195. doi: 10.1016/0003-2697(84)90575-x. [DOI] [PubMed] [Google Scholar]
- Spiecker W, Melzer W, Lüttgau HC. Extracellular Ca2+ and excitation-contraction coupling. Nature. 1979;280:158–160. doi: 10.1038/280158a0. [DOI] [PubMed] [Google Scholar]
- Stephenson DG, Lamb GD, Stephenson GM. Events of the excitation-contraction-relaxation (E-C-R) cycle in fast- and slow-twitch mammalian muscle fibres relevant to muscle fatigue. Acta Physiologica Scandinavica. 1998;162:229–245. doi: 10.1046/j.1365-201X.1998.0304f.x. [DOI] [PubMed] [Google Scholar]
- Strube C, Beurg M, Powers PA, Gregg RG, Coronado R. Reduced Ca2+ current, charge movement, and absence of Ca2+ transients in skeletal muscle deficient in dihydropyridine receptor β1 subunit. Biophysical Journal. 1996;71:2531–2543. doi: 10.1016/S0006-3495(96)79446-8. [DOI] [PMC free article] [PubMed] [Google Scholar]
- Takekura H, Takeshima H, Nishimura S, Takahashi M, Tanabe T, Flockerzi V, Hofmann F, Franzini-Armstrong C. Co-expression in CHO cells of two muscle proteins involved in excitation-contraction coupling. Journal of Muscle Research and Cell Motility. 1995;16:465–480. doi: 10.1007/BF00126431. [DOI] [PubMed] [Google Scholar]
- Walker D, De waard M. Subunit interaction sites in voltage-dependent Ca2+ channels: role in channel function. Trends in Neurosciences. 1998;21:148–154. doi: 10.1016/s0166-2236(97)01200-9. [DOI] [PubMed] [Google Scholar]
- Wei XY, Perez-Reyes E, Lacerda AE, Schuster G, Brown AM, Birnbaumer L. Heterologous regulation of the cardiac Ca2+ channel α1 subunit by skeletal muscle β and γ subunits. Implications for the structure of cardiac L-type Ca2+ channels. Journal of Biological Chemistry. 1991;266:21943–21947. [PubMed] [Google Scholar]
- Westerblad H, Duty S, Allen DG. Intracellular calcium concentration during low-frequency fatigue in isolated single fibers of mouse skeletal muscle. Journal of Applied Physiology. 1993;75:382–388. doi: 10.1152/jappl.1993.75.1.382. [DOI] [PubMed] [Google Scholar]
- Westerblad H, Lee JA, Lännergren J, Allen DG. Cellular mechanisms of fatigue in skeletal muscle. American Journal of Physiology. 1991;261:C195–209. doi: 10.1152/ajpcell.1991.261.2.C195. [DOI] [PubMed] [Google Scholar]
- Wissenbach U, Bosse-Doenecke E, Freise D, Ludwig A, Murakami M, Hofmann F, Flockerzi V. The structure of the murine calcium channel γ-subunit gene and protein. Biological Chemistry. 1998;379:45–50. doi: 10.1515/bchm.1998.379.1.45. [DOI] [PubMed] [Google Scholar]