

Abstract
The present study was undertaken to examine the effects of exercise and carbohydrate (CHO) ingestion on interleukin-6 (IL-6) gene expression in skeletal muscle and plasma IL-6 concentration.
Seven moderately trained men completed 60 min of exercise at a workload corresponding to each individual's lactate threshold on four randomised occasions. Two trials were conducted on a bicycle ergometer (Cyc) and two on a running treadmill (Run) either with (CHO) or without (Con) the ingestion of a CHO beverage throughout the exercise. Muscle biopsies were obtained from the vastus lateralis before and immediately after exercise and IL-6 gene expression in these samples was determined using real-time PCR. In addition, venous blood samples were collected at rest, and after 30 min during and at the cessation of exercise. These samples were analysed for plasma IL-6.
Irrespective of exercise mode or CHO ingestion, exercise resulted in a 21 ± 4-fold increase (P < 0.01; main exercise effect) in IL-6 mRNA expression. In contrast, while the mode of exercise did not affect the exercise-induced increase in plasma IL-6, CHO ingestion blunted (P < 0.01) this response.
These data demonstrate that CHO ingestion attenuates the plasma IL-6 concentration during both cycling and running exercise. However, because IL-6 mRNA expression was unaffected by CHO ingestion, it is likely that the ingestion of CHO during exercise attenuates IL-6 production by tissues other than skeletal muscle.
Higher plasma interleukin-6 (IL-6) concentrations have been reported following running exercise compared with cycling exercise in humans (Nieman et al. 1998; Starkie et al. 2000, 2001). These results indicate that the levels of plasma IL-6 observed following exercise may be related to the mode of exercise employed and hence, the degree to which the exercise induces a disruption to contractile tissue and/or the muscle cytoskeleton.
We have recently reported that circulating monocytes are not the source of the elevated levels of plasma IL-6 observed after prolonged running, a predominantly eccentric exercise mode (Starkie et al. 2001). Muscle damage invokes an inflammatory response (Cannon & St Pierre, 1998) and it is possible that this process stimulates local cytokine production within damaged muscle (Pedersen et al. 1998). In support of this, Ostrowski et al. (1998) observed IL-6 mRNA expression in the skeletal muscle of runners following a marathon. Hence, it is possible that IL-6 produced in skeletal muscle in response to muscle damage is subsequently released into the circulation, contributing to the elevation in plasma IL-6 concentration, as previously hypothesised (Ostrowski et al. 1998). However, it is also possible that factors other than contraction-induced muscle damage may increase IL-6 production. Jonsdottir et al. (2000) recently compared concentric and eccentric exercise in rats and demonstrated that the magnitude of the exercise-induced increase in IL-6 mRNA was similar. Furthermore, Nieman et al. (1998) observed marked increases in plasma IL-6 content during cycling exercise, which is largely concentric in nature. However, IL-6 mRNA expression has not been measured in human skeletal muscle subjected to concentric exercise such as cycling.
It has been reported previously that carbohydrate (CHO) ingestion attenuates elevations in plasma IL-6 during both prolonged running (Nehlsen-Cannarella et al. 1997; Nieman et al. 1998) and cycling (Nieman et al. 1998). In contrast, we have recently observed that plasma IL-6 is unaffected by CHO ingestion during cycling (Starkie et al. 2000). However, in this latter study, the subjects were highly endurance trained and the plasma IL-6 concentration increased to only ∼2 pg ml-1 following 2 h of cycling even without CHO ingestion (Starkie et al. 2000). Such a value was markedly less than that previously observed in moderately trained subjects after cycling exercise (Nieman et al. 1998). To further clarify the effect of CHO ingestion on the plasma IL-6 response to exercise, in the present study we chose to recruit subjects of similar aerobic fitness (peak O2 uptake (V̇02peak), ∼53 ml kg-1 min-1) to those reported previously (Nieman et al. 1998).
Since CHO ingestion has been demonstrated to influence plasma IL-6 concentration during prolonged exercise (Nehlsen-Cannarella et al. 1997; Nieman et al. 1998), and as previous investigations have identified skeletal muscle as a possible source for the exercise-induced increase in IL-6 (Ostrowski et al. 1998; Jonsdottir et al. 2000; Steensberg et al. 2000), it is possible that CHO may alter the plasma IL-6 concentration by affecting production within skeletal muscle.
Hence, the aim of the present study was to investigate the effects of exercise mode and CHO ingestion on IL-6 gene expression in human skeletal muscle. In addition, we examined whether changes in IL-6 gene expression in the muscle were accompanied by similar changes in plasma IL-6. It was hypothesised that running would result in a greater increase in IL-6 gene expression compared with cycling, but that CHO ingestion during exercise would attenuate this increase independent of exercise mode. Furthermore, we postulated that changes in plasma IL-6 concentrations would follow similar patterns to IL-6 gene expression, in that levels would be higher during running than during cycling and CHO ingestion would blunt this increase.
METHODS
Subjects
Seven moderately trained males (age, 31 ± 2 years; mass, 83.2 ± 3.7 kg; V̇02peak, 4.50 ± 0.22 and 4.28 ± 0.24 l min−1 for running and cycling, respectively) gave their written and informed consent prior to volunteering to participate as subjects in this study. The study was approved by the Human Research Ethics Committee of RMIT University, and conformed with the guidelines outlined in the Declaration of Helsinki.
Preliminary testing
All subjects performed two progressive, incremental tests to volitional fatigue, 1 week apart, for the determination of individual lactate threshold (LT) and V̇02peak, as described elsewhere (Baldwin et al. 2000). One test was conducted on a running treadmill (custom-built) and the other on a bicycle ergometer (Lode, Groningen, The Netherlands). During the 24 h period prior to each maximal test subjects refrained from heavy exercise and consumed a prepared food pack consisting of three meals with a total energy of ∼188 kJ (kg body mass (BM))−1; CHO: ∼100 kJ (kg BM)−1; fat: ∼63 kJ (kg BM)−1; protein: ∼25 kJ (kg BM)−1.
Experimental procedures
Subjects completed 60 min of exercise on four randomised occasions, separated by at least 7 days, at a workload or speed corresponding to individual LT in comfortable ambient conditions (20-22 °C, < 50 % humidity). The mean workload was 190 ± 10 W and the mean speed was 13.1 ± 0.6 km h−1 (0 deg grade) for cycling and running, respectively. Two trials were conducted on a cycle ergometer (Cyc) and two on a treadmill (Run) either with (CHO) or without (Con) the ingestion of a CHO beverage throughout the exercise (described below). In an attempt to standardise pre-trial muscle and liver glycogen stores, 48 h prior to an experimental trial, subjects completed a 30 min exercise bout at ∼70 % V̇02peak, at the exercise mode to be subsequently tested. Subjects were then required to consume the standardised diet that was consumed prior to the preliminary testing (see above) for the 24 h period prior to testing. They were also instructed to refrain from heavy exercise during this time.
On the morning of the experimental trials, subjects reported to the laboratory between 07.00 and 08.00 h after a 12-14 h overnight fast. After resting for 10 min, an indwelling catheter (Terumo, Tokyo, Japan) was inserted into a forearm vein, and a resting venous blood sample was taken (Rest). Following blood collection, local anaesthesia (1 % lignocaine (lidocaine)) was administered to the skin, subcutaneous tissue and fascia of the vastus lateralis and two incisions were made ∼5 cm apart (distal to proximal) and ∼2.5 cm apart (medial to lateral). A muscle biopsy (pre-exercise) was then obtained using the percutaneous needle biopsy technique (Bergstrom, 1962) modified to include suction (Evans et al. 1982) from the proximal incision and immediately (< 20 s) frozen in liquid nitrogen. Samples were stored at -80 °C until subsequent analysis. The second incision was used to obtain a biopsy immediately after exercise (post-exercise).
After resting for 10 min, subjects commenced a 5 min warm-up that consisted of either running at 8.0 km h−1 for 150 s and then 9.0 km h−1 for a further 150 s or cycling at 100 W for 150 s followed by 150 s at 125 W. On completion of the warm-up, subjects remained standing on the treadmill or sitting on the cycle ergometer for 10 min while ingesting 8 ml (kg BM)−1 of either a 6.4 % carbohydrate- electrolyte solution (CHO; Lucozade Sport, SmithKline Beecham, UK) or water (Con). An additional 2 ml (kg BM)−1 of the same fluid was consumed by subjects after 20 and 40 min of exercise for a total fluid intake of 12 ml (kg BM−1). On average, subjects ingested 999 ± 45 ml of fluid that resulted in a carbohydrate intake of 64 ± 3 g during the CHO trials. After resting for 10 min, a blood sample was obtained (0 min) and subjects then commenced exercise. Apart from the sample taken at rest, further blood samples were collected after 30 and 60 min of exercise (10 ml) for the subsequent determination of plasma IL-6 and these samples, together with additional samples collected at 0, 10, 20, 40 and 50 min (3 ml), were analysed for plasma glucose.
Analytical techniques
Muscle tissue analyses
Muscle biopsy samples were divided into two pieces. One portion was freeze dried, dissected free from visible blood and connective tissue, extracted and analysed for glycogen using a standard enzymatic technique with fluorometric detection (Passenneau & Lauderdale, 1974). The second portion of muscle was extracted for total RNA using the acid guanidium thiocyanate- phenol-chloroform extraction method (Chomczynski & Sacchi, 1987), modified according to methods described elsewhere (Febbraio & Koukoulas, 2000).
RT-PCR
One microgram of each total RNA sample was reverse transcribed in a 10 μl reaction mixture containing 1 × TaqMan RT buffer (Applied Biosystems, Foster City, CA, USA), 5.5 mm MgCl2, 500 μm of each 2′-deoxynucleoside 5′-triphosphate, 2.5 μm random hexamers, 0.4 U μl−1 RNase inhibitor, 1.25 U μl−1 multiscribe reverse transcriptase (Applied Biosystems) and made up to volume with H2O (0.05 % DEPC treated). Control samples were also analysed, in which all the above reagents were added to RNA samples except the multiscribe reverse transcriptase. The reverse-transcription reactions were performed using a GeneAmp PCR system 9600 (Applied Biosystems) with conditions at 25 °C for 10 min, 48 °C for 30 min and 95 °C for 5 min. Two microlitres of 0.5 m EDTA (pH 8.0) were added to each sample, which were stored at -20 °C until further analysis.
Real-time PCR was employed to quantify human IL-6 gene expression from the cDNA samples. Human IL-6 probe and primers were designed (Primer Express version 1.0, Applied Biosystems) from the human IL-6 gene sequence (GenBank/EMBL accession nos M54894 and M38669). An 81 base-length IL-6 fragment was amplified using the forward primer 5′-GGTACATCCTCGACGGCATCT-3′ and reverse primer 5′-GTGCCTCTTTGCTGCTTTCAC-3′ (Sigma Geno-sys, Castle Hill, NSW, Australia). A TaqMan fluorescent probe 5′-FAM (6-carboxyfluorescein)-TGTTACTCTTGTTACATGTCTCCTTTCTCAGGGCT-3′-TAMRA (6-carboxy-tetramethylrhodamine) (Applied Biosystems) was included with the primers in each reaction. We also amplified ribosomal 18S mRNA as our reference gene, since this gene is known to be constitutively and not inducibly expressed. The TaqMan probes and primers for this gene were supplied in a control reagent kit (Applied Biosystems). We quantified gene expression using a multiplex comparative critical threshold (CT) method (ABI PRISM 7700). A CT value reflects the cycle number at which the DNA amplification is first detected. This method enabled detection of our reference gene (human 18S) and IL-6 in a single tube, in which the primers for 18S were limited to ensure that adequate amounts of reagents were present for amplification of both genes.
It was possible to detect 18S in the same tube as IL-6 because the reporter dyes attached to the TaqMan probes fluoresce at different emission wavelength maxima. In preliminary experiments we determined the relative efficiency of amplification of 18S vs. IL-6. These experiments revealed approximate equal efficiencies of 18S and IL-6 amplifications over different starting template concentrations. We also performed experiments to demonstrate that multiplex vs. non-multiplex experiments had no effect on CT values, as well as primer-limited multiplex 18S vs. non-primer-limited non-multiplex 18S reactions. Finally, we determined the linear dynamic range for starting template concentrations.
PCR reactions were carried out in 25 μl reaction mixtures of TaqMan universal PCR master mix (1 ×; Applied Biosystems), 50 nm TaqMan 18S probe, 20 nm 18S forward primer, 80 nm 18S reverse primer, 100 nm TaqMan IL-6 probe, 900 nm IL-6 forward primer and 300 nm IL-6 reverse primer, made up to volume with RNase-free H2O. The concentrations of the IL-6 probes and primers were chosen based on pilot analyses in which optimal concentrations were determined. Fifty nanograms of cDNA and control preparations not containing RT were amplified using the following conditions: 50 °C for 2 min, 95 °C for 10 min followed by 40 cycles of 95 °C for 15 s and 60 °C for 1 min. For each sample, a ΔCT value was obtained by subtracting 18S CT values from those of IL-6, using the resting value as the control. Resting values for each subject were subtracted from the exercise samples for each subject to derive a Δ - ΔCT value. The expression of human IL-6 was then evaluated by 2-(Δ - ΔCT).
Blood analyses
Blood for plasma glucose analysis was collected into a tube containing EDTA, mixed and spun in a centrifuge at 2200 g for 8 min at 0 °C. The plasma was later analysed for glucose using an automated glucose/lactate analyser (YSI 2300 STAT PLUS, Yellow Springs Instruments, Yellow Springs, OH, USA). Blood samples for plasma IL-6 concentration analysis were drawn into glass tubes containing EDTA. The tubes were spun immediately at 2200 g for 15 min at 4 °C and the plasma was stored at -80 °C until analyses were performed. Enzyme-linked immunosorbent assay (ELISA) kits (R&D Systems, Minneapolis, MN, USA) were used to quantify plasma IL-6, using chemiluminescence.
Statistics
A three-way (time × exercise mode × drink) ANOVA with repeated measures was used to compare data. A Student-Newman-Keuls post hoc test was used to locate differences when ANOVA revealed a significant interaction. Data are expressed as means ± s.e.m.P < 0.05 was considered significant.
RESULTS
Plasma glucose concentrations were similar at rest (∼4.6 mmol l−1) for the four trials. Although the plasma glucose concentration was elevated (P < 0.05) after CHO ingestion to ∼5.4 mmol l−1 at the start of exercise in both CHO ingestion trials, no differences were observed between the four trials prior to exercise (Fig. 1). The plasma glucose concentration peaked after 10 min of exercise during both the running (6.5 ± 0.4 mmol l−1) and cycling (6.6 ± 0.3 mmol l−1) trials when CHO was ingested, such that the values were different (P < 0.05) when the two CHO ingestion trials were compared with the two Con trials. At 20 min of exercise, the plasma glucose concentration was lower (P < 0.05) in Cyc Con than in the other trials. During running, the plasma glucose concentration rose above resting values after 10 and 30 min of exercise with CHO and Con ingestion, respectively, and remained elevated until after 50 min for both treatment conditions (P < 0.05). During cycling, the plasma glucose concentrations were only greater (P < 0.05) than those at rest after 10 and 20 min, when CHO was ingested. Although the plasma glucose concentration remained above 5 mmol l−1 throughout the running trial during CHO ingestion, it gradually declined during cycling such that after 60 min of exercise it was similar to the resting value. During running with Con ingestion, the plasma glucose concentration was higher than that at rest after 30 min and remained elevated for the remainder of the exercise bout (P < 0.05). In contrast, the plasma glucose concentration remained at ∼4.8 mmol l−1 for the duration of the Con cycle trial. Muscle glycogen content was reduced (P < 0.05) after exercise, but there was no mode × treatment interaction (Fig. 2).
Figure 1. Plasma glucose concentrations during 60 min of cycling (Cyc) or running (Run) exercise either with (CHO) or without (Con) the ingestion of a CHO solution during exercise.

Values are means ± s.e.m. (n = 7). *P < 0.05, **P < 0.01, † P < 0.001, Con significantly different from CHO trial.
Figure 2. Muscle glycogen content prior to (Pre) and following (Post) 60 min of cycling (Cyc) or running (Run) exercise either with (CHO) or without (Con) the ingestion of a CHO solution during exercise.
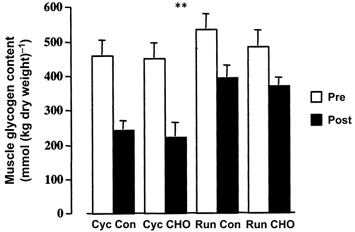
Values are means ± s.e.m. (n = 7). **P < 0.01, main time effect Post different from Pre.
IL-6 gene expression was detected at rest using the real-time PCR technique. However, exercise resulted in a 21 ± 4-fold increase (P < 0.01) in IL-6 mRNA (main effect for time). This increase was not affected by either mode of exercise or CHO ingestion (Fig. 3). The plasma IL-6 concentration was elevated during exercise (P < 0.01), and while the mode of exercise did not significantly influence the plasma concentration (P = 0.26), CHO ingestion resulted in a blunting (P < 0.01) of the plasma cytokine response (Fig. 4).
Figure 3. Change in IL-6 mRNA expression in human skeletal muscle from pre-exercise to post-exercise following 60 min of cycling (Cyc) or running (Run) exercise either with (CHO) or without (Con) the ingestion of a CHO solution during exercise.
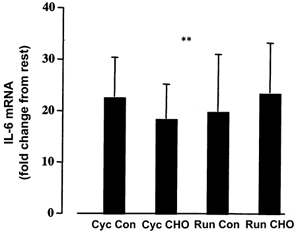
Values are means ± s.e.m. (n = 7). **P < 0.01, main time effect.
Figure 4. Plasma IL-6 concentration prior to (Rest), after 30 min and immediately following 60 min of cycling (Cyc) or running (Run) exercise with (CHO) or without (Con) the ingestion of a CHO solution throughout exercise.
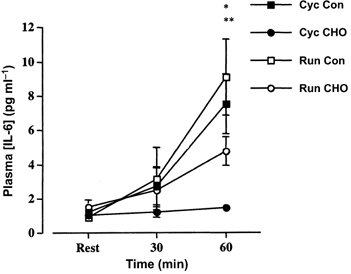
Values are means ± s.e.m. (n = 7). **P < 0.01, main time effect post-exercise different from pre-exercise. *P < 0.01, time × drink interaction.
DISCUSSION
The results from the present study are the first to demonstrate that the IL-6 gene is expressed in resting human skeletal muscle and that expression of this gene is markedly increased after only 60 min of moderate intensity exercise. It is of note that neither CHO ingestion nor the mode of exercise affected IL-6 mRNA. In contrast, the blunting of the plasma IL-6 response with CHO ingestion suggests that either IL-6 production and subsequent release from skeletal muscle was attenuated and/or that IL-6 production from tissues other than skeletal muscle was reduced.
To our knowledge, only in one previous study (Ostrowski et al. 1998) has IL-6 mRNA been measured in human skeletal muscle in vivo. In contrast with our present data, those investigators were unable to detect IL-6 mRNA in resting skeletal muscle. In addition, IL-6 mRNA could only be detected in five of eight human skeletal muscle biopsies after 197 ± 7 min of exercise. In contrast, in the present study subjects exercised for only 60 min and gene expression was markedly elevated in all samples. This disparity in gene expression between the two studies may be due to differences in the methodologies employed. The present study used real-time PCR, which measures PCR product when cDNA amplification is first detected by fluorescence, not after a fixed number of PCR cycles. Hence, this method is believed to be more sensitive than conventional or comparative PCR, as that performed by Ostrowski et al. (1998), because PCR precision is highest at early cycles.
In the present study we did not include a control group of subjects who underwent the muscle biopsy procedures but did not undertake exercise. It could be argued that the biopsy procedure and not the exercise caused the increase in IL-6 gene expression that we observed. Based on previous findings this is most unlikely. Malm et al. (2000) recently performed an experiment in which biopsies were obtained from the vastus lateralis in an exercise and control group for up to 7 days, following an exercise or rest period. In one control subject, a change in IL-6 protein was only detected after 7 days during which time seven biopsies were obtained. In the current study, although only two muscle biopsies were obtained from each subject, we detected an approximate 20-fold increase in IL-6 mRNA in muscle subjected to 60 min of exercise. In addition, in the only other study in which IL-6 mRNA was measured in human muscle after exercise, IL-6 mRNA was detected in four subjects immediately after a marathon run. However, IL-6 mRNA could only be detected in one of these four subjects 2 h following the run (Ostrowski et al. 1998). This indicates that exercise itself results in an acute increase in IL-6 mRNA, irrespective of the trauma of muscle biopsy.
It has recently been suggested (Jonsdottir et al. 2000) that ribosomal RNA may not be a good control for contraction-induced changes in gene expression. In the present study, we were able to determine this by comparing the CT values from pre-exercise samples with those from post-exercise samples for 18S. We found no differences, despite the large reduction in CT when pre-exercise and post-exercise samples were compared for IL-6. Hence, in our study, the increase in IL-6 gene expression cannot be attributed to a decrease in 18S mRNA.
While the data from the present study clearly demonstrate that IL-6 gene expression is increased by muscle contraction, two questions remain. Firstly, what is the mechanism by which contraction increases IL-6 gene transcription? Secondly, since RNA was extracted from muscle biopsies, which specific cell(s) within the muscle is(are) the source(s) of this increase? Contrary to the hypothesis of Ostrowski et al. (1998), data from the present study suggest that IL-6 gene expression is not related to the extent of muscle damage. The rise in gene expression was almost identical, when running was compared with cycling (Fig. 3). While we have no measure of the extent of muscle damage, it is unlikely that 60 min of concentric exercise, such as cycling, would result in muscle damage in the vastus lateralis. Therefore, our data argue against muscle damage being the mechanism responsible for the increase in IL-6 gene expression. This notion is supported by recent studies in both rats (Jonsdottir et al. 2000) and humans (Steensberg et al. 2000), in which increases in skeletal muscle IL-6 mRNA and release (respectively) during and following concentric muscle contraction were observed. In addition, although it has been hypothesised recently that IL-6 production may be related to glycogen depletion (Steensberg et al. 2000), this is unlikely to be the cause of the increase in IL-6 gene expression in the present study because glycogen content after exercise remained > 200 mmol (kg dry weight)−1 in all trials. Hence some factor associated with contraction per se, other than muscle damage and intramuscular glycogen availability, must be responsible for the increase in IL-6 gene expression.
Cells within the skeletal muscle that are capable of producing IL-6 include fibroblasts (Walther et al. 1988), endothelial cells (Jirik et al. 1989) and resident monocytes/macrophages (Bagby et al. 1996). Infiltrating monocytes and neutrophils are also possible sources of IL-6, but these cells enter the muscle some time after exercise (Smith et al. 1991) and therefore, it is unlikely that infiltrating leucocytes would account for the increase in IL-6 mRNA expression. Human myoblasts have been demonstrated to produce IL-6 in vitro (Galluci et al. 1998; De Rossi et al. 2000), providing another possible source of the increase in IL-6 mRNA within the muscle. Whether or not muscle fibres themselves are capable of producing IL-6 has not been determined experimentally.
Although the exercise-induced increase in plasma IL-6 was not significantly affected by exercise mode in the present study, it was attenuated by CHO ingestion independent of the type of exercise. These data are in agreement with those of Nieman et al. (1998) but in contrast with our own previous work (Starkie et al. 2000), even though the relative workload in these two previous reports and the current study was comparable. As previously discussed, the subjects in the present study were of similar fitness to those of the study of Nieman et al. (1998), but were considerably less well trained than those in our earlier study (Starkie et al. 2000). It is possible, therefore, that the plasma IL-6 concentration may be related to the degree of metabolic stress associated with the relative workload of the exercise bout. Of note, CHO ingestion did not affect muscle IL-6 gene expression, suggesting that CHO ingestion is not regulating plasma IL-6 concentration via its influence over skeletal muscle IL-6 production. Our present results demonstrate a dissociation between contracting muscle IL-6 gene expression and plasma IL-6 concentration, and our previous studies (Starkie et al. 2000, 2001) demonstrated that circulating monocytes were not the source of the increase in plasma IL-6. Hence, we are still left with the question as to why CHO ingestion blunts the plasma IL-6 response.
It has recently been demonstrated that IL-6 release from contracting human skeletal muscle can solely account for the exercise-induced increases in plasma IL-6 (Steensberg et al. 2000). The data from the present study appear to refute this previous observation. There are two possible reasons for the conflict between the present and previous (Steensberg et al. 2000) study. Firstly, it is possible that although CHO ingestion did not alter IL-6 gene expression, it may have affected IL-6 release from the contracting muscle. Since we did not measure arterio-venous differences we can neither confirm nor deny this possibility. However, it is important to note that the intramuscular glycogen content was not different in CHO and water ingestion trials following exercise. As discussed, in the previous study Steensberg et al. (2000) hypothesised that IL-6 release from skeletal muscle was related to the CHO availability within those muscles. Based on this hypothesis, it is unlikely that IL-6 release from the contracting muscles in the present study would have differed because the intramuscular CHO stores were similar when comparing trials. It is also noteworthy that, on comparing that previous study, which involved single-legged knee extensor exercise (Steensberg et al. 2000), with the present, which involved running or cycling, the protocols were vastly different. This difference in protocol may have affected rates of IL-6 clearance from the plasma.
It is possible that CHO may have blunted IL-6 production in hepatic tissues. Administration of IL-6 to rats results in an increase in blood glucose and a decrease in hepatic glycogen content (Stith & Luo, 1994). In addition, intravenous administration of IL-6 to human subjects results in an increase in blood glucose levels (Tsigos et al. 1997). Furthermore, IL-6 has been demonstrated to act directly on hepatocytes to increase hepatic glucose release (Ritchie et al. 1990), demonstrating that IL-6 does not mediate blood glucose concentration simply through its effect on glucoregulatory hormones. Taken collectively, these results indicate that IL-6 plays additional roles in liver function other than stimulating production of acute phase proteins. Interestingly, the liver has been identified as a potential source of IL-6 in rats (Liao et al. 1995a, b). In addition, infusion of endotoxin into human subjects results in a substantial increase in hepatic venous IL-6 levels (Fong et al. 1990). These data demonstrate that the liver is capable of producing IL-6, and that IL-6 plays a regulatory role by increasing liver glucose release in order to elevate blood glucose. In addition, it is well known that either CHO ingestion (McConnell et al. 1994; Jeukendrup et al. 1999) or infusion (Howlett et al. 1998) during exercise suppresses hepatic glucose production. These previous data suggest that if blood glucose levels are compromised, such as during exercise, the liver may produce IL-6 to stimulate its own glucose output. Conversely, if glucose is supplied exogenously, as was the case with the present study, hepatic IL-6 production may be downregulated as the demand for endogenous glucose is decreased.
In conclusion, the results from the present study suggest that while CHO ingestion attenuates the exercise-induced increase in plasma IL-6, it does not act via a decrease in contracting muscle IL-6 production. In addition, IL-6 mRNA is constitutively expressed in human skeletal muscle and while it is highly inducible by exercise, the mode of exercise or CHO ingestion does not affect expression. This suggests that factors other than the degree of exercise-induced muscle damage regulate IL-6 production in contracting human muscle.
Acknowledgments
We would like to acknowledge the technical assistance of Clinton Bruce, Vasilis Nikolopoulos, Heidi Staudacher, Nigel Stepto and Dr Louise Burke, and the medical assistance of Dr Andrew Garnham. In addition, we thank the subjects for their excellent co-operation. This study was supported, in part, by a research grant from SmithKline Beecham Consumer Healthcare, UK.
References
- Bagby GJ, Crouch LD, Shephard RE. Exercise and cytokines: Spontaneous and elicited responses. In: Hoffman-Goetz L, editor. Exercise and Immune Function. New York: CRC Press; 1996. pp. 55–78. [Google Scholar]
- Baldwin J, Snow RJ, Febbraio MA. Effect of training status and relative exercise intensity on physiological responses in men. Medicine and Science in Sports and Exercise. 2000;32:1648–1654. doi: 10.1097/00005768-200009000-00020. [DOI] [PubMed] [Google Scholar]
- Bergstrom J. Muscle electrolytes in man. Scandinavian Journal of Laboratory Investigations. 1962;68(suppl.):1–110. [Google Scholar]
- Cannon JG, St pierre BA. Cytokines in exertion-induced skeletal muscle injury. Molecular and Cellular Biochemistry. 1998;179:159–167. doi: 10.1023/a:1006828425418. [DOI] [PubMed] [Google Scholar]
- Chomczynski P, Sacchi N. Single-step method of RNA isolation by acid guanidium thiocyanate-phenol-chloroform extraction. Analytical Biochemistry. 1987;162:156–159. doi: 10.1006/abio.1987.9999. [DOI] [PubMed] [Google Scholar]
- De Rossi M, Bernasconi P, Baggi F, De walle malefyt R. Cytokines and chemokines are both expressed by human myoblasts: possible relevance for the immune pathogenesis of muscle inflammation. International Immunology. 2000;12:1329–1335. doi: 10.1093/intimm/12.9.1329. [DOI] [PubMed] [Google Scholar]
- Evans WJ, Phinney SD, Young VR. Suction applied to muscle biopsy maximizes sample size. Medicine and Science in Sports and Exercise. 1982;14:101–102. [PubMed] [Google Scholar]
- Febbraio MA, Koukoulas I. HSP72 gene expression progressively increases in human skeletal muscle during prolonged, exhaustive exercise. Journal of Applied Physiology. 2000;89:1055–1060. doi: 10.1152/jappl.2000.89.3.1055. [DOI] [PubMed] [Google Scholar]
- Fong Y, Marano MA, Moldawer LL, Wei H, Calvano SE, Kenney JS, Allison AC, Cerami A, Shires GT, Lowry SF. The acute splanchnic and peripheral tissue metabolic response to endotoxin in humans. Journal of Clinical Investigation. 1990;85:1896–1904. doi: 10.1172/JCI114651. [DOI] [PMC free article] [PubMed] [Google Scholar]
- Gallucci S, Provenzano C, Mazzarelli P, Scuderi F, Bartoccioni E. Myoblasts produce IL-6 in response to inflammatory stimuli. International Immunology. 1998;10:267–273. doi: 10.1093/intimm/10.3.267. [DOI] [PubMed] [Google Scholar]
- Howlett K, Angus DJ, Proietto J, Hargreaves M. Effect of increased blood glucose availability on glucose kinetics during exercise. Journal of Applied Physiology. 1998;84:1413–1417. doi: 10.1152/jappl.1998.84.4.1413. [DOI] [PubMed] [Google Scholar]
- Jeukendrup AE, Wagenmakers AJM, Stegen JH, Gijsen AP, Brouns F, Saris WHM. Carbohydrate ingestion can completely suppress endogenous glucose production during exercise. American Journal of Physiology. 1999;276:E672–683. doi: 10.1152/ajpendo.1999.276.4.E672. [DOI] [PubMed] [Google Scholar]
- Jirik FR, Podor TJ, Hirano T, Kishimoto T, Loskutoff DJ, Carson DA, Lotz M. Bacterial lipopolysaccharide and inflammatory mediators augment IL-6 secretion by human endothelial cells. Journal of Physiology. 1989;142:144–147. [PubMed] [Google Scholar]
- Jonsdottir IH, Schjerling P, Ostrowski K, Asp S, Richter EA, Pedersen BK. Muscle contractions induce interleukin-6 mRNA production in rat skeletal muscles. Journal of Physiology. 2000;528:157–163. doi: 10.1111/j.1469-7793.2000.00157.x. [DOI] [PMC free article] [PubMed] [Google Scholar]
- Liao J, Keiser JA, Scales WE, Kunkel SL, Kluger MJ. Role of corticosterone in TNF and IL-6 production in isolated perfused rat liver. American Journal of Physiology. 1995a;268:R699–706. doi: 10.1152/ajpregu.1995.268.3.R699. [DOI] [PubMed] [Google Scholar]
- Liao J, Keiser JA, Scales WE, Kunkel SL, Kluger MJ. Role of epinephrine in TNF and IL-6 production in isolated perfused rat liver. American Journal of Physiology. 1995b;268:R896–901. doi: 10.1152/ajpregu.1995.268.4.R896. [DOI] [PubMed] [Google Scholar]
- McConnell GK, Fabris S, Proietto J, Hargreaves M. Effect of carbohydrate ingestion on glucose kinetics during exercise. Journal of Applied Physiology. 1994;77:1537–1541. doi: 10.1152/jappl.1994.77.3.1537. [DOI] [PubMed] [Google Scholar]
- Nehlsen-Cannarella SL, Fagoaga OR, Nieman DC, Henson DA, Butterworth DE, Schmitt RL, Bailey EM, Warren BJ, Utter A, Davis JM. Carbohydrate and the cytokine response to 2. 5 h of running. Journal of Applied Physiology. 1997;82:1662–1667. doi: 10.1152/jappl.1997.82.5.1662. [DOI] [PubMed] [Google Scholar]
- Nieman DC, Nehlsen-Cannarella SL, Fagoaga OR, Henson DA, Utter A, Mark davis J, Williams F, Butterworth DE. Influence of mode and carbohydrate on the cytokine response to heavy exertion. Medicine and Science in Sports and Exercise. 1998;30:671–678. doi: 10.1097/00005768-199805000-00005. [DOI] [PubMed] [Google Scholar]
- Ostrowski K, Rhode T, Zacho M, Asp S, Pedersen BK. Evidence that interleukin-6 is produced in human skeletal muscle during prolonged running. Journal of Physiology. 1998;508:949–953. doi: 10.1111/j.1469-7793.1998.949bp.x. [DOI] [PMC free article] [PubMed] [Google Scholar]
- Passoneau JV, Lauderdale VR. A comparison of three methods of glycogen measurement in tissues. Analytical Biochemistry. 1974;60:405–412. doi: 10.1016/0003-2697(74)90248-6. [DOI] [PubMed] [Google Scholar]
- Pedersen BK, Ostrowski K, Rohde T, Bruunsgaard H. The cytokine response to strenuous exercise. Canadian Journal of Physiology and Pharmacology. 1998;76:505–511. doi: 10.1139/cjpp-76-5-505. [DOI] [PubMed] [Google Scholar]
- Ritchie DG. Interleukin 6 stimulates hepatic glucose release from prelabeled glycogen pools. American Journal of Physiology. 1990;258:E57–64. doi: 10.1152/ajpendo.1990.258.1.E57. [DOI] [PubMed] [Google Scholar]
- Smith LL. Acute inflammation: the underlying mechanism in delayed onset muscle soreness. Medicine and Science in Sports and Exercise. 1991;23:542–551. [PubMed] [Google Scholar]
- Starkie RL, Angus DJ, Rolland J, Hargreaves M, Febbraio MA. Effect of prolonged, submaximal exercise and carbohydrate ingestion on monocyte intracellular cytokine production in humans. Journal of Physiology. 2000;528:647–655. doi: 10.1111/j.1469-7793.2000.t01-1-00647.x. [DOI] [PMC free article] [PubMed] [Google Scholar]
- Starkie RL, Rolland J, Angus DJ, Anderson MJ, Febbraio MA. Circulating monocytes are not the source of elevations in plasma IL-6 and TNF-α levels after prolonged running. American Journal of Physiology - Cell Physiology. 2001;280:C769–774. doi: 10.1152/ajpcell.2001.280.4.C769. [DOI] [PubMed] [Google Scholar]
- Steensberg A, Van Hall G, Osada T, Sacchetti M, Saltin B, Pedersen BK. Production of interleukin-6 in contracting human skeletal muscles can account for the exercise-induced increase in plasma interleukin-6. Journal of Physiology. 2000;529:237–242. doi: 10.1111/j.1469-7793.2000.00237.x. [DOI] [PMC free article] [PubMed] [Google Scholar]
- Stith RD, Luo J. Endocrine and carbohydrate responses to interleukin-6 in vivo. Circulatory Shock. 1994;44:210–215. [PubMed] [Google Scholar]
- Tsigos C, Papanicolaou DA, Kyrou I, Defensor R, Mitsiadis CS, Chrousos GP. Dose-dependent effects of recombinant human interleukin-6 on glucose regulation. Journal of Clinical Endocrinology and Metabolism. 1997;82:4167–4170. doi: 10.1210/jcem.82.12.4422. [DOI] [PubMed] [Google Scholar]
- Walther Z, May LT, Sehgal PB. Transcriptional regulation of the interferon-β2/B cell differentiation factor BSF-2/hepatocyte-stimulating factor gene in human fibroblasts by other cytokines. Journal of Immunology. 1988;140:974–977. [PubMed] [Google Scholar]