

Abstract
Electrical stimulation of the infraorbital nerve was used to examine the coupling between neuronal activity and cerebral blood flow (CBF) in rat somatosensory cortex by laser Doppler flowmetry and extracellular recordings of field potentials.
The relationship between field potential (FP) and CBF amplitudes was examined as a function of the stimulus intensity (0–2.0 mA) at fixed frequency (3 Hz). FP amplitudes up to 2.0–2.5 mV were unaccompanied by increases of CBF. Above this threshold, CBF and FP amplitudes increased proportionally.
At fixed stimulus intensity of 1.5 mA, CBF increases were highly correlated to FP amplitudes at low frequencies of stimulation (< 2 Hz), but uncoupling was observed at stimulation frequencies of 2–5 Hz. The evoked responses were independent of stimulus duration (8–32 s).
The first rise in CBF occurred within the first 0.2 s after onset of stimulation in the upper 0–250 μm of the cortex. Latencies were longer (1.0–1.2 s) in lower cortical layers in which CBF and FP amplitudes were larger.
Local AMPA receptor blockade attenuated CBF and FP amplitudes proportionally.
This study showed that activity-dependent increases in neuronal activity and CBF were linearly coupled under defined conditions, but neuronal activity was well developed before CBF started to increase. Consequently, the absence of a rise in CBF does not exclude the presence of significant neuronal activity. The CBF increase in upper cortical layers preceded the rise in lower layers suggesting that vessels close to or at the brain surface are the first to react to neuronal activity. The activity-dependent rise in CBF was explained by postsynaptic activity in glutamatergic neurons.
Laser Doppler flowmetry (LDF) provides continuous monitoring of cerebral blood flow (CBF) with a time resolution of a few milliseconds that makes it possible to correlate neuronal synaptic and spike activity on a real-time basis with CBF. This may be relevant for the studies devoted to functional imaging of brain activity using CBF as a marker since there is a shortage of knowledge concerning the type of nerve cell activity that generates activity-dependent increases of CBF (Villringer & Dirnagl, 1995; Raichle, 1998). In two recently published papers concerning functional increases in CBF in the cerebellar cortex we found a strong correlation between the maximal amplitudes of the recorded field potentials (FP) and maximal increases in CBF (Mathiesen et al. 1998, 2000). Furthermore simple mathematical modelling of the electrophysiological data documented the existence of temporal coupling between activity in cerebellar nerve cells and local increases in CBF, but increased spike activity was not a condition for evoking a CBF increase (Mathiesen et al. 1998, 2000).
The present study examined the coupling and uncoupling of neuronal activity and CBF in the rat somatosensory system. FP and CBF amplitudes were correlated using different stimulus intensities and frequencies in response to stimulation of the infraorbital nerve that carries the afferent input from the whisker area (Woolsey et al. 1996). The hypothesis tested was that significant increases in neuronal activity were accompanied by corresponding increases in CBF. Secondly, we carried out laminar analysis of CBF changes in the cortex employing the laser Doppler technique (Fabricius et al. 1997). This enabled us to record changes of CBF in four cortical layers at the same time and to identify the timing of the CBF rise in relation to the start of electrical stimulation. We reasoned that if the activity-dependent increase of CBF started corresponding to the maximal synaptic input in layer IV then it should be possible to detect this with our instrument. This would support the view that neuronal activity in deeper cortical layers via local vascular mechanisms initiates the increase in CBF. If on the other hand the CBF increase started in other layers then the sequence of events that leads from increased neuronal activity to increased CBF would need to be revised. The measurements were supplemented by appropriate pharmacological studies to document the local, neuronal origin of the vascular signals.
METHODS
Animal preparation
Twenty-five male Wistar rats (300–350 g, Panum Institute, Copenhagen) were anaesthetised with halothane (Vapor, Dräger; 4 % at induction and 1.5 % during surgery) in 30 % O2–70 % N2O. Lidocaine (lignocaine; 5 mg ml−1s.c.) was used at the operation sites and at the contact spots for ear pins. Catheters were inserted in the femoral artery for recording arterial blood pressure, and in the femoral vein. Rats were tracheotomised and artificially ventilated to maintain arterial pH at 7.35–7.40, arterial partial pressure of CO2 (Pa,CO2) at approximately 39 mmHg and arterial partial pressure of O2 (Pa,O2) at approximately 100 mmHg (measured by ABL 715, Radiometer, Denmark). The head was placed in a stereotactic headholder. Cranial bones were removed over the sensory cortex (-1 to −5 mm posterior to bregma and 4–8 mm lateral to the midline) with a dental drill during continuous saline superfusion. A pool of 5 % agar in Ringer solution was made around the craniotomy for continuous superfusion with aerated (95 % air-5 % CO2) artificial cerebrospinal fluid (aCSF) at 37 °C (composition, mm: 120 NaCl, 2.8 KCl, 22 NaHCO3, 1.45 CaCl2, 1.0 Na2HPO4 and 0.876 MgCl2). The dura was carefully removed over the sensory cortex. The temperature of the animal was monitored with a rectal thermometer and kept at 37 °C by a heating pad (custom made). If animals suffered damage to the cortex during surgery they were immediately killed with an i.v. injection of air and excluded from the study.
After surgery the anaesthesia was changed to α-chloralose (1,2-O-[2,2,2-trichloro-ethylidene]-α-d-gluco-furanose), which was dissolved in saline (10 mg ml−1) and heated to 69 °C. The filtered α-chloralose was introduced i.v. as a bolus of 45 mg kg−1. Halothane and N2O was discontinued and another 15 mg kg−1 bolus was given. During the rest of the experiment 15–20 mg kg−1 was given every 20 min. The level of anaesthesia was checked continuously by observing arterial blood pressure during stimulation, and by tail pinch.
α-Chloralose is the anaesthetic of choice for brain activation studies due to minimal cardiovascular effects and preserved neuronal and vascular responses to sensory stimulation (Ngai et al. 1988; Lindauer et al. 1993; Bonvento et al. 1994). At the end of the experiment, rats were killed by an i.v. injection of air. The National Animal Ethics Committee approved all surgical and anaesthetic procedures.
Stimulation
Contralateral to the craniotomy, the ramus infraorbitalis of the trigeminal nerve was stimulated by a set of custom-made bipolar electrodes inserted percutaneously. The cathode was positioned corresponding to the hiatus infraorbitalis and the anode was inserted into the masticatory muscles. The infraorbital nerve was stimulated using constant current (ISO-flex, A.M.P.I., Israel) with 1 ms long pulses controlled by a trigger (Master 8, A.M.P.I). Current and frequency varied as described below.
Laser Doppler flowmetry
The CBF was continuously monitored by a laser Doppler flowmeter using a probe positioned 0.3–0.5 mm above the pial surface avoiding large pial vessels, as described elsewhere (Fabricius et al. 1997). The sampling depth of LDF varies as a function of the distance between the transmitting and the recording fibre (fibre separation) and of the wavelength of the laser light. We used a four-channel LDF probe (PF 415:49, Perimed AB, Jarfjalla, Sweden) holding four combinations of wavelength and fibre separation: green laser light (543 nm), fibre separation 140 μm (LDFGreen); near-infrared laser light (780 nm), fibre separations 140 μm, 250 μm and 500 μm (LDFRed(140), LDFRed(250) and LDFRed(500), respectively). The four channels of the probe were connected to two laser Doppler flowmeters (Periflux, 4001 Master, Perimed AB). The time constant was 0.2 s and the signal-processing unit used a bandwidth of 20 Hz to 12 kHz (Nilsson, 1980). The light of the recording fibre for the green laser was filtered to remove the near-infrared light and vice versa. The maximal measurement depth of the four channels in vivo has been estimated as 250 μm, 500 μm, 1000 μm and 2000 μm for LDFGreen, LDFRed(140), LDFRed(250) and LDFRed(500), respectively (Fabricius et al. 1997). The four-channel laser Doppler probe was calibrated with a motility standard and positioned corresponding to the whisker area over the somatosensory cortex avoiding the largest vessels (Chapin & Lin, 1984). After stable baseline recordings had been obtained, the probe was left for the duration of the experiment. For each channel the relative changes of CBF were calculated using the algorithm described previously (Fabricius et al. 1997). CBF changes were calculated relative to baseline, defined as the average flow for 3 s before stimulation. All CBF changes presented in text and figures represent averaged data that were transformed according to Fabricius et al. (1997). The magnitude of the CBF response was calculated as the average relative increase starting at 2 s after onset of stimulation and lasting until stimulation was stopped.
Field potential measurements
Field potentials were recorded from the cerebral cortex by single-barrel glass electrodes (pulled from capillary tubes; 1.8 mm, o.d.; 1.2 mm, i.d.; Modulohm, Denmark) filled with 2 m NaCl. The tip diameter was approximately 2 μm and the electrode impedance varied between 2 and 3 MΩ. The reference electrode consisted of a low-impedance Ag–AgCl wire resting in the neck muscles. FPs were amplified 500 times and filtered at a bandwidth of 1–2400 Hz (CyberAmp 380, Axon Instruments, Foster City, CA, USA). Neuronal signals were continuously displayed on a digital storage oscilloscope (Pintek, digital storage oscilloscope, DS-203, Taiwan). The microelectrode was lowered into the cortex using a motor-controlled micromanipulator in steps of 2 μm (custom made). The microelectrode was positioned in the somatosensory cortex corresponding to the barrel cortex at co-ordinates −3 mm posterior to bregma and −6 mm lateral to the midline at a maximal distance of 200 μm from the LDF probe (Chapin & Lin, 1984). The primary excitatory response in this study had a negative onset as it was recorded below the brain surface. The FP amplitude was measured from baseline to maximal negative peak. We evaluated that this amplitude was the most reproducible variable of neuronal activity within and between experiments. FP amplitudes were averaged for each stimulation period.
All recordings were taken after a stable baseline was obtained. On-line and off-line analysis was performed using the Spike 2 program with a 1401 plus interface (Cambridge Electronic Design, Cambridge, UK). The digital sampling rate was 10 kHz for the neuronal signals, 10 Hz for the CBF trace and 100 Hz for the blood pressure.
Experimental protocol
First, we obtained a depth profile of the FP amplitudes in response to infraorbital nerve stimulation in four animals. The purpose of this part of the study was to define the cortical depths at which the FP amplitude, and by inference neuronal activity, was maximal. The electrode was initially lowered to a depth of 2000 μm. Subsequently, the electrode was withdrawn at time intervals of 10–20 s to the following depths in micrometres: 1500, 1200, 1000, 800, 700, 600, 500, 400, 300, 200, 100, 0. At each depth the infraorbital nerve was stimulated for 50 s at 1 Hz and 2.5 mA. The largest FP amplitudes were observed at a depth of 600–800 μm. Therefore in the following experiments the electrode was positioned at this depth.
Second, we determined the optimal stimulation intensity with respect to FP and CBF amplitudes in 10 rats. In a pilot study using a stimulation frequency of 1 Hz we found that high stimulation intensities sometimes evoked cortical spreading depression that has profound and long-lasting effects on cortical function (Lauritzen, 1994). Therefore we carried out this protocol using a stimulation frequency of 3 Hz that increased CBF at lower stimulus intensities. The stimulation strength was increased from 0 to 2 mA in steps of 0.1 mA, using a frequency of 3 Hz and stimulus duration of 16 s. Data from these experiments were used to examine the relation between FP amplitudes and CBF, i.e. the activity-flow coupling.
Third, we examined the duration dependency of the CBF and FP responses by extending the period of stimulation from 8 to 16 or 32 s in random sequence using a stimulation frequency of 1 Hz and a stimulus intensity of 1.5 mA in six rats. The purpose of this part of the study was to examine whether the amplitude of the CBF response increased as a function of time as in the cerebellar cortex. Stimulus trains started every 30 s for 8 and 16 s stimulations, and every 60 s when stimulating for 32 s. CBF responses measured by LDF have been reported to vary between successive stimulations (Detre et al. 1998). Therefore, we decided to improve the signal-to-noise ratio by averaging CBF and FP data for 10 stimulation periods. Averaging of CBF and FP responses was also used in the following protocol in which we examined the influence of variations in the stimulus frequency on the responses, and in the protocol in which we examined the time course of development of CBF changes in different cortical layers.
Fourth, we examined the frequency characteristics of the FP and CBF responses in six rats. Stimulus duration was 8 s, intensity was 1.5 mA and stimulus frequencies were 0.25, 0.5, 1, 2, 3 and 5 Hz. Stimulations were repeated 10 times for each frequency with 30 s intervals between stimulus trains. Responses were averaged as described above. CBF and FP responses were similar whether moving from lower to higher frequencies or vice versa. FP amplitudes were calculated for each stimulation frequency. In addition we multiplied the amplitude with the number of stimulations to obtain the summed field potential (SFP). The relationship between FP and CBF, and SFP and CBF was examined by correlation analysis using data from the LDFRed(250).
Fifth, we carried out laminar analysis of CBF changes in real time. The purpose of this part of the study was to define the cortical depth at which CBF started and where it was maximal. The time latency was calculated from onset of stimulation to a significant CBF increase had been obtained for each LDF channel. This was defined as a CBF increase of more than two standard deviations from baseline. CBF amplitudes were calculated as described above. Data from the frequency protocol were used for this analysis.
Sixth, we examined the effect of blockade of glutamate receptors on the CBF and FP responses. The purpose of this part of the study was to verify that the vascular responses were of neuronal origin and to examine the types of glutamate receptors involved in mediating the responses. We stimulated at 1 Hz for 8 s, with intervals of 30 s. Averages of only five stimulation periods were used in this protocol because of the transient effect of one of the drugs (GYKI, see below). CBF responses recorded with the LDFRed(250) were used for this part of the study.
Drugs
Drug effects were evaluated as follows. The AMPA receptor antagonist 1-(4-aminophenyl)-4-methyl-7,8-methylene-dioxy-5H-2,3-benzodiazepine (GYKI 52466, Sigma) was dissolved in a concentration of 10 mg kg−1 (maximum, 2.5 mg ml−1), heated to 39 °C and slowly applied i.v. after control recordings had been obtained. The inhibitory effect of GYKI was calculated at 3–5 min after application when the effect was maximal. The effect of GYKI was fully reversed after 20 min (n = 6 rats). The AMPA receptor antagonist 6-cyano-7-nitroquinoxaline-2,3-dione (CNQX, Research Biochemicals International) was dissolved in aCSF and applied topically at a concentration of 500 μm. The effect of CNQX was calculated at 10–15 min after application. The drug was washed out for the following 50 min and measurements were repeated (n = 6 rats). The selective and non-competitive NMDA receptor antagonist (5R,10S)-(5-methyl-10,11-dihydro-5H-dibenzo[a,d]cyclohepten-5,10-imine/dizocilpine (MK801, Sigma) was dissolved in saline and applied topically at a concentration of 10 μm. The effect of MK801 was tested at 50 min after application (n = 6 rats). In four rats MK801 (10 μm and 1 mm) was applied for 40 min, directly followed by topical application of CNQX (500 μm) for 35 min, and the combined effect was evaluated. Solutions were ultrasonicated when necessary. Drugs for topical application were dissolved in aCSF and kept at 37 °C while bubbling with 95 % air–5 % CO2, and pH was 7.30–7.40.
Statistics
Results from drug experiments with GYKI, CNQX and MK801 were compared by Student's paired t tests. One-way analysis of variance (ANOVA) was used to compare blood pressure, CBF and FP responses in the protocols related to stimulus frequency and duration. Increases in CBF and FP as a function of stimulus intensity, and the correlation between CBF and FP were tested using sigmoidal curve fitting (Boltzmann equation). All tests were performed using the program Origin 5.0 (Microcal, USA). Values were considered statistically significant at P < 0.05. Values in the text and figures are means ±s.e.m.; n indicates the number of rats.
RESULTS
Depth profile
Stimulation of the infraorbital nerve evoked extracellular FPs in the rat somatosensory cortex as shown in Fig. 1. In all layers the excitatory input was detected as the initial negative peak. FP amplitudes were minimal at the surface, maximal and constant at depths between 100 and 800 μm, and declining below 800 μm. The laminar analysis of the distribution of FP amplitudes revealed a monophasic response in upper layers consisting of a negativity with a latency time of 8 ms. The responses in deeper layers were biphasic with an initial small negativity and a longer-lasting positive peak. Amplitudes were in the millivolt range. The maximal FP amplitudes between 100 and 700 μm correspond to the cell layers that receive the somatosensory input from the thalamus (Woolsey & Van der Loos, 1970; Simons, 1978; Armstrong-James et al. 1992).
Figure 1. Depth profile of field potential amplitudes.
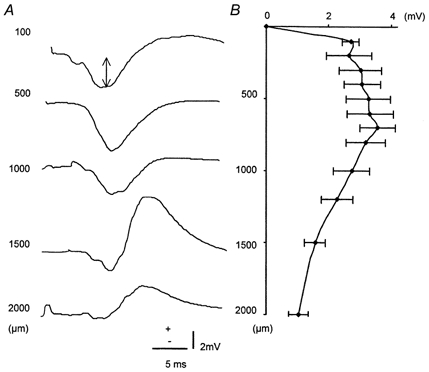
A, original records of extracellular field potentials (FP) in response to electrical stimulation of the infraorbital nerve. The arrow indicates the FP amplitude. B, laminar distribution of FP amplitudes at cortical depths from the surface of brain (0 μm) to a depth of 2000 μm (n = 4).
Stimulation intensity
The dynamic range of coupling between CBF and FP was examined using different stimulation intensities. Blood pressure was not affected by increasing the stimulation strength (data not shown). Figure 2A shows CBF plotted as a function of the stimulus intensity. CBF changes were not observed at stimulus intensities below 0.5 mA. Stimulation intensities from 0.5 to 1.2 mA gave a steady increase in CBF that remained constant and maximal at 32 % for stimulus intensities between 1.2 and 2 mA. FP amplitudes also increased as a function of the stimulus intensity (Fig. 2B). A stimulus intensity of 0.2 mA was necessary to evoke a cortical response that increased linearly in amplitude up to a stimulation intensity of approximately 1.0 mA. Above this stimulation intensity FP amplitudes remained constant. Figure 2C shows maximal changes in CBF plotted against FP amplitudes. This graph gives information about the coupling between neuronal activity and CBF. The figure shows that for a range of FP amplitudes, i.e. below 2.0–2.5 mV, CBF remained unchanged. This suggests the existence of a CBF threshold in relation to neuronal activity. Thus, considerable neuronal activity may occur over a relatively large brain region without a concomitant rise in CBF. Second the figure shows a proportional rise in CBF within a range of FP amplitudes. At the maximal high FP amplitudes there appeared to be a ceiling for CBF. Thus, the experiments demonstrated a threshold for CBF increases, and coupling between neuronal activity and CBF in the somatosensory cortex within a well-defined dynamic range.
Figure 2. Coupling between field potentials and cerebral blood flow as a function of variations in stimulus intensity.
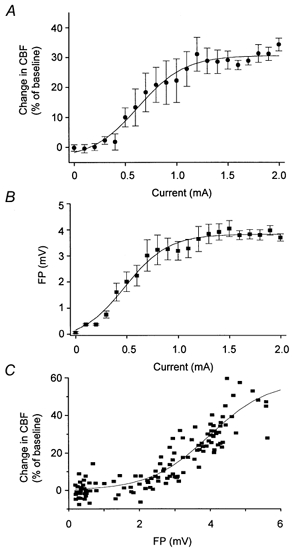
Extracellular field potential amplitudes (FP) and changes in cerebral blood flow (CBF) in response to variations in stimulus intensity. A, mean CBF changes at an approximate depth of 500–1000 μm plotted against stimulation intensity (n = 10). B, mean FP amplitudes (depth 600–800 μm) plotted against stimulus intensity (n = 10). C, CBF increases plotted against FP amplitudes (158 measurements). FP amplitudes up to approximately 2 mV did not result in changes in CBF. CBF increased proportionally at FP amplitudes between 2 and 6 mV. The smooth curves represent sigmoidal curve fitting.
Frequency and stability analysis
Analogous with the study of stimulus intensity we examined the influence of frequency dependency on the FP and CBF amplitudes. Figure 3 shows original data from a single animal with concomitant recordings of CBF and FP amplitudes. The vertical lines above each recording represent the amplitudes of the FPs. At stimulus frequencies of 0.25 and 0.5 Hz the amplitude of the FPs remained constant while the mean amplitudes decreased in proportion to the stimulus frequency above this level. This was not due to general impairment of cortical function since the first FP amplitude was constant at all times. At 1 Hz and above, FP amplitudes became smaller, and stimulation at 5 Hz caused half of the FPs to drop out as reported by others (Matsuura et al. 1999). The decline of FP amplitudes may be explained by a long recovery time for cortical nerve cells due to the long-lasting inhibitory postsynaptic potential following the initial excitation, and the intrinsic membrane properties of the activated cells (Creutzfeldt, 1995). The data illustrate that fine-tuning of the stimulus frequency is necessary to ensure that stimulation in the periphery is matched by cortical activity. At the applied stimulus intensity (1.5 mA) single stimuli (0.25 and 0.5 Hz) evoked reproducible, transient increases of CBF. At 1 Hz, CBF remained elevated throughout the stimulation period while at 2 Hz the response became somewhat irregular, and at 3 and 5 Hz the CBF response tended to decrease as a function of time. Figure 4 summarises the data for all animals. Figure 4A illustrates the decline of the mean amplitude of the averaged FP as a function of stimulus frequency. In contrast, the summed field potential (ΣFP) increased throughout the frequency range (Fig. 4B) while CBF responses increased up to a frequency about 2 Hz and decreased at higher frequencies (Fig. 4C). Figure 4D shows maximal changes in CBF plotted versusΣFP. CBF correlated linearly with ΣFP up to 40 mV × Hz, which corresponded to a stimulation frequency of 2 Hz. This suggested coupling of neuronal activity and blood flow at stimulation frequencies below 2 Hz. Uncoupling was evident above this stimulation frequency. The data illustrate the strength of the summation approach in experimental protocols that include variations in stimulus frequencies.
Figure 3. Original recordings of field potentials and cerebral blood flow in response to different frequencies of stimulation.
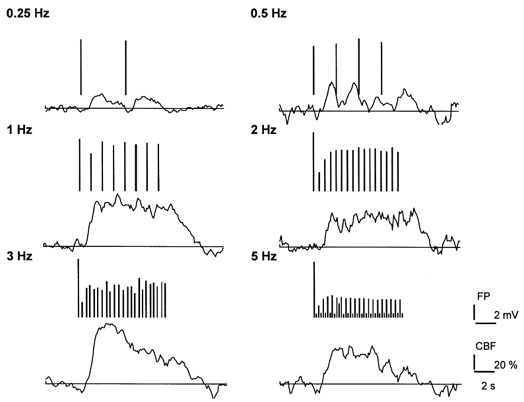
Extracellular field potentials (FP) and cerebral blood flow (CBF) in response to variations in stimulus frequency, at a stimulus duration of 8 s, and an intensity of 1.5 mA. The figure shows transformed original records of CBF and FP responses at 6 different frequencies. CBF was measured at an approximate depth of 500–1000 μm and FP at a depth of 700 μm. FP amplitudes are represented by the length of vertical lines above CBF traces that are plotted for each frequency.
Figure 4. Coupling between field potential amplitudes and changes in cerebral blood flow in response to different frequencies.
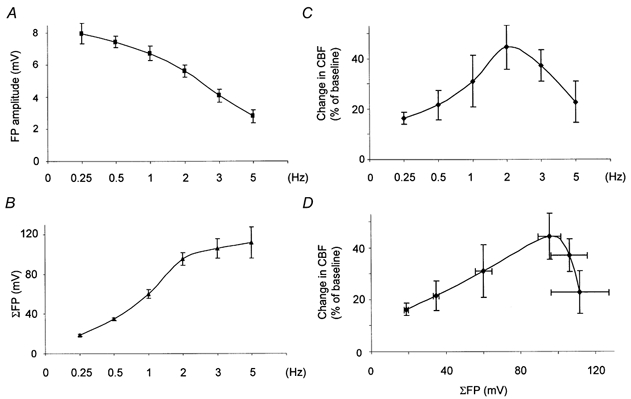
Relationship between cerebral blood flow (CBF), the averaged field potential (FP amplitude) and the summed field potential amplitude (ΣFP) (n = 6). A, the mean FP declined as a function of stimulus frequency. B, the summed field potential, i.e. FP amplitude times the number of stimulations increased despite the decrease in the mean FP. C, CBF increased as a function of frequency up to 2 Hz, and decreased above this level. D, neuronal activity as indicated by ΣFP correlated linearly with CBF up to a value of ΣFP that corresponded to a stimulation frequency of 2 Hz. Above this level ΣFP and CBF were uncoupled.
The influence of stimulus duration was tested in separate experiments in which CBF and FP responses were examined for durations of 8, 16 and 32 s. FP and CBF responses remained constant for the three stimulation periods. There were also no significant differences between CBF responses recorded at four depths as a function of stimulus duration (data not shown). This suggested that the duration of stimulation is not as important in determining the magnitude of the CBF response in the somatosensory cortex as stimulus frequency and stimulation strength.
Laminar analysis
Combining the high temporal resolution of the LDF method with laminar analysis gave us a unique opportunity to evaluate CBF changes in four different cortical layers at the same time. Figure 5A shows the original records obtained in one rat. The time latency of vascular changes in the four layers was calculated as the delay from onset of stimulation until a significant rise in CBF was observed. The results showed that the time delay was 0.2 ± 0.2 s for the upper 0–250 μm, significantly shorter than the time latencies of 1-2 s in the other three cortical layers (P < 0.05) (Fig. 5B and C). The latency time was independent of the stimulus frequency up to 5 Hz (Fig. 5D). The CBF increase started in the superficial cortical layers in every single experiment while the latency time in the three deeper layers varied, albeit not significantly, as a function of frequency. This suggested that activity-dependent increases of CBF in rat somatosensory cortex were initiated in superficial cortical layers and not in layer IV. The magnitude of the CBF increase was smaller (9–11 %) in the superficial layer than in the three deeper layers (40–70 %) (P < 0.05). Figure 6 shows the variations in the laminar distribution of CBF as a function of stimulus frequency. The CBF increase tended to increase as a function of stimulus frequency in the upper 250 μm of the cortex (P < 0.05). For the remaining three layers we observed an optimal frequency of 2 Hz and a trend towards maximal CBF increase at a depth of 250–500 μm.
Figure 5. Laminar analysis of timing and magnitude of increases in cerebral blood flow in relation to stimulus onset.
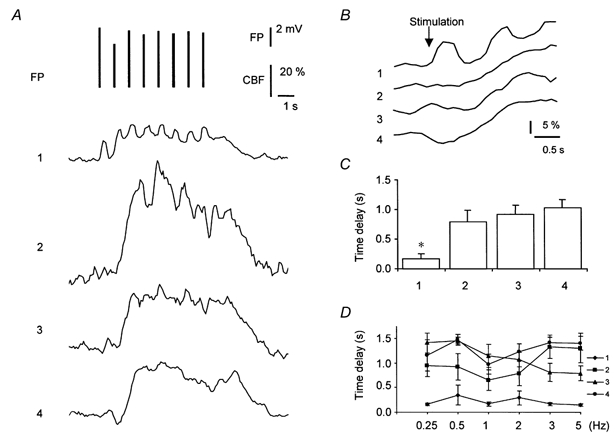
A, transformed original data showing changes in cerebral blood flow (CBF) and field potential amplitude (FP) evoked by electrical simulation for 8 s at 1 Hz and 1.5 mA. Upper panel shows FP amplitudes represented by the length of the vertical line. Lower 4 panels show the CBF responses corresponding to depths of 0–250 μm (1), 250–500 μm (2), 500–1000 μm (3) and 1000–2000 μm (4). First and last FP mark start and end of stimulation, respectively. CBF responses to single stimuli were evident in the upper 0–250 μm of the cortex. B, CBF increases in the 4 layers on an extended time scale showing that the CBF rise started in the upper 250 μm of the cortex. Latencies were 0.2, 1.0, 1.1 and 1.7 s in layers 1-4, respectively. This pattern was found in every single animal. C, mean latency of onset of CBF rise at four cortical depths for all animals (n = 6). The latency was significantly shorter at 0–250 μm (*P < 0.05) than for the 3 lower layers. D, mean latency of onset of CBF rise as a function of stimulation frequency. The CBF increase always started in the uppermost cortical layers independently of stimulation frequency (n = 6).
Figure 6. Laminar analysis of the amplitude of CBF responses as a function of stimulus frequency.

Measurement depths of the four channels in the laser Doppler probe were 0–250 μm (1), 250–500 μm (2), 500–1000 μm (3) and 1000–2000 μm (4). The CBF responses were studied at stimulus frequencies from 0.25 to 5 Hz. The maximal CBF increase corresponded to a depth of 250–500 μm. The response was smallest at a depth of 0–250 μm - the layer in which the CBF increase started. The CBF differences between cortical layers were consistent at different stimulation frequencies. The optimal stimulation frequency was between 1 and 3 Hz (n = 6).
Glutamate receptor blockade
The neuronal origin of the CBF responses was verified using glutamate receptor blockade. None of the drugs affected the arterial blood pressure (data not shown). Figure 7 shows the mean results for all animals with a line through the origin with a slope of −1 to identify identical reductions of FP and CBF amplitudes. Intravenous infusion of GYKI resulted in significant and transient decreases in CBF and FP (P < 0.001). The reduction in CBF (71 %) was significantly higher than the reduction in FP (33 %) (P < 0.0001). Similar differences in the degree of reduction between CBF and FP were observed for topical application of MK801 (P < 0.0001). In contrast, CNQX decreased CBF and FP amplitudes proportionally, as did MK801 and CNQX when applied together. The decrease in CBF and FP amplitudes was more pronounced for the two substances combined than for either substance given alone (P < 0.0001) (Fig. 7). This suggests that full activity of both AMPA and NMDA receptors are necessary to obtain the full FP and CBF responses. The corresponding decreases of CBF and FP amplitudes in response to locally applied CNQX and CNQX + MK801 suggested that the mechanisms by which these substances or combinations of substances decrease CBF involved decreased neuronal activity. The intravenous AMPA receptor antagonist GYKI and topically applied MK801 decreased the activity-dependent increases in CBF more than 50 %. However, this decrease was only associated with a less than 40 % activity-dependent increase in FP amplitudes. Therefore, the mechanisms by which these substances decreased CBF were probably independent of neuronal activity. The data stress the importance of recording FP amplitudes in studies of neurovascular coupling.
Figure 7. Inhibition of field potential and CBF responses by AMPA or NMDA receptor blockade.
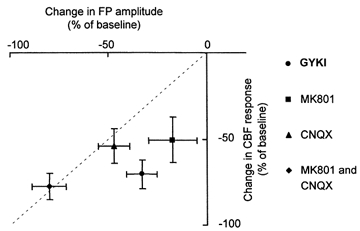
Effect of glutamate receptor blockade on cerebral blood flow (CBF), field potential (FP) responses and neurovascular coupling. Ordinate indicates inhibition of CBF response while abscissa indicates inhibition of FP responses. Dashed line has slope of −1. Data points indicate maximal inhibition of CBF and FP amplitudes. CNQX (n = 6) and CNQX + MK801 (n = 4) produced proportional decreases of FP and CBF amplitudes. MK801 (n = 6) given alone, and GYKI (n = 6), a reversible and transient AMPA receptor antagonist, attenuated the CBF increases without a corresponding decrease of FP amplitude.
DISCUSSION
This study analysed the relationship between neuronal activity and CBF in the rat somatosensory cerebral cortex. The data suggested that a certain amount of neuronal activity is required for CBF to increase, and that it is impossible to exclude the presence of significant neuronal activity in regions that do not increase CBF during stimulation. Second, the data suggested a linear coupling between CBF and neuronal activity within a limited dynamic range of stimulation intensities and frequencies. Third, real-time laminar analysis of CBF revealed that the CBF increase started close to or at the cortical surface while the increase was most pronounced in deeper layers corresponding to the cortical layers that receive the thalamic sensory inputs. The proportional attenuation of the electrophysiological and vascular signals by topically applied AMPA receptor antagonists confirmed the postsynaptic origin of the observed changes of function.
Coupling between neuronal activity and cerebral blood flow
Whisker stimulation is commonly used to evoke activity-dependent increases in CBF in rat somatosensory cortex due to the well-known functional anatomy of this system (Woolsey & Van der Loos, 1970). A large number of studies have examined possible mediators of the coupling between neuronal activity and CBF, but only a few studies have examined the relationship between the CBF findings and neuronal activity directly. We stimulated the infraorbital nerve that carries the afferent input from the whisker area (Jacquin et al. 1989). The primary purpose of this approach was to obtain clear electrical responses that could be used to examine the conditions under which neuronal activity and CBF were coupled. Somatosensory-evoked potentials (SEPs) with a characteristic biphasic positive/negative profile when recorded at the cortical surface and in the most superficial cortical layers (Di et al. 1990; Creutzfeldt, 1995). Monopolar negative potentials are commonly recorded in cortical layer I–II, and negative potentials followed by a very slow positive component were recorded in layers II–IV (Di et al. 1990). The profile of the FPs that we recorded was consistent with previous studies. The second purpose was to use the stimulus onset as a time lock to average the electrophysiological and vascular responses to increase the signal-to-noise ratio.
CBF and FP amplitudes were dependent on stimulus intensity and frequency, but not on stimulus duration. Both CBF and FP amplitudes increased as a function of stimulus intensity, but the courses were different (Fig. 2C). CBF remained constant for FP amplitudes up to approximately 2.0 mV, while a proportional increase of CBF and FP amplitudes was observed above this level. This indicates a threshold for neuronal activity to increase CBF. This is the first study to describe quantitatively a threshold for an activity-dependent increase of CBF. One implication of this finding is that it is not possible to exclude the presence of neuronal activity in areas of the brain that have constant CBF during activation tasks. The absent CBF responses at low stimulation intensities were not explained by low sensitivity of LDF, or that the signal-to-noise ratio was unfavourable. The detection limits for the LDF as indicated by the lowest linear velocity that is detectable by this equipment are 0.016 and 0.011 mm s−1 for green and red light, respectively (Nielsen et al. 2000). The normal red blood cell velocities in cerebral microvessels range from 0.5 up to 1.8 mm s−1 under extreme conditions (Hudetz et al. 1996). Furthermore, in vitro studies have documented that our LDF equipment correlates linearly with flow changes detected electromagnetically at velocities of red blood cells from 0 to 2 mm s−1. This correlation also applies to the 4-channel probe holding the four combinations of wavelength and fibre separation (Barfod et al. 1997; Fabricius et al. 1997). Third, in vivo validation of LDF using isotope techniques has confirmed the high sensitivity of LDF at very low flow rates (Dirnagl, 1989). In the present context we judged baseline noise to be more important for the sensitivity of the instrument. Therefore, we used averaging to increase the signal-to-noise ratio. The baseline variation after averaging was approximately 5 % calculated as 2 ×s.d. of the averaged baseline. Thus, only CBF changes larger than 5 % were reported. CBF increases below this level may be of very limited physiological importance.
The LDF probe samples data from a larger volume than the microelectrode. However, our electrical recordings documented that the evoked neuronal activity could be detected in the X–Y plane up to a distance of 200 μm from the LDF probe. The neuronal activity in the Z plane is given by the laminar depth profile shown in Fig. 1B. Therefore, the lack of a CBF response at low stimulation intensities was not due to the absence of neuronal activity in a much smaller volume than the sampling volume of the LDF, i.e. a partial volume problem. In the correlation analysis we compared electrical signals from the layer with maximal synaptic activity and CBF responses recorded from the same cortical depth. These were judged to be the most relevant variables to compare in the context of functional coupling.
By having a fixed stimulus intensity and varying the frequencies, we used ΣFP), i.e. the FP amplitude times the stimulation frequency times the stimulus duration, as an indicator of neuronal activity. ΣFP is a better representation of the on-going neuronal activity than mean FP amplitudes under conditions of stimulus frequency variation. The summation takes into account the accumulated influence of nerve cell activity on CBF, and the variations of the electrophysiological responses (Mathiesen et al. 1998, 2000; Ngai et al. 1999). CBF correlated linearly with ΣFP at stimulation frequencies below 2 Hz. This indicates the stimulus frequency interval within which (at the current stimulus intensity) a coupling could be demonstrated between nerve cell activity and CBF. SEPs have been recorded together with CBF, or other variables related to blood flow, in other studies of brain activation for various purposes. Some of the studies used electrodes positioned on the brain surface to examine the spatial distribution of neuronal and vascular responses, i.e. spatial coupling (Ngai et al. 1988; Narayan et al. 1994, 1995). In other studies SEPs were recorded to document the presence of neuronal activity and the effect of intervention by drugs on the neuronal responses (Leniger-Follert & Hossmann, 1979; Ngai et al. 1995; Lindauer et al. 1996; Ances et al. 2000). In a recent study SEPs were evoked by sciatic nerve stimulation, summed over the entire stimulation period and correlated to CBF amplitudes. The data showed a linear correlation between summed SEPs and CBF, but not between averaged field potentials and CBF (Ngai et al. 1999), i.e. similar to the findings presented here. We propose that correlation analysis of ΣFP versus CBF be used to demonstrate neurovascular coupling in studies that use variations in stimulus frequency to examine this relation.
While the previous studies used electrodes placed on the brain surface to record SEPs, we used microelectrodes to record FPs within the cortex. The advantage of the microelectrode technique is the larger sensitivity due to the closer proximity of the electrode to the source of the electrical signal. This might explain why we were able to detect neuronal activity before CBF increased, which was unnoticed in the previous studies. Stimulus duration did not affect CBF or FP amplitudes. This observation is consistent with previous studies of vascular responses evoked by mechanical whisker stimulation (Lindauer et al. 1993; Moskalenko et al. 1996; Gerrits et al. 1998; Ichimi et al. 1999; Niwa et al. 2000). In contrast, direct stimulation of local neuronal circuits in the cerebellar cortex increased CBF continuously for up to 300 s of stimulation (Mathiesen et al. 2000). Similar findings were published previously for direct cortical stimulation of the rat somatosensory cortex (Leniger-Follert & Lubbers, 1977). This raises the possibility that CBF responses evoked by activation of local neuronal circuits have time constants that are longer than those evoked by somatosensory stimulation.
Laminar analysis of CBF increases in somatosensory cortex
Studies using laminar field potential analysis have shown that whisker stimulation evokes activity first in the supragranular layer and later in the infragranular layer (Di et al. 1990). In contrast, single unit recordings have indicated that activity in layer IV precedes activity in superficial layers by 3–4 ms (Armstrong-James et al. 1992). Thus, the time sequence of activation remains to be settled. The time base of the neuronal and vascular events differs, however, by a factor of 100, the vascular response being much slower than the neuronal. In the present context, the small differences in timing of activation in superficial and deep layers were judged to be irrelevant for the timing of onset of CBF increases in the four cortical layers.
CBF increased within 0.2 s in the upper 0–250 μm of the cortex independently of the stimulation frequency. The rapid onset of changes in the superficial layers is consistent with optical imaging technique studies that showed a change of signal within the first 500 ms of visual stimulation (Grinvald et al. 1986; Narayan et al. 1994, 1995; Dowling et al. 1996). A similar rapid onset of the cerebrovascular response was reported in one study using LDF that examined changes of CBF in rat somatosensory cortex in response to stimulation of the hind paw (Matsuura et al. 1999). Our findings may be relevant in view of a recent study that used a combination of optical imaging and spectroscopy, and LDF (Malonek et al. 1997). The study showed a delayed onset of the CBF response by 1 s with respect to the intrinsic optical signal at 1.5 s after the start of stimulation (Malonek et al. 1997). The laser Doppler probe employed in that study used a wavelength of 780 nm and a fibre separation of 250 μm. This is similar to the LDFRed(250) used in this study that measured CBF corresponding to a cortical depth of 500–1000 μm with a latency time of 1–2 s. Our results using the green laser light suggested that the CBF response close to or at the brain surface had a similar time latency to the intrinsic optical signal. Consequently, the early rise in deoxyhaemoglobin that accompanies the start of activation may not be explained as the result of a lagging CBF response (Malonek et al. 1997). It could be speculated that the laser Doppler flowmeter using green laser light measured volume changes, not flow, due to a higher sensitivity to volume changes compared with red light. The flow signals obtained were not analysed separately for flow, velocity and volume changes. We cannot therefore exclude the possibility that volume changes contributed to the signal, but the recording system is only sensitive to moving blood cells. Thus, volume changes alone cannot explain the rapid increase of CBF in the upper cortical layers.
The CBF increases were much smaller in the upper 0–250 μm than in deeper cortical layers. This is consistent with results using mechanical whisker stimulation and the hydrogen clearance method (Moskalenko et al. 1996, 1998), and a recent study using autoradiographic techniques (Gerrits et al. 2000). The vascularity of the cortex may influence the flow signal as the highest capillary density is found in layer IV, corresponding to the maximal synaptic input (Patel, 1983). Penetrating arterioles branch into smaller vessels as a function of depth, and flow in these vessels determines the signal recorded by LDF. Previous studies have shown that hypercapnia and cortical spreading depression evoked flow changes in the cortex with clear laminar differences - the CBF increase being smallest in the superficial layers (Fabricius et al. 1997). In contrast, stimulation of the cerebellar parallel fibers evoked changes of CBF that were maximal at the cortical surface (Akgoren et al. 1996). The laminar distribution of CBF increases evoked by stimulation of the infraorbital nerve was not explained by a limited capacity for a flow increase in the upper cortical layers since higher flow rates were observed in these layer using other types of stimulation (Fabricius et al. 1997).
The overall magnitudes of the CBF responses evoked by electrical stimulation of the infraorbital nerve were approximately 2 times larger than commonly reported for mechanical stimulation of the whiskers (Lindauer et al. 1993; Moskalenko et al. 1998; Gerrits et al. 1998). This may be explained by more intense stimulation of the somatosensory cortex in response to the synchronous afferent volley of impulses evoked by electrical stimulation. This type of electrical stimulation also resulted in a reversal of the CBF response at frequencies higher than 2 Hz. This reversal of CBF was observed in several other studies using various types of stimulation (Leniger-Follert & Hossmann, 1979; Moskalenko et al. 1996; Matsuura et al. 1999; Ichimi et al. 1999; Ngai et al. 1999). The decline of the CBF response at high stimulus rates is not surprising since stimuli applied in rapid succession may be inefficient if they coincide with the refractory period of the target cells (Mathiesen et al. 1998). On the other hand, mechanical stimulation of the whiskers up to a frequency of 10 Hz have been reported to increase CBF monotonously (Gerrits et al. 1998). Probably the difference in the two types of stimulation - mechanical versus electrical - explains the difference in CBF responses as a function of the stimulus frequency.
The substances that mediate the fast CBF increase were not examined in the present study but may involve vasodilator substances from nerve cells (e.g. NO, potassium, CGRP, prostanoids) that by diffusion in the extracellular space reach the blood vessels (Cholet et al. 1997; Edvinsson et al. 1998; Lindauer et al. 1999; Greenberg et al. 1999; Yang et al. 1999; Niwa et al. 2000). Our own experiments in the cerebellar cortex suggest, however, that 0.2 s is not a long enough time for potassium to reach a concentration that is physiologically relevant (Caesar et al. 1999). It is possible that the fast upstream vasodilatation is produced by mechanisms intrinsic to the vessel wall (Iadecola et al. 1997). Downstream vasodilatation leading to capillary filling might trigger a flow-mediated release of vasoactive substances from endothelial cells that increase blood flow velocity in feeding vessels upstream (Segal et al. 1989). However, our data do not support such a hypothesis since we would then expect CBF to increase first in deeper layers, which it did not. Alternatively, the initial CBF rise may be mediated via neurogenic vasodilatation, i.e. stimulation of intrinsic cortical nerve cells that innervate intracortical and pial arterioles directly and release vasodilatory substances when stimulated by thalamocortical fibres. This view has support from anatomical studies that have documented direct innervation of cortical blood vessels from intracortical nerve cells (Zhang et al. 1991; Edvinsson et al. 1998). Further studies are needed to address these issues.
Glutamate receptor activity in relation to CBF increases
Glutamate receptor antagonists attenuated the CBF and FP amplitudes by about 90 %. This is consistent with a central role for glutamate in the transmission of sensory impulses in central pathways and the involvement of AMPA and NMDA receptors (Salt, 1986; Block et al. 1993; Armstrong-James et al. 1993). Topical application of the selective AMPA-receptor antagonist CNQX attenuated the CBF and FP responses proportionally. This suggests that postsynaptic glutamatergic mechanisms accounted for both electrophysiological and vascular responses. CBF decreased more than FP amplitudes in animals treated with an injection of the AMPA receptor antagonist GYKI or the NMDA receptor antagonist MK801 applied topically. This suggests that the main effects of these two substances are exerted at a level that is independent of local neuronal activity, downstream along the pathway that leads from increased nerve cell activity to increased CBF. CBF and FP responses were attenuated more in response to local application of MK801 and CNQX at the same time than for either substance given alone, and the attenuation of the vascular and electrophysiological responses were the same. This suggests that full activity of both AMPA and NMDA receptors are needed to obtain the full CBF and FP responses.
Conclusion
In conclusion, significant nerve cell activity may exist over a wide cortical region without concomitant increases of CBF. Consequently, the absence of a CBF increase cannot be used to exclude the presence of nerve cell activity in activated brain regions. The CBF increase during functional activation starts close to or at the brain surface, not at the level of maximal synaptic input. This suggests a rapid communication pathway between cortical layer IV and the pial arterioles. Finally, our data indicated that activity-dependent increases in CBF evoked by somatosensory stimulation depended on activity in postsynaptic cellular elements. We suggest that appropriate recordings of electrophysiological and vascular changes should be carried out to examine neurovascular coupling, since the dynamic range of stimulus intensities and frequencies within which coupling can be demonstrated is limited.
Acknowledgments
This study was supported by NeuroScience PharmaBiotech, The Danish Medical Research Council, The Carlsberg Foundation, The Brødrene Hartmanns foundation, and the NOVO-Nordisk Foundation. The expert technical assistance of Ms Lillian Grøndahl is gratefully acknowledged.
References
- Akgoren N, Dalgaard P, Lauritzen M. Cerebral blood flow increases evoked by electrical stimulation of rat cerebellar cortex: relation to excitatory synaptic activity and nitric oxide synthesis. Brain Research. 1996;710:204–214. doi: 10.1016/0006-8993(95)01354-7. [DOI] [PubMed] [Google Scholar]
- Ances BM, Greenberg JH, Detre JA. Effects of variations in interstimulus interval on activation-flow coupling response and somatosensory evoked potentials with forepaw stimulation in the rat. Journal of Cerebral Blood Flow and Metabolism. 2000;20:290–297. doi: 10.1097/00004647-200002000-00010. [DOI] [PubMed] [Google Scholar]
- Armstrong-James M, Fox K, Das-Gupta A. Flow of excitation within rat barrel cortex on striking a single vibrissa. Journal of Neurophysiology. 1992;68:1345–1358. doi: 10.1152/jn.1992.68.4.1345. [DOI] [PubMed] [Google Scholar]
- Armstrong-James M, Welker E, Callahan CA. The contribution of NMDA and non-NMDA receptors to fast and slow transmission of sensory information in the rat SI barrel cortex. Journal of Neuroscience. 1993;13:2149–2160. doi: 10.1523/JNEUROSCI.13-05-02149.1993. [DOI] [PMC free article] [PubMed] [Google Scholar]
- Barfod C, Akgoren N, Fabricius M, Dirnagl U, Lauritzen M. Laser Doppler measurements of concentration and velocity of moving blood cells in rat cerebral circulation. Acta Physiologica Scandinavica. 1997;160:123–132. doi: 10.1046/j.1365-201X.1997.00130.x. [DOI] [PubMed] [Google Scholar]
- Block F, Schwarz M, Sontag KH. Non-NMDA-mediated transmission of somatosensory-evoked potentials in the rat thalamus. Brain Research Bulletin. 1993;31:449–454. doi: 10.1016/0361-9230(93)90108-n. [DOI] [PubMed] [Google Scholar]
- Bonvento G, Charbonne R, Correze JL, Borredon J, Seylaz J, Lacombe P. Is α-chloralose plus halothane induction a suitable anesthetic regimen for cerebrovascular research. Brain Research. 1994;665:213–221. doi: 10.1016/0006-8993(94)91340-4. [DOI] [PubMed] [Google Scholar]
- Chapin JK, Lin CS. Mapping the body representation in the SI cortex of anesthetized and awake rats. Journal of Comparative Neurology. 1984;229:199–213. doi: 10.1002/cne.902290206. [DOI] [PubMed] [Google Scholar]
- Cholet N, Seylaz J, Lacombe P, Bonvento G. Local uncoupling of the cerebrovascular and metabolic responses to somatosensory stimulation after neuronal nitric oxide synthase inhibition. Journal of Cerebral Blood Flow and Metabolism. 1997;17:1191–1201. doi: 10.1097/00004647-199711000-00008. [DOI] [PubMed] [Google Scholar]
- Creutzfeldt O. Cortex cerebri. Oxford: Oxford Science Publishers; 1995. General neurophysiology of the cortex; pp. 131–163. [Google Scholar]
- Detre JA, Ances BM, Takahashi K, Greenberg JH. Signal averaged laser Doppler measurements of activation- flow coupling in the rat forepaw somatosensory cortex. Brain Research. 1998;796:91–98. doi: 10.1016/s0006-8993(98)00322-9. [DOI] [PubMed] [Google Scholar]
- Di S, Baumgartner C, Barth DS. Laminar analysis of extracellular field potentials in rat vibrissa/barrel cortex. Journal of Neurophysiology. 1990;63:832–840. doi: 10.1152/jn.1990.63.4.832. [DOI] [PubMed] [Google Scholar]
- Dowling JL, Henegar MM, Liu D, Rovainen CM, Woolsey TA. Rapid optical imaging of whisker responses in the rat barrel cortex. Journal of Neuroscience Methods. 1996;66:113–122. doi: 10.1016/0165-0270(96)00007-6. [DOI] [PubMed] [Google Scholar]
- Edvinsson L, Mulder H, Goadsby PJ, Uddman R. Calcitonin gene-related peptide and nitric oxide in the trigeminal ganglion: cerebral vasodilatation from trigeminal nerve stimulation involves mainly calcitonin gene-related peptide. Journal of the Autonomic Nervous System. 1998;70:15–22. doi: 10.1016/s0165-1838(98)00033-2. [DOI] [PubMed] [Google Scholar]
- Fabricius M, Akgoren N, Dirnagl U, Lauritzen M. Laminar analysis of cerebral blood flow in cortex of rats by laser-Doppler flowmetry: a pilot study. Journal of Cerebral Blood Flow and Metabolism. 1997;17:1326–1336. doi: 10.1097/00004647-199712000-00008. [DOI] [PubMed] [Google Scholar]
- Gerrits RJ, Raczynski C, Greene AS, Stein EA. Regional cerebral blood flow responses to variable frequency whisker stimulation: an autoradiographic analysis. Brain Research. 2000;864:205–212. doi: 10.1016/s0006-8993(00)02142-9. [DOI] [PubMed] [Google Scholar]
- Gerrits RJ, Stein EA, Greene AS. Blood flow increases linearly in rat somatosensory cortex with increased whisker movement frequency. Brain Research. 1998;783:151–157. doi: 10.1016/s0006-8993(97)01320-6. [DOI] [PubMed] [Google Scholar]
- Greenberg JH, Sohn NW, Hand PJ. Nitric oxide and the cerebral-blood-flow response to somatosensory activation following deafferentation. Experimental Brain Research. 1999;129:541–550. doi: 10.1007/s002210050924. [DOI] [PubMed] [Google Scholar]
- Grinvald A, Lieke E, Frostig RD, Gilbert CD, Wiesel TN. Functional architecture of cortex revealed by optical imaging of intrinsic signals. Nature. 1986;324:361–364. doi: 10.1038/324361a0. [DOI] [PubMed] [Google Scholar]
- Hudetz AG, Feher G, Kampine JP. Heterogeneous autoregulation of cerebrocortical capillary flow: Evidence for functional thoroughfare channels. Microvascular Research. 1996;51:131–136. doi: 10.1006/mvre.1996.0015. [DOI] [PubMed] [Google Scholar]
- Ichimi K, Kuchiwaki H, Inao S, Shibayama M, Yoshida J. Cerebral blood flow regulation under activation of the primary somatosensory cortex during electrical stimulation of the forearm. Neurological Research. 1999;21:579–584. doi: 10.1080/01616412.1999.11740980. [DOI] [PubMed] [Google Scholar]
- Jacquin MF, Chiaia NL, Klein BG, Rhoades RW. Structure-function relationships in the rat brainstem subnucleus interpolaris: VI. Cervical convergence in cells deafferented at birth and a potential primary afferent substrate. Journal of Comparative Neurology. 1989;283:513–525. doi: 10.1002/cne.902830406. [DOI] [PubMed] [Google Scholar]
- Lauritzen M. Pathophysiology of the migraine aura. The spreading depression theory. Brain. 1994;117:199–210. doi: 10.1093/brain/117.1.199. [DOI] [PubMed] [Google Scholar]
- Leniger-Follert E, Hossmann KA. Simultaneous measurements of microflow and evoked potentials in the somatomotor cortex of the cat brain during specific sensory activation. Pflügers Archiv. 1979;380:85–89. doi: 10.1007/BF00582617. [DOI] [PubMed] [Google Scholar]
- Leniger-Follert E, Lubbers DW. Regulation of microflow and behaviour of local tissue Po2 during activation and anoxia of the brain cortex. Bibliotheca Anatomica. 1977;15:345–349. [PubMed] [Google Scholar]
- Lindauer U, Megow D, Matsuda H, Dirnagl U. Nitric oxide: a modulator, but not a mediator, of neurovascular coupling in rat somatosensory cortex. American Journal of Physiology. 1999;277:H799–H811. doi: 10.1152/ajpheart.1999.277.2.H799. [DOI] [PubMed] [Google Scholar]
- Lindauer U, Megow D, Schultze J, Weber JR, Dirnagl U. Nitric oxide synthase inhibition does not affect somatosensory evoked potentials in the rat. Neuroscience Letters. 1996;216:207–210. doi: 10.1016/0304-3940(96)13044-5. [DOI] [PubMed] [Google Scholar]
- Lindauer U, Villringer A, Dirnagl U. Characterization of CBF response to somatosensory stimulation: model and influence of anesthetics. American Journal of Physiology. 1993;264:H1223–H1228. doi: 10.1152/ajpheart.1993.264.4.H1223. [DOI] [PubMed] [Google Scholar]
- Malonek D, Dirnagl U, Lindauer U, Yamada K, Kanno I, Grinvald A. Vascular imprints of neuronal activity: relationships between the dynamics of cortical blood flow, oxygenation, and volume changes following sensory stimulation. Proceedings of the National Academy of Sciences of the USA. 1997;94:14826–14831. doi: 10.1073/pnas.94.26.14826. [DOI] [PMC free article] [PubMed] [Google Scholar]
- Mathiesen C, Caesar K, Akgoren N, Lauritzen M. Modification of activity-dependent increases of cerebral blood flow by excitatory synaptic activity and spikes in rat cerebellar cortex. Journal of Physiology. 1998;512:555–566. doi: 10.1111/j.1469-7793.1998.555be.x. [DOI] [PMC free article] [PubMed] [Google Scholar]
- Mathiesen C, Caesar K, Lauritzen M. Temporal coupling between neuronal activity and blood flow in rat cerebellar cortex as indicated by field potential analysis. Journal of Physiology. 2000;523:235–246. doi: 10.1111/j.1469-7793.2000.t01-1-00235.x. [DOI] [PMC free article] [PubMed] [Google Scholar]
- Matsuura T, Fujita H, Seki C, Kashikura K, Yamada K, Kanno I. CBF change evoked by somatosensory activation measured by laser-Doppler flowmetry: independent evaluation of RBC velocity and RBC concentration. Japanese Journal of Physiology. 1999;49:289–296. doi: 10.2170/jjphysiol.49.289. [DOI] [PubMed] [Google Scholar]
- Moskalenko YE, Dowling JL, Liu D, Rovainen CM, Semernia VN, Woolsey TA. LCBF changes in rat somatosensory cortex during whisker stimulation monitored by dynamic H2 clearance. International Journal of Psychophysiology. 1996;21:45–59. doi: 10.1016/0167-8760(95)00042-9. [DOI] [PubMed] [Google Scholar]
- Moskalenko YE, Woolsey TA, Rovainen C, Weinstein GB, Liu D, Semernya VN, Mitrofanov VF. Blood flow dynamics in different layers of the somatosensory region of the cerebral cortex in the rat during mechanical stimulation of the vibrissae. Neuroscience and Behavioral Physiology. 1998;28:459–467. doi: 10.1007/BF02464807. [DOI] [PubMed] [Google Scholar]
- Narayan SM, Esfahani P, Blood AJ, Sikkens L, Toga AW. Functional increases in cerebral blood volume over somatosensory cortex. Journal of Cerebral Blood Flow and Metabolism. 1995;15:754–765. doi: 10.1038/jcbfm.1995.95. [DOI] [PubMed] [Google Scholar]
- Narayan SM, Santori EM, Blood AJ, Burton JS, Toga AW. Imaging optical reflectance in rodent barrel and forelimb sensory cortex. Neuroimage. 1994;1:181–190. doi: 10.1006/nimg.1994.1003. [DOI] [PubMed] [Google Scholar]
- Ngai AC, Jolley MA, D'ambrosio R, Meno JR, Winn HR. Frequency-dependent changes in cerebral blood flow and evoked potentials during somatosensory stimulation in the rat. Brain Research. 1999;837:221–228. doi: 10.1016/s0006-8993(99)01649-2. [DOI] [PubMed] [Google Scholar]
- Ngai AC, Ko KR, Morii S, Winn HR. Effect of sciatic nerve stimulation on pial arterioles in rats. American Journal of Physiology. 1988;254:H133–H139. doi: 10.1152/ajpheart.1988.254.1.H133. [DOI] [PubMed] [Google Scholar]
- Ngai AC, Meno JR, Winn HR. l-NNA suppresses cerebrovascular response and evoked potentials during somatosensory stimulation in rats. American Journal of Physiology. 1995;269:H1803–H1810. doi: 10.1152/ajpheart.1995.269.5.H1803. [DOI] [PubMed] [Google Scholar]
- Nielsen AN, Fabricius M, Lauritzen M. Scanning laser-Doppler flowmetry of rat cerebral circulation during cortical spreading depression. Journal of Vascular Research. 2000;37:513–522. doi: 10.1159/000054084. [DOI] [PubMed] [Google Scholar]
- Nilsson GE. Perimeds LDV flowmeter. In: Sheperd AP, Oberg PA, editors. Laser Doppler Flowmetry. Amsterdam: Kluwer Academic Publishers; 1980. pp. 57–72. [Google Scholar]
- Niwa K, Araki E, Morham SG, Ross ME, Iadecola C. Cyclooxygenase-2 contributes to functional hyperemia in whisker-barrel cortex. Journal of Neuroscience. 2000;20:763–770. doi: 10.1523/JNEUROSCI.20-02-00763.2000. [DOI] [PMC free article] [PubMed] [Google Scholar]
- Patel U. Non-random distribution of blood vessels in the posterior region of the rat somatosensory cortex. Brain Research. 1983;289:65–70. doi: 10.1016/0006-8993(83)90006-9. [DOI] [PubMed] [Google Scholar]
- Raichle ME. Behind the scenes of functional brain imaging: a historical and physiological perspective. Proceedings of the National Academy of Sciences of the USA. 1998;95:765–772. doi: 10.1073/pnas.95.3.765. [DOI] [PMC free article] [PubMed] [Google Scholar]
- Salt TE. Mediation of thalamic sensory input by both NMDA receptors and non-NMDA receptors. Nature. 1986;322:263–265. doi: 10.1038/322263a0. [DOI] [PubMed] [Google Scholar]
- Segal SS, Damon DN, Duling BR. Propagation of vasomotor responses coordinates arteriolar resistances. American Journal of Physiology. 1989;256:H832–H837. doi: 10.1152/ajpheart.1989.256.3.H832. [DOI] [PubMed] [Google Scholar]
- Simons DJ. Response properties of vibrissa units in rat SI somatosensory neocortex. Journal of Neurophysiology. 1978;41:798–820. doi: 10.1152/jn.1978.41.3.798. [DOI] [PubMed] [Google Scholar]
- Villringer A, Dirnagl U. Coupling of brain activity and cerebral blood flow: Basis of functional neuroimaging. Cerebrovascular and Brain Metabolism Reviews. 1995;7:240–276. [PubMed] [Google Scholar]
- Woolsey TA, Rovainen CM, Cox SB, Henegar MH, Liang GE, Liu D, Moskalenko YE, Sui J, Wei L. Neuronal units linked to microvascular modules in cerebral cortex: response elements for imaging the brain. Cerebral Cortex. 1996;6:647–660. doi: 10.1093/cercor/6.5.647. [DOI] [PubMed] [Google Scholar]
- Woolsey TA, Van der loos H. The structural organization of layer IV in the somatosensory region (SI) of mouse cerebral cortex. The description of a cortical field composed of discrete cytoarchitectonic units. Brain Research. 1970;17:205–242. doi: 10.1016/0006-8993(70)90079-x. [DOI] [PubMed] [Google Scholar]
- Yang G, Chen G, Ebner TJ, Iadecola C. Nitric oxide is the predominant mediator of cerebellar hyperemia during somatosensory activation in rats. American Journal of Physiology. 1999;277:R1760–R1770. doi: 10.1152/ajpregu.1999.277.6.R1760. [DOI] [PubMed] [Google Scholar]
- Zhang ET, Mikkelsen JD, Fahrenkrug J, Moller M, Kronborg D, Lauritzen M. Prepro-vasoactive intestinal polypeptide-derived peptide sequences in cerebral blood vessels of rats: on the functional anatomy of metabolic autoregulation. Journal of Cerebral Blood Flow and Metabolism. 1991;11:932–938. doi: 10.1038/jcbfm.1991.158. [DOI] [PubMed] [Google Scholar]