

Abstract
Ca2+-phosphate (Pi) precipitation in the sarcoplasmic reticulum (SR) may cause reduced SR Ca2+ release in skeletal muscle fatigue. To study this, we inhibited the creatine kinase (CK) reaction with 2,4-dinitro-1-fluorobenzene (DNFB). The hypothesis was that with inhibition of CK, phosphocreatine would not break down to creatine and Pi. Therefore Pi transport into the SR would be limited and Ca2+-Pi precipitation would not occur.
Intact single fibres from a mouse foot muscle were fatigued by repeated short tetani under control conditions or after exposure to DNFB (10 μM). The free myoplasmic concentrations of Ca2+ ([Ca2+]i) and Mg2+ ([Mg2+]i) were measured with indo-1 and mag-indo-1, respectively. Changes in [Mg2+]i were assumed to reflect alterations in myoplasmic ATP concentration.
During the first 10 fatiguing tetani, tetanic [Ca2+]i increased both in control and after DNFB exposure. Thereafter tetanic [Ca2+]i fell and the rate of fall was about fourfold lower after DNFB exposure compared with control.
Under control conditions, there was a good relationship between declining tetanic [Ca2+]i and increasing [Mg2+]i during the final part of fatiguing stimulation. This correlation was lost after DNFB exposure.
In conclusion, the present data fit with a model where Ca2+-Pi precipitation inhibits SR Ca2+ release in fatigue produced by repeated short tetani. Furthermore, the results suggest that the rate of Pi transport into the SR critically depends on the myoplasmic Mg2+/ATP concentration.
The performance of skeletal muscle decreases during intense activity and this phenomenon is known as fatigue. Fatigue is to some extent due to impaired cross-bridge function and decreased myofibrillar Ca2+ sensitivity. In addition, sarcoplasmic reticulum (SR) Ca2+ release is often reduced in fatigue (Allen et al. 1989; Westerblad & Allen, 1991; Baker et al. 1993). The reduced SR Ca2+ release may be caused by failure anywhere in the activation pathway, which in the muscle fibres starts with action potentials propagating along the surface membrane. The action potentials are conducted into the t-tubular system where they activate voltage sensors (i.e. the dihydropyridine receptors) that activate the SR Ca2+ release channels (i.e. the ryanodine receptors) and Ca2+ is released into the myoplasm (for a recent review see Melzer et al. 1995).
Several different types of activation failure in fatigue have been identified. For instance, continuous tetanic stimulation is associated with a larger inhibition of SR Ca2+ release in the centre than at the surface of muscle fibres, which fits with an impaired propagation of action potentials into the t-tubular system (Westerblad et al. 1990; Duty & Allen, 1994). Furthermore, a reduction of tetanic free myoplasmic [Ca2+] ([Ca2+]i), which seems to have a metabolic origin, has been observed during fatigue produced by repeated short tetani. With this stimulation pattern, there is a good temporal correlation between the reduction of tetanic [Ca2+]i and an increase in the free myoplasmic [Mg2+] ([Mg2+]i) (Westerblad & Allen, 1992). The increase in [Mg2+]i was proposed to stem from a net breakdown of ATP, because much of the Mg2+ inside muscle cells is bound to ATP and the products of ATP breakdown all have lower affinity for Mg2+. Increased [Mg2+]i and reduced ATP inhibit the SR Ca2+ release channels (Smith et al. 1985; Lamb & Stephenson, 1991; Blazev & Lamb, 1999), but the increase in [Mg2+]i in fatigue appears to be too small to explain directly the decrease in tetanic [Ca2+]i (Westerblad & Allen, 1992). Another mechanism by which the fatigue-induced decrease in tetanic [Ca2+]i may occur is through inorganic phosphate ions (Pi) entering the SR and precipitating with Ca2+, thus reducing the Ca2+ available for release (Fryer et al. 1995; Westerblad & Allen, 1996). Posterino & Fryer (1998) recently presented results that may couple Ca2+-Pi precipitation in the SR and increasing [Mg2+]i/falling ATP: in skinned rat fibres with intact SR they showed an increased rate and extent of Pi-induced inhibition of SR Ca2+ release in the absence of ATP. Furthermore, Pi may enter the SR via an anion channel that is inhibited at the ATP concentration of a resting muscle (Ahern & Laver, 1998). As ATP declines during the final part of fatiguing stimulation, this channel may open and allow Pi to enter the SR.
The aim of the present study was to investigate whether Ca2+–Pi precipitation in the SR may cause the decline of tetanic [Ca2+]i observed in fatigue produced by repeated short tetani. For this purpose we compared the decline of tetanic [Ca2+]i in single mouse muscle fibres during fatigue under normal conditions and after pharmacological inhibition of creatine kinase (CK). This enzyme catalyses the exchange of phosphate groups between ATP and phosphocreatine (PCr) via the following reaction:
Since the Pi accumulating in the myoplasm during fatigue mainly stems from PCr breakdown, we hypothesise that Pi accumulation in the myoplasm will be limited when CK is inhibited. Therefore the transport of Pi into the SR would not be large enough to cause Ca2+–Pi precipitation and SR Ca2+ release would not be inhibited by this mechanism. The results show a markedly slower decline of tetanic [Ca2+]i during fatigue after CK inhibition, in accordance with our hypothesis. Furthermore, there was a good correlation between decreasing tetanic [Ca2+]i and increasing [Mg2+]i when fatigue was produced under control conditions, but this correlation was lost after CK inhibition.
METHODS
Animals
Adult male mice of the NMRI strain were kept at room temperature with a 12 h:12 h light-dark cycle; food and water were provided ad libitum. Animals were killed by exposure to a rising concentration of CO2 and thereafter hindlimb flexor brevis muscles were isolated. All procedures involving animals were approved by the local ethics committee.
Single fibre dissection, mounting and stimulation
Intact, single fibres were dissected following a procedure described elsewhere (Lännergren & Westerblad, 1987). The isolated fibre was mounted between an Akers 801 force transducer (SensoNor, Horten, Norway) and an adjustable holder in a chamber that was continuously perfused with Tyrode solution. The fibre length was adjusted to that giving maximum tetanic force and the fibre diameter was measured. Stimulation was achieved by supramaximum current pulses (duration, 0.5 ms) delivered via platinum plate electrodes lying parallel to the fibres. Tetanic stimulation consisted of 350 ms trains of stimuli at 70–100 Hz; in each experiment the stimulation frequency was set so that close to maximum tetanic force was produced.
Solutions
Experiments were performed at room temperature (24–26 °C). The isolated fibre was bathed in a Tyrode solution of the following composition (mm): NaCl, 121; KCl, 5.0; CaCl2, 1.8; MgCl2, 0.5; NaH2PO4, 0.4; NaHCO3, 24.0; EDTA, 0.1; glucose, 5.5; 0.2 % fetal calf serum was added to the solution to improve fibre survival (Lännergren & Westerblad, 1987; see also Berra et al. 1998). The solution was bubbled with 5 % CO2–95 % O2, which gave a pH of 7.4. To inhibit the CK reaction, 2,4-dinitro-1-fluorobenzene (DNFB; Sigma) was added from a 100 mm stock solution in DMSO to give a final concentration of 10 μm (Tombes et al. 1987). Control experiments with addition of DMSO only showed no effect on tetanic [Ca2+]i or force.
[Ca2+]i and [Mg2+]i measurements
[Ca2+]i was measured with the fluorescent Ca2+ indicator indo-1 (Molecular Probes, Leiden, The Netherlands), which was microinjected into the fibre. The fluorescence of indo-1 was measured with a system consisting of a Xenon lamp, a monochromator and two photomultiplier tubes (PTI, Photo Med GmbH, Wedel, Germany). The excitation light was set to 360 ± 5 nm and the light emitted at 405 ± 5 and 495 ± 5 nm was measured. The ratio of the light emitted at 405 nm to that at 495 nm was converted to [Ca2+]i as described in Andrade et al. (1998). Changes in resting [Ca2+]i during fatigue were assessed by measuring the mean fluorescence ratio over 100 ms immediately before tetanic stimulation. Tetanic [Ca2+]i was measured at regular intervals during fatiguing stimulation as the mean fluorescence ratio over the 350 ms of tetanic stimulation.
[Mg2+]i was measured with mag-indo-1 (Molecular Probes); the methods used for microinjection, light excitation and measurement of light emission were the same as for indo-1. Changes in [Mg2+]i during fatigue were followed by measuring mean 405 nm/495 nm ratios over 1 s, excluding tetanic stimulations where the ratio might be affected by changes in [Ca2+]i and fibre movement. Emission ratios were converted to [Mg2+]i using the following equation (Grynkiewicz et al. 1985):
| (1) |
where KD is the apparent dissociation constant of mag-indo-1, β the ratio of the 495 nm signals at low and high [Mg2+]i, and Rmin the 405 nm/495 nm ratio at low [Mg2+]i and Rmax the ratio at high [Mg2+]i. β, Rmin and Rmax were established intracellularly with the equipment used in the present study (cf. Westerblad & Allen, 1992). Rmin and Rmax were assessed by repeated injections of 0.5 m K2EDTA and 0.5 m MgCl2, respectively, into a fibre until stable ratios were obtained. This was performed in three fibres and gave a Rmin of 0.421 ± 0.003 and a Rmax of 1.75 ± 0.15. β was obtained by plotting the 495 nm signal vs. the 405 nm signal from periods of injections of either 0.5 m K2EDTA or 0.5 m MgCl2 (see Bakker et al. 1993; Csernoch et al. 1998). Linear regression was then used to obtain the slope of this plot (m) for each injection period; m amounted to −4.66 ± 1.17. Mean values of m, Rmin and Rmax were then used to establish β using the following equation:
| (2) |
which gave a value for β of 3.09. This was the value used when converting fluorescence ratios into [Mg2+]i. β can also be estimated from the 495 nm signal at Rmin and Rmax, but this requires correction for the general decline of the signal over time. At any rate, this gave a value for β (3.27 ± 0.21) which was similar to that obtained with our preferred method. Finally, we used a KD of 5.1 mm, which was the value obtained in an in vivo calibration of mag-indo-1 in mouse muscle fibres (Csernoch et al. 1998).
In the present experiments we observed a marked decrease in the mag-indo-1 fluorescence ratio early during fatiguing stimulation under control conditions but not after DNFB exposure (see Fig. 5). This early decrease was not present when furaptra (mag-fura-2) was used to measure [Mg2+]i during fatigue in mouse single muscle fibres (Westerblad & Allen, 1992) and hence it could be due to changed fluorescence properties of mag-indo-1 rather than a real decline of [Mg2+]i. An indication of altered fluorescence properties can be obtained from repeated measurements of m (see above), which can be performed at any instance when the fluorescence ratio is changing. Measurements of m (n = 4) during periods of the fatiguing stimulation when the fluorescence ratio was increasing (i.e. during the final part of the stimulation period under control conditions and during the initial part after DNFB exposure; see Fig. 5) gave an m value of −6.15 ± 2.78 under control conditions and −6.07 ± 2.32 after DNFB exposure. These values were not significantly different from the value obtained with injection of MgCl2 or K2EDTA (mean −4.66; see above) and show that an increase in [Mg2+]i is associated with a marked decline of the 495 nm signal and a minor increase in the 405 nm signal. Conversely, m was markedly different (−0.24 ± 0.17) during the period in early fatigue under control conditions where the mag-indo-1 fluorescence ratio decreased (Fig. 1). Thus, in this situation changes in the 405 nm signal were larger than changes in the 495 nm signal. Furthermore, during the first minute after fatiguing stimulation under control conditions, the mag-indo-1 fluorescence ratio showed a significant increase (Δratio, 0.025 ± 0.008; n = 4). During the same period, there was no consistent change in the ratio after DNFB exposure (Δratio, 0.008 ± 0.008) and when furaptra was used to measure [Mg2+]i, a decrease was observed during the first minute of recovery (Westerblad & Allen, 1992). Thus, the increased ratio observed during the first minute of recovery under control conditions may represent normalization of fatigue-induced alterations of mag-indo-1 properties. In line with this, m during the first minute of recovery was −0.82 ± 0.41, hence similar to the value obtained during the initial period of ratio decline.
Figure 5. Mag-indo-1 fluorescence ratio records during fatigue were markedly different under control conditions and after DNFB exposure.
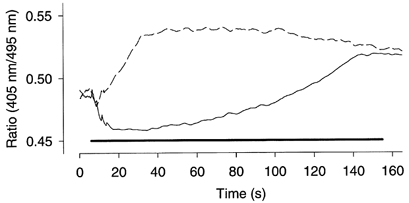
Original records obtained in one fibre during fatigue under control conditions (continuous line) and subsequently after DNFB exposure (dashed line). The horizontal bar indicates the period of fatiguing stimulation.
Figure 1. The early decline of the mag-indo-1 fluorescence ratio during fatigue was due to altered properties of the dye.
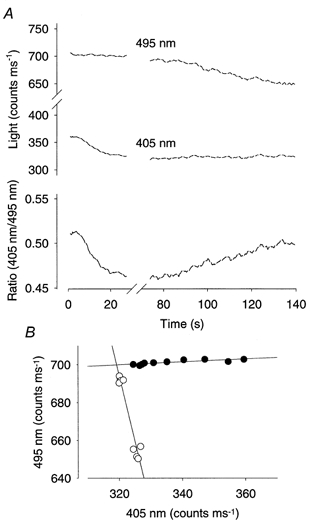
A, original records of the light emitted by mag-indo-1 at 495 nm (upper trace), at 405 nm (middle trace), and the 405 nm/495 nm ratio (lower trace). Lines are interrupted during each tetanic stimulation, when signals were not measured. Note that the early ratio decline was associated with a change mainly in the 405 nm signal, whereas the opposite was true for the late increase in ratio. In B, the 495 nm signal is plotted against the 405 nm signal at various times: •, during the early decline in ratio; ○, at the start and end of the late increase. Each data point represents the mean between two subsequent tetanic stimulations. Lines represent linear regression. The slope of the regression lines (m) was 0.08 for the early ratio decrease and −6.99 for the late increase.
Fibres are likely to swell due to rapid breakdown of PCr to Pi and Cr in early fatigue under control conditions. Therefore control experiments were performed to study whether fibre swelling can affect mag-indo-1 fluorescence signals. In these experiments brief injections of either KCl or K2HPO4 were performed while the mag-indo-1 fluorescence signals were measured. The rationale was that injection of these substances would give rise to a transient swelling of the fibre while no major changes in [Mg2+]i can be expected. Each injection of KCl or K2HPO4 resulted in a transient reduction of the mag-indo-1 fluorescence ratio and in these transients m was −0.50 ± 0.26 (n = 8). Furthermore, control experiments were performed in which fibre swelling was induced by exposing fibres to a hypotonic Tyrode solution and this also resulted in a reduced fluorescence ratio. Thus, the decrease in mag-indo-1 fluorescence ratio in early fatigue under control conditions appears to be due to altered mag-indo-1 fluorescence properties rather than a genuine reduction of [Mg2+]i. Due to this problem with the indicator, values are generally presented as mag-indo-1 fluorescence ratios. To obtain an estimate of the change in [Mg2+]i in fatigue under control conditions, we took advantage of the fact that the early decline and the late increase in mag-indo-1 fluorescence ratio were separated in time (see Fig. 1 and Fig. 5). [Mg2+]i after the early ratio decline was then obtained by measuring the early ratio decline and then adding this value to the ratio obtained later during fatiguing stimulation.
Mag-indo-1 and indo-1 are closely related. Since mag-indo-1 fluorescence displayed major changes during fatigue, there is a risk that indo-1 displays similar changes. We therefore measured m in the first, tenth and last tetani of fatigue runs. In contrast to measurements of the ratio, measurements of the 405 and 495 nm signals are rather sensitive to movement artefacts. Measurements of m were therefore restricted to the immediate increase in [Ca2+]i at the onset of tetani. In the first tetanus of fatiguing stimulation, m was similar under control conditions (−1.66 ± 0.16; n = 11) and after DNFB exposure (−1.66 ± 0.20; n = 9). During fatigue m showed a small, but significant (P < 0.05), decrease. In the tenth tetanus, m was reduced to 85 ± 3 and 87 ± 5 % of the initial in control and after DNFB exposure, respectively; corresponding values in the last tetanus were 88 ± 5 and 87 ± 10 %. Thus, indo-1 fluorescence showed only minor changes during fatigue. Moreover, these changes differed from those observed with mag-indo-1 since they were similar under control conditions and after DNFB exposure.
Experimental protocol
After injection of fluorescent indicator, fibres were allowed to rest for at least 60 min. Some tetanic contractions were then produced at 1 min intervals to make sure that force and [Ca2+]i were stable. Fibres that produced markedly less force than prior to injection were discarded. During experiments fluorescence and force signals were sampled on-line and stored in a desktop computer for subsequent data analysis.
In the first series of experiments, two successive fatigue runs were produced in each fibre, the first under control conditions and the second after exposure to DNFB. This protocol was used because the fatigue resistance may vary between fibres, while it is fairly constant when repeated fatigue runs are produced in the same fibre (Chin & Allen, 1997; Bruton et al. 1998). Fatigue was induced by 350 ms tetani given every 2.5 s. In the first fatigue run, stimulation was continued until peak tetanic force was reduced to 30 % of the original. The fibre was then allowed to recover for at least 90 min. Thereafter the fibre was exposed to 10 μm DNFB for 5 min, and after a washout period of 2 min, the fibre was fatigued again with the same number of tetani as in the first fatigue run. In control experiments we observed that addition of DNFB could have direct effects on the fluorescence signals (see also Duke & Steele, 1999), and therefore such measurements were not performed when DNFB was present. However, we have previously observed that the effect of DNFB on shortening velocity during prolonged tetani (Westerblad et al. 1998) was not reversed on washout of the drug (H. Westerblad, A. J. Dahlstedt & J. Lännergren, unpublished observation); irreversible effects of DNFB have also been shown in skinned rat muscle fibres (Duke & Steele, 1999).
Two out of six fibres showed clearly lower tetanic [Ca2+]i (reduced by about 20 %) after 90 min recovery compared with the start of the first fatigue run. This reduction was probably due to the existence of the type of delayed recovery known as low-frequency fatigue (Westerblad et al. 1993). The stimulation frequency was increased in these two fibres (from 70 to 80 Hz and from 70 to 100 Hz, respectively) so that both fatigue runs would start at similar tetanic [Ca2+]i. The results from these two fibres did not in any obvious way differ from the results from the other fibres.
In a second series of experiments, [Ca2+]i was measured in fibres that were only fatigued once, either under control conditions or after 5 min exposure to DNFB (as described above). The stimulation frequency was consistently 70 Hz in this series. Control fibres were stimulated until tetanic force was reduced to 30 % of the original. DNFB exposure affected force production (see below) and the duration of fatiguing stimulation could therefore not be decided on the basis of force decline. Instead DNFB-exposed fibres were always stimulated with 100 tetani.
Statistics
Values are presented as means ±s.e.m. When relative tetanic [Ca2+]i and force values are presented, these were calculated in each fibre relative to the first tetanus of the initial fatigue run. When repeated measurements were performed in the same fibre, statistically significant differences were determined using one-way repeated measures ANOVA followed by the Student-Newman-Keuls test for multiple comparisons. Student's paired or unpaired t tests were used when only two measurements were compared. The significance level (P) was set at 0.05 throughout.
RESULTS
Measurements of [Ca2+]i
Figure 2A shows original [Ca2+]i records from one representative fibre. Under control conditions, the fibre displayed the normal fatigue pattern with an early increase in tetanic [Ca2+]i followed by a decline to a level lower than the original. The fibre was then allowed to recover for 90 min. The subsequent exposure to DNFB resulted in a substantial reduction of tetanic [Ca2+]i and a change in the shape of the [Ca2+]i record with a decline during the tetanus. However, during the first 10 fatiguing contractions, tetanic [Ca2+]i increased up to the pre-DNFB value and then remained high for the rest of the stimulation period.
Figure 2. Tetanic [Ca2+]i fell less during fatigue after DNFB exposure.
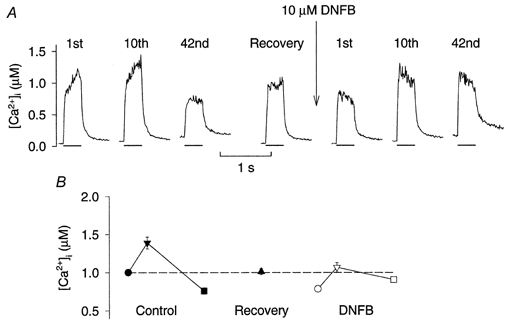
A, original records of tetanic [Ca2+]i from a standard experiment where a fibre first was fatigued under control conditions, allowed to recover, and then finally exposed to 10 μm DNFB for 5 min and fatigued again with the same number of tetani. The 1st, 10th and last (42nd) tetani of each fatigue run are shown together with a tetanus produced after 90 min recovery. Bars below each record represent the period of stimulation. B, mean values (±s.e.m.; n = 6) of tetanic [Ca2+]i in the 1st (•, ○), 10th (▾, ▿) and last (▪, □) fatiguing tetani as well as after 90 min recovery (▴). Filled and open symbols show data before and after exposure to DNFB, respectively. The dashed horizontal line indicates the mean tetanic [Ca2+]i of the first fatiguing tetanus.
Mean data of tetanic [Ca2+]i from six fibres fatigued under control conditions and subsequently after exposure to DNFB are shown in Fig. 2B. Under control conditions, tetanic [Ca2+]i increased significantly to 141 ± 6 % during the first 10 tetani and then started to fall, reaching 76 ± 5 % when force was reduced to 30 % of the control. After the 90 min recovery period, tetanic [Ca2+]i and force were 101 ± 4 and 91 ± 4 % of the original, respectively; note that the stimulation frequency was increased after recovery in two of the six fibres (see Methods). Exposure to DNFB for 5 min resulted in a marked reduction of peak tetanic force to 80 ± 5 % of the control and force started to decline (‘sag’) during the tetanus, which precluded further detailed force analyses. Exposure to DNFB also significantly reduced tetanic [Ca2+]i to 78 ± 2 % of the control. Tetanic [Ca2+]i increased up to the control level (107 ± 5 %) during the first 10 fatiguing contractions and thereafter it declined slowly, reaching 91 ± 3 % in fatigue (i.e. after the same number of tetani as in the preceding fatigue run under control conditions). Thus, in the fatigued state, tetanic [Ca2+]i was significantly higher after DNFB exposure than under control conditions. Tetanic force was reduced to 25 ± 6 % of the control in fatigued DNFB-exposed fibres; hence force production to a large extent appears to be uncoupled from [Ca2+]i at this stage.
The rate of decline of tetanic [Ca2+]i, as measured after the initial increase during the first 10 tetani, was about fourfold lower after exposure to DNFB (3.0 ± 0.6 nm tetanus−1) than under control conditions (12.4 ± 1.2 nm tetanus−1; P < 0.001). In three DNFB-exposed fibres, fatiguing stimulation was continued for an additional 30 to 60 tetani. During this extra stimulation period, the rate of decline of tetanic [Ca2+]i was still only 3.3 ± 0.9 nm tetanus−1, which is markedly different from the normal fatigue pattern where tetanic [Ca2+]i is falling fast during the final stage of fatigue (Westerblad & Allen, 1991; Westerblad & Allen, 1993).
The resting [Ca2+]i of unfatigued fibres was not significantly different under control conditions (71.8 ± 9.4 nm) from that after DNFB exposure (75.3 ± 14.7 nm). Resting [Ca2+]i was also similar at the end of fatiguing stimulation, being 189.2 ± 20.1 nm under control conditions and 183.2 ± 17.0 nm after DNFB exposure. This would indicate that DNFB had no major effect on the SR Ca2+ pump function. To investigate pump function in more detail, the decay of [Ca2+]i at the end of tetani was analysed. Figure 3A shows that average [Ca2+]i records obtained after the first fatiguing tetanus were very similar under control conditions and after exposure to DNFB. Average records obtained in fatigue are shown in Fig. 3B and in this state DNFB exposure caused a slight increase in the mean [Ca2+]i during the first second after the tetanus, which might indicate an effect on SR Ca2+ pumping (Klein et al. 1991; Westerblad & Allen, 1994). Analyses of [Ca2+]i records from individual fibres revealed that the decay of [Ca2+]i in fatigue was somewhat slower after DNFB exposure in four fibres, whereas there was no noticeable difference between control and DNFB in the remaining two fibres.
Figure 3. Mean tails of [Ca2+]i after the first and the last fatiguing tetani.
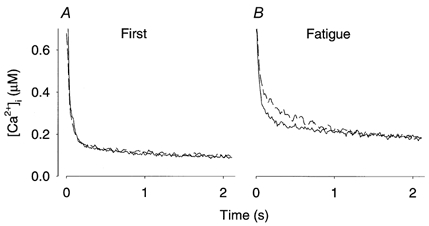
Average records from six fibres obtained after the first (A) and the last (B) fatiguing tetanus under control conditions (continuous lines) and after DNFB exposure (dashed lines). Time axes start at the end of tetanic stimulation. Note that tetanic [Ca2+]i was higher than the range on the y-axis.
It is possible that the slower decline of tetanic [Ca2+]i during fatigue observed after DNFB treatment relates to the fact that DNFB was applied before the second fatigue run; in other words, the decline of tetanic [Ca2+]i may always be slower in the second fatigue run. To deal with this possibility, a second series of experiments were performed where fibres were only fatigued once. In the control group, tetanic [Ca2+]i of the first tetanus was 1.48 ± 0.14 μm (n = 5). Tetanic [Ca2+]i then increased to 142 ± 5 % of the initial value during the first 10 tetani. Thereafter tetanic [Ca2+]i declined at a rate of 24.0 ± 5.9 nm tetanus−1 until fatiguing stimulation was stopped (i.e. when force was reduced to 30 % of the initial). In the DNFB group, tetanic [Ca2+]i was 1.53 ± 0.26 μm (n = 5) before DNFB exposure. After exposure to DNFB, tetanic [Ca2+]i had fallen to 76 ± 8 % of the initial. Tetanic [Ca2+]i then increased to 95 ± 11 % of the initial during the first 10 tetani. During the remaining time of fatiguing stimulation (i.e. 90 tetani), tetanic [Ca2+]i fell slowly at a rate of 5.3 ± 0.4 nm tetanus−1. Thus, tetanic [Ca2+]i and the rates of tetanic [Ca2+]i decline during fatigue were generally higher in this second series of experiments than in the first series. Nevertheless, in both series the rate of decline of tetanic [Ca2+]i was about fourfold lower after DNFB exposure compared with that under control conditions.
When muscle fibres from genetically modified mice completely lacking creatine kinases (CK−/− mice; Steeghs et al. 1997) were fatigued with the same stimulation protocol as in the present study, they displayed a reduction of the tetanic [Ca2+]i in the second fatiguing tetanus and thereafter tetanic [Ca2+]i increased up to the original level (Dahlstedt et al. 2000). This type of transient reduction of tetanic [Ca2+]i was also observed in fibres exposed to DNFB and one example is shown in Fig. 4. Compared with the first fatiguing tetanus after exposure to DNFB, mean data showed a significant reduction of [Ca2+]i in the second fatiguing tetanus to 93 ± 4 % and in the third tetanus it was increased to 106 ± 3 % (n = 11). Fibres fatigued under control conditions never showed the transient reduction of tetanic [Ca2+]i, which was increased to 115 ± 2 % of the initial in the second fatiguing tetanus and to 127 ± 3 % in the third tetanus (n = 11).
Figure 4. Tetanic [Ca2+]i was often reduced in the second fatiguing tetanus after DNFB exposure.
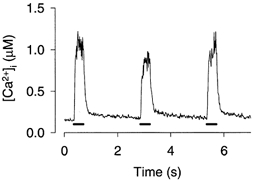
Original [Ca2+]i record showing the first three tetani of a fatigue run produced after exposure to DNFB. Note the transient reduction in tetanic [Ca2+]i in the second tetanus. Bars below the [Ca2+]i records show the periods of tetanic stimulation.
Measurements of [Mg2+]i
The preserved tetanic [Ca2+]i during fatigue after exposure to DNFB might be a consequence of the impaired contractile function; i.e. a reduced cross-bridge activation would reduce the energy consumption and hence the metabolic stress. Measurements of [Mg2+]i during fatigue can be used as an indication of changes in the intracellular ATP level, the rationale being that ATP binds Mg2+ more strongly than its breakdown products (Westerblad & Allen, 1992; Leyssens et al. 1996). In the present study we measured the mag-indo-1 fluorescence ratio in fibres during fatigue produced under control conditions and subsequently after exposure to DNFB, and typical records from one such experiment are shown in Fig. 5. During fatigue produced under control conditions, the fluorescence ratio first displayed a rapid decline and then remained stable for some time before starting to increase. Fibres exposed to DNFB showed a markedly different pattern, with an early increase to a steady level, which remained fairly constant for the remainder of the stimulation period. Before fatiguing stimulation, the mag-indo-1 fluorescence ratio was not significantly different in control from that after DNFB exposure (0.503 ± 0.007 vs. 0.506 ± 0.009; n = 4); converted to [Mg2+]i this gives 1.03 ± 0.10 mm in control and 1.09 ± 0.13 mm after DNFB exposure. After 10 fatiguing tetani produced under control conditions, the fluorescence ratio had fallen significantly to 0.452 ± 0.008. In DNFB-exposed fibres, on the other hand, the mean fluorescence ratio was slightly increased (not significant) after 10 fatiguing tetani. At the end of fatiguing stimulation the fluorescence ratio was not significantly different under control conditions (0.532 ± 0.011) from that after DNFB exposure (0.555 ± 0.017). After correction of the fluorescence ratio under control conditions, assuming that the early decrease is due to altered properties of mag-indo-1 (see Methods), [Mg2+]i in fatigue was 2.05 ± 0.21 mm in control and 1.78 ± 0.25 mm after DNFB exposure.
Mouse muscle fibres fatigued by repeated tetanic contractions display a good correlation between reduced tetanic [Ca2+]i and increased [Mg2+]i, which might indicate a causal relationship (Westerblad & Allen, 1992). Having this in mind, we combined present data obtained in fatigue runs with [Ca2+]i and mag-indo-1 measurements, respectively. This can be justified, as fatigue was produced using the same protocol and force declined at about the same rate in the two sets of experiments: the 30 % tetanic force level was reached after 63.5 ± 8.8 tetani in the [Ca2+]i experiments and after 61.5 ± 3.5 tetani in the experiments in which [Mg2+]i was measured. In Fig. 6A, tetanic [Ca2+]i is plotted vs. the mag-indo-1 fluorescence ratio during fatiguing stimulation under control conditions. The first point was obtained when force was reduced to 80 % of the original and subsequent points were acquired at times when force was reduced by 10 % until stimulation was stopped at 30 % of the original tetanic force. In this way, the period during which the fall of tetanic [Ca2+]i results in a decrease in force is covered, i.e. the initial period during which tetanic [Ca2+]i increases while force decreases is excluded (Westerblad & Allen, 1991; Allen et al. 1995). The plot shows a good correlation between decreasing tetanic [Ca2+]i and increasing mag-indo-1 fluorescence ratio. In contrast, data obtained at the same time points during fatigue runs after DNFB exposure showed no correlation between tetanic [Ca2+]i and the mag-indo-1 fluorescence ratio (Fig. 6B). In this plot we have also included data from the start of fatiguing stimulation, which revealed an opposite trend to that obtained under control conditions: tetanic [Ca2+]i appeared to increase when the mag-indo-1 fluorescence ratio was increasing. The marked difference between control conditions and DNFB exposure is also clear in Fig. 6C where mean data of [Ca2+]ivs.[Mg2+]i are plotted for forces ranging from 80 to 30 % of the original (control data corrected as described in Methods).
Figure 6. The relation between declining tetanic [Ca2+]i and increasing [Mg2+]i during fatigue under control conditions was lost after DNFB exposure.
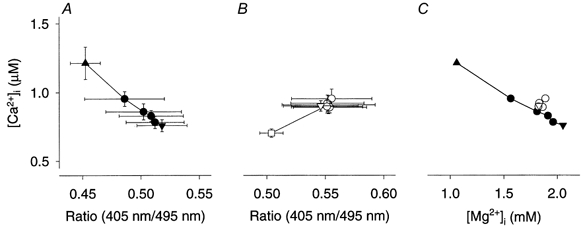
A, combined data of mean (±s.e.m.) tetanic [Ca2+]i (n = 6) and mag-indo-1 measurements (n = 4). Data were obtained during fatigue from the time when tetanic force was reduced to 80 % (▴) until the time when force was down to 30 % (▾) of the original; •, data obtained at intermediate times when force was reduced in steps of 10 %. B, measurements after exposure to DNFB, which in each experiment were performed at the same times as during the original fatigue run. Open symbols; meaning of symbols as in A. Data obtained at 100 % force (□) are also shown. C shows mean data of tetanic [Ca2+]ivs.[Mg2+]i. Filled symbols, control; open symbols, after exposure to DNFB. Values of [Mg2+]i under control conditions were corrected as described in Methods.
DISCUSSION
The present study shows a significantly lower rate of decline of tetanic [Ca2+]i during fatigue produced by repeated tetanic contraction after pharmacological inhibition of the CK reaction with DNFB. Since the increase in myoplasmic Pi would be limited when CK is inhibited, this finding supports the hypothesis that Ca2+–Pi precipitation in the SR is an important mechanism underlying the decrease in tetanic [Ca2+]i in this type of fatigue. Furthermore, we found a good correlation between the decrease in tetanic [Ca2+]i and increasing mag-indo-1 fluorescence ratio/[Mg2+]i under control conditions, but not after inhibition of CK. Since the increase in [Mg2+]i would reflect a reduction of myoplasmic ATP (Westerblad & Allen, 1992; Leyssens et al. 1996), the present results conform with two recent findings: the rate of Pi inhibition of SR Ca2+ release in skinned rat muscle fibres was faster in the absence of ATP (Posterino & Fryer, 1998) and Pi can enter the SR via an anion channel that is inhibited by ATP (Ahern & Laver, 1998).
DNFB and inhibition of creatine kinase
One concern with the present experiments is that they depend on the assumption that DNFB does not have serious confounding side effects. We used a low concentration of DNFB (10 μm), which, in a careful study on sea urchin spermatozoa, was found to inhibit the CK reaction without noticeable side effects (Tombes et al. 1987). Nevertheless, 5 min exposure to DNFB followed by 2 min washout resulted in depressed tetanic force. The reason why DNFB exposure depressed tetanic force is not clear and may not be related to CK inhibition but rather to a non-specific effect of the drug. In line with this, a DNFB-induced reduction of maximum Ca2+-activated force, which appeared not to be due to an effect on CK, has been observed in rat skinned muscle fibres (Fryer et al. 1995). In the present study DNFB exposure also resulted in a reduced tetanic [Ca2+]i before fatiguing stimulation. However, this reduction was overcome during the initial part of the fatigue run and tetanic [Ca2+]i thereafter remained high. Thus, non-specific effects associated with DNFB are inhibitory and it therefore appears unlikely that the higher tetanic [Ca2+]i at the end of fatigue after DNFB exposure would be a consequence of non-specific effects of the drug.
Another concern is to establish that DNFB exposure significantly inhibits the CK reaction in the present experiments. The present mag-indo-1 measurements in DNFB-exposed fibres showed an early increase, consistent with an expected decline of ATP/increase in [Mg2+]i in the absence of CK activity. Furthermore, it has been repeatedly shown that DNFB inhibits the CK reaction both in skeletal muscle (e.g. Dzeja et al. 1996) and in other tissues (e.g. Tombes et al. 1987). We have recently used the same fatiguing protocol on single muscle fibres from creatine kinase deficient (CK−/−) mice and in these fibres tetanic [Ca2+]i remained high during fatigue for a much longer time than in wild-type fibres (Dahlstedt et al. 2000). In addition, CK−/− fibres displayed a transient reduction of tetanic [Ca2+]i in the second fatiguing tetanus similar to that observed in fibres exposed to DNFB (see Fig. 4). We measured metabolites in fatigued whole CK−/− muscles and verified that fatigue occurred without any significant changes in phosphocreatine. Thus, qualitatively similar results are obtained in two animal models with CK inhibition. Both these animal models have limitations: DNFB has non-specific inhibitory effects on muscle function (see above) and CK−/− muscle displays adaptations with, for instance, an increased mitochondrial content (Steeghs et al. 1997). However, as the limitations with the two models are quite disparate and they both show a reduced rate of tetanic [Ca2+]i decline during fatigue, it appears safe to conclude that the preserved tetanic [Ca2+]i in fatigue is due to inhibition of CK.
Measurements of [Mg2+]i
The present mag-indo-1 measurements performed under control conditions can be compared with the results of a previous study on mouse single muscle fibres where furaptra (mag-fura-2) was used to measure [Mg2+]i during fatigue (Westerblad & Allen, 1992). The two indicators gave similar [Mg2+]i at rest: the mean value was 0.78 mm in the study of Westerblad & Allen (1992) and 1.03 mm in the present study (see also Csernoch et al. 1998). Furthermore, both indicators reported a marked rise in [Mg2+]i towards the end of fatiguing stimulation, i.e. from the time when tetanic force was reduced to about 80 % of the control. However, in the present study we observed a marked reduction of the mag-indo-1 fluorescence ratio during the initial part of fatiguing stimulation and only a tendency of such a decline was observed with furaptra (see Fig. 4A of Westerblad & Allen, 1992). The fluorescence signal of mag-indo-1 has been shown to be more sensitive to changes in the surrounding medium than the signal of furaptra (for discussion see Csernoch et al. 1998). Therefore it seemed likely that the early decline observed in the present study was due to altered fluorescence properties of mag-indo-1 rather than a genuine major decrease in [Mg2+]i. Increased myoplasmic Pi appeared to be involved in the early decrease in the mag-indo-1 ratio because (1) the decrease was not observed after inhibition of CK with DNFB (see Fig. 5) and (2) the time course of the decline was very similar to the early force decline, which has been attributed to inhibition of cross-bridge force production by increased myoplasmic Pi (e.g. Dahlstedt et al. 2000). Several results support the assumption that the early reduction of the mag-indo-1 ratio was due to altered fluorescence properties. First, the slope of changes in the 495 nm signal vs. the 405 nm signal (m; see Methods) was markedly different during the early reduction in mag-indo-1 fluorescence ratio (mean, −0.24) compared with calibration experiments and the increases in ratio observed during fatigue (about −5). Second, fibre swelling induced either by injection of KCl or K2HPO4 or by exposing the fibre to hypotonic solution resulted in a decreased mag-indo-1 fluorescence ratio with an m of about −0.5, hence similar to the changes seen in early fatigue under control conditions.
Thus the present results clearly indicate that the reduced mag-indo-1 fluorescence ratio in early fatigue under control conditions is mainly due to altered fluorescence properties of the indicator rather than a real major decrease in [Mg2+]i. However, we do not have any direct information on the type of change, i.e. if changes affected KD, β, Rmin and/or Rmax. We therefore generally present results as mag-indo-1 fluorescence ratios. Moreover, when attempting to obtain an estimate of changes in [Mg2+]i during fatigue under control conditions, a simple method to correct for the early decline of the fluorescence ratio was used: the early ratio decline was measured and this value was added to the ratios obtained later during fatiguing stimulation. This correction is probably not fully accurate but more elaborate corrections do not appear meaningful since critical calibration data are missing. At any rate, the two major findings in the mag-indo-1 experiments would not be seriously affected by this uncertainty: first, there is a marked, early increase in [Mg2+]i in fatigue after DNFB exposure which is not present under control conditions; and second, there is good correlation between declining tetanic [Ca2+]i and increasing [Mg2+]i in late fatigue under control conditions (see also Westerblad & Allen, 1992) and this correlation is lost after DNFB exposure.
Mechanisms of reduced tetanic [Ca2+]i in fatigue
Like the situation for mag-indo-1, the fluorescence properties of indo-1 were also altered during fatigue, as judged from a change in the m value. However, the change in m was rather small and occurred both under control conditions and after DNFB exposure. Therefore the impact on our [Ca2+]i measurements and conclusions based on these measurements will be limited. For instance, if it is assumed that the change in m reflects a solitary change in β, then reducing m in eqn (2) to 87 % of the original (approximately the mean reduction observed during fatigue) while keeping Rmin and Rmax constant results in a 6 % decrease in β. This would mean that all [Ca2+]i measurements performed between the tenth and the last tetanus of fatigue runs should be reduced by 6 %. In the first series of experiments this would, for example, reduce the mean rate of decline of tetanic [Ca2+]i under control conditions from 12.4 to 11.7 nm tetanus−1. The corresponding decrease after DNFB exposure would be from 3.0 to 2.8 nm tetanus−1. Thus, the change in indo-1 properties would not have any major qualitative impact on the results.
The mechanisms underlying the reduced tetanic [Ca2+]i in fatigue produced by repeated tetanic stimulation has, since its discovery (Allen et al. 1989), remained unclear. One suggested mechanism is that increased [Mg2+]i in fatigue (Westerblad & Allen, 1992) directly inhibits SR Ca2+ release channels (see Blazev & Lamb, 1999). Experiments with microinjection of MgCl2 could not mimic the activation failure in fatigue, which seems to refute this suggestion, at least in its simplest form (Westerblad & Allen, 1992). Furthermore, in the present study DNFB-exposed fibres showed an increase in [Mg2+]i that was not accompanied by any reduction of tetanic [Ca2+]i.
The increase in [Mg2+]i in fatigue most probably reflects a reduction of myoplasmic ATP and this reduction might inhibit SR Ca2+ release channels (Meissner et al. 1986) and hence cause the reduced tetanic [Ca2+]i. In a recent study on muscle fibres from CK−/− mice, we observed a transient decline of tetanic [Ca2+]i in the second fatiguing tetanus when the present stimulation protocol was used and this transient decline became more marked with a more intense stimulation pattern (Dahlstedt et al. 2000). Similar results were obtained in the present study with pharmacological CK inhibition. Thus, some factor transiently inhibits Ca2+ release early during repeated tetanic stimulation in muscle fibres with non-operating CK. Since this decline is not observed in muscle fibres with operating CK, it is likely that it reflects a transient change in high-energy phosphates occurring in the absence of PCr energy buffering. For instance, it could be due to a large reduction of ATP combined with an increased [Mg2+] locally in the triads, which directly inhibits the SR Ca2+ release channels (Blazev & Lamb, 1999).
A mechanism that has received increasing attention in recent years is that involving precipitation of Ca2+-Pi in the SR during fatigue, leading to a reduced amount of free Ca2+ available for release. Although no study has directly shown that this type of precipitation does occur, strong indirect evidence of its existence has been presented both in experiments with skinned rat fibres with intact SR exposed to high Pi solutions (Fryer et al. 1995), and in intact mouse fibres microinjected with Pi (Westerblad & Allen, 1996). Recent fatigue experiments support the Ca2+–Pi precipitation mechanism: the amount of Ca2+ in the SR that can be released by application of a high concentration of caffeine or 4-chloro-m-cresol, compounds that directly activate SR Ca2+ release, is reduced in fatigued mouse (Westerblad & Allen, 1991) and toad (Kabbara & Allen, 1999) muscle fibres; and the decline of tetanic [Ca2+]i was markedly delayed in CK−/− fibres (Dahlstedt et al. 2000) and in fibres exposed to DNFB (present study), both of which would fatigue without any major myoplasmic Pi accumulation.
It has previously been noted that the time course of the reduction of tetanic [Ca2+]i during fatigue produced by repeated tetani does not directly fit with the expected time course of Pi increase in the myoplasm: the latter would be expected to occur early during fatigue and the former comes with a variable delay, the length of which depends on the fibre type and metabolic profile of the fibre (Westerblad & Allen, 1996). A possible link between the metabolic profile of a fibre and the rate of Ca2+-Pi precipitation in the SR was recently provided by Posterino & Fryer (1998), who showed that the Pi-induced inhibition of SR Ca2+ release is both faster and larger in the absence of ATP. Furthermore, Pi probably enters the SR via an anion channel that opens at low [ATP] (Ahern & Laver, 1998). The present measurements of [Mg2+]i during fatigue before and after exposure to DNFB clearly conform with these results. When fatigue was produced under control conditions, we found a clear correlation between decreasing tetanic [Ca2+]i and increasing [Mg2+]i (and consequently declining ATP) indicating that Ca2+–Pi precipitation becomes more prominent when ATP falls. [Mg2+]i increased much earlier during fatigue in DNFB-exposed fibres, but the increase was not associated with any decline of tetanic [Ca2+]i. This result fits well with the model, since with CK inhibition there would be no major increase in myoplasmic Pi during fatigue and therefore Ca2+–Pi precipitation in the SR would not occur.
There was a slight increase in the mean tail of [Ca2+]i at the end of a tetanic stimulation in fatigued DNFB-exposed fibres compared with fibres fatigued under control conditions (Fig. 3B), which might indicate a larger inhibition of SR Ca2+ pumping after DNFB exposure (Klein et al. 1991; Westerblad & Allen, 1992). It has previously been shown that pharmacological inhibition of Ca2+ pumping in fatigue gives some increase in tetanic [Ca2+]i and force (Westerblad & Allen, 1994). A slower Ca2+ pumping in fatigue after DNFB exposure may then contribute to the higher tetanic [Ca2+]i in this situation. However, the slower decline of tetanic [Ca2+]i was only seen in four out of six fibres. Moreover in half of the DNFB-exposed fibres we observed a marked, transient inhibition of SR Ca2+ uptake after about 20 tetani and this was actually accompanied by a slight reduction of tetanic [Ca2+]i (data not shown). Thus, slowed SR Ca2+ uptake may result in both increased and decreased tetanic [Ca2+]i. It then appears that the slightly slower SR Ca2+ uptake in fatigue after DNFB exposure is of little importance for the higher tetanic [Ca2+]i in this situation. It may be noted that the transient inhibition of SR Ca2+ uptake observed after about 20 fatiguing tetani is in accordance with recent results from skinned rat fibres exposed to brief pulses of caffeine where removal of phosphocreatine or DNFB exposure caused a marked inhibition of SR Ca2+ uptake (Duke & Steele, 1999).
Concluding remarks and implications for physical performance
The present results, together with recent data obtained from muscle fibres of CK−/− mice (Dahlstedt et al. 2000), indicate that the energy derived from PCr breakdown supports SR Ca2+ release during short-term, high-intensity activities. However, with more endurance-like activities, PCr breakdown may actually cause failure of SR Ca2+ release. Creatine supplementation, which leads to increased muscle PCr levels (Harris et al. 1992), has become increasingly popular among athletes and has also been tried in diseases with decreased exercise tolerance (Gordon et al. 1995; Tarnopolsky et al. 1997). Our results suggest that creatine supplementation is beneficial during short-term exercise where high output is required (‘sprint exercise’), while it might impair performance in endurance exercise. Indeed, some improvement of performance has been observed during high-intensity exercise (Greenhaff et al. 1993), while performance of endurance exercise may become impeded (Balsom et al. 1993).
Acknowledgments
This work was supported by grants from the Swedish Medical Research Council (Project 10842), the Swedish National Center for Sports Research, and funds of the Karolinska Institutet.
References
- Ahern GP, Laver DR. ATP inhibition and rectification of a Ca2+-activated anion channel in sarcoplasmic reticulum of skeletal muscle. Biophysical Journal. 1998;74:2335–2351. doi: 10.1016/S0006-3495(98)77943-3. [DOI] [PMC free article] [PubMed] [Google Scholar]
- Allen DG, Lännergren J, Westerblad H. Muscle cell function during prolonged activity: cellular mechanisms of fatigue. Experimental Physiology. 1995;80:497–527. doi: 10.1113/expphysiol.1995.sp003864. [DOI] [PubMed] [Google Scholar]
- Allen DG, Lee JA, Westerblad H. Intracellular calcium and tension during fatigue in isolated single muscle fibres from Xenopus laevis. Journal of Physiology. 1989;415:433–458. doi: 10.1113/jphysiol.1989.sp017730. [DOI] [PMC free article] [PubMed] [Google Scholar]
- Andrade FH, Reid MB, Allen DG, Westerblad H. Effect of hydrogen peroxide and dithiothreitol on contractile function of single skeletal muscle fibres from the mouse. Journal of Physiology. 1998;509:565–575. doi: 10.1111/j.1469-7793.1998.565bn.x. [DOI] [PMC free article] [PubMed] [Google Scholar]
- Baker AJ, Longuemare MC, Brandes R, Weiner MW. Intracellular tetanic calcium signals are reduced in fatigue of whole skeletal muscle. American Journal of Physiology. 1993;264:C577–C582. doi: 10.1152/ajpcell.1993.264.3.C577. [DOI] [PubMed] [Google Scholar]
- Bakker AJ, Head SI, Williams DA, Stephenson DG. Ca2+ levels in myotubes grown from the skeletal muscle of dystrophic (mdx) and normal mice. Journal of Physiology. 1993;460:1–13. doi: 10.1113/jphysiol.1993.sp019455. [DOI] [PMC free article] [PubMed] [Google Scholar]
- Balsom PD, Harridge SD, Söderlund K, Sjödin B, Ekblom B. Creatine supplementation per se does not enhance endurance exercise performance. Acta Physiologica Scandinavica. 1993;149:521–523. doi: 10.1111/j.1748-1716.1993.tb09649.x. [DOI] [PubMed] [Google Scholar]
- Berra E, Diaz-Meco MT, Moscat J. The activation of p38 and apoptosis by the inhibition of Erk is antagonized by the phosphoinositide 3-kinase/Akt pathway. Journal of Biological Chemistry. 1998;273:10792–10797. doi: 10.1074/jbc.273.17.10792. [DOI] [PubMed] [Google Scholar]
- Blazev R, Lamb GD. Low [ATP] and elevated [Mg2+] reduce depolarization-induced Ca2+ release in rat skinned skeletal muscle fibres. Journal of Physiology. 1999;520:203–215. doi: 10.1111/j.1469-7793.1999.00203.x. [DOI] [PMC free article] [PubMed] [Google Scholar]
- Bruton JD, Lännergren J, Westerblad H. Effects of CO2-induced acidification on the fatigue resistance of single mouse muscle fibers at 28 °C. Journal of Applied Physiology. 1998;85:478–483. doi: 10.1152/jappl.1998.85.2.478. [DOI] [PubMed] [Google Scholar]
- Chin ER, Allen DG. Effects of reduced muscle glycogen concentration on force, Ca2+ release and contractile protein function in intact mouse skeletal muscle. Journal of Physiology. 1997;498:17–29. doi: 10.1113/jphysiol.1997.sp021838. [DOI] [PMC free article] [PubMed] [Google Scholar]
- Csernoch L, Bernengo JC, Szentesi P, Jacquemond V. Measurements of intracellular Mg2+ concentration in mouse skeletal muscle fibers with the fluorescent indicator mag-indo-1. Biophysical Journal. 1998;75:957–967. doi: 10.1016/S0006-3495(98)77584-8. [DOI] [PMC free article] [PubMed] [Google Scholar]
- Dahlstedt AJ, Katz A, Wieringa B, Westerblad H. Is creatine kinase responsible for fatigue? Studies of skeletal muscle deficient of creatine kinase. FASEB Journal. 2000;14:982–990. doi: 10.1096/fasebj.14.7.982. [DOI] [PubMed] [Google Scholar]
- Duke AM, Steele DS. Effects of creatine phosphate on Ca2+ regulation by the sarcoplasmic reticulum in mechanically skinned rat skeletal muscle fibres. Journal of Physiology. 1999;517:447–458. doi: 10.1111/j.1469-7793.1999.0447t.x. [DOI] [PMC free article] [PubMed] [Google Scholar]
- Duty S, Allen DG. The distribution of intracellular calcium concentration in isolated single fibres of mouse skeletal muscle during fatiguing stimulation. Pflügers Archiv. 1994;427:102–109. doi: 10.1007/BF00585948. [DOI] [PubMed] [Google Scholar]
- Dzeja PP, Zeleznikar RJ, Goldberg ND. Suppression of creatine kinase-catalyzed phosphotransfer results in increased phosphoryl transfer by adenylate kinase in intact skeletal muscle. Journal of Biological Chemistry. 1996;271:12847–12851. doi: 10.1074/jbc.271.22.12847. [DOI] [PubMed] [Google Scholar]
- Fryer MW, Owen VJ, Lamb GD, Stephenson DG. Effects of creatine phosphate and Pi on Ca2+ movements and tension development in rat skinned skeletal muscle fibres. Journal of Physiology. 1995;482:123–140. doi: 10.1113/jphysiol.1995.sp020504. [DOI] [PMC free article] [PubMed] [Google Scholar]
- Gordon A, Hultman E, Kaijser L, Kristjansson S, Rolf CJ, Nyquist O, Sylvén C. Creatine supplementation in chronic heart failure increases skeletal muscle creatine phosphate and muscle performance. Cardiovascular Research. 1995;30:413–418. [PubMed] [Google Scholar]
- Greenhaff PL, Casey A, Short AH, Harris R, Söderlund K, Hultman E. Influence of oral creatine supplementation of muscle torque during repeated bouts of maximal voluntary exercise in man. Clinical Science. 1993;84:565–571. doi: 10.1042/cs0840565. [DOI] [PubMed] [Google Scholar]
- Grynkiewicz G, Poenie M, Tsien RY. A new generation of Ca2+ indicators with greatly improved fluorescence properties. Journal of Biological Chemistry. 1985;260:3440–3450. [PubMed] [Google Scholar]
- Harris RC, Söderlund K, Hultman E. Elevation of creatine in resting and exercised muscle of normal subjects by creatine supplementation. Clinical Science. 1992;83:367–374. doi: 10.1042/cs0830367. [DOI] [PubMed] [Google Scholar]
- Kabbara AA, Allen DG. The role of calcium stores in fatigue of isolated single muscle fibres from the cane toad. Journal of Physiology. 1999;519:169–176. doi: 10.1111/j.1469-7793.1999.0169o.x. [DOI] [PMC free article] [PubMed] [Google Scholar]
- Klein MG, Kovacs L, Simon BJ, Schneider MF. Decline of myoplasmic Ca2+, recovery of calcium release and sarcoplasmic Ca2+ pump properties in frog skeletal muscle. Journal of Physiology. 1991;441:639–671. doi: 10.1113/jphysiol.1991.sp018771. [DOI] [PMC free article] [PubMed] [Google Scholar]
- Lamb GD, Stephenson DG. Effect of Mg2+ on the control of Ca2+ release in skeletal muscle fibres of the toad. Journal of Physiology. 1991;434:507–528. doi: 10.1113/jphysiol.1991.sp018483. [DOI] [PMC free article] [PubMed] [Google Scholar]
- Lännergren J, Westerblad H. The temperature dependence of isometric contractions of single, intact fibres dissected from a mouse foot muscle. Journal of Physiology. 1987;390:285–293. doi: 10.1113/jphysiol.1987.sp016700. [DOI] [PMC free article] [PubMed] [Google Scholar]
- Leyssens A, Nowicky AV, Patterson L, Crompton M, Duchen MR. The relationship between mitochondrial state, ATP hydrolysis, [Mg2+]i and [Ca2+]i studied in isolated rat cardiomyocytes. Journal of Physiology. 1996;496:111–128. doi: 10.1113/jphysiol.1996.sp021669. [DOI] [PMC free article] [PubMed] [Google Scholar]
- Meissner G, Darling E, Eveleth J. Kinetics of rapid Ca2+ release by sarcoplasmic reticulum. Effects of Ca2+, Mg2+, and adenine nucleotides. Biochemistry. 1986;25:236–244. doi: 10.1021/bi00349a033. [DOI] [PubMed] [Google Scholar]
- Melzer W, Herrmann-Frank A, Lüttgau HCH. The role of Ca2+ ions in excitation-contraction coupling of skeletal muscle fibres. Biochimica et Biophysica Acta. 1995;1241:59–116. doi: 10.1016/0304-4157(94)00014-5. [DOI] [PubMed] [Google Scholar]
- Posterino GS, Fryer MW. Mechanisms underlying phosphate-induced failure of Ca2+ release in single skinned skeletal muscle fibres of the rat. Journal of Physiology. 1998;512:97–108. doi: 10.1111/j.1469-7793.1998.097bf.x. [DOI] [PMC free article] [PubMed] [Google Scholar]
- Smith JS, Coronado R, Meissner G. Sarcoplasmic reticulum contains adenine nucleotide-activated calcium channels. Nature. 1985;316:446–449. doi: 10.1038/316446a0. [DOI] [PubMed] [Google Scholar]
- Steeghs K, Benders A, Oerlemans F, De Haan A, Heerschap A, Ruitenbeek W, Jost C, van Deursen J, Perryman B, Pette D, Bruckwilder M, Koudijs J, Jap P, Veerkamp J, Wieringa B. Altered Ca2+ responses in muscles with combined mitochondrial and cytosolic creatine kinase deficiencies. Cell. 1997;89:93–103. doi: 10.1016/s0092-8674(00)80186-5. [DOI] [PubMed] [Google Scholar]
- Tarnopolsky MA, Roy BD, MacDonald JR. A randomized, controlled trial of creatine monohydrate in patients with mitochondrial cytopathies. Muscle and Nerve. 1997;20:1502–1509. doi: 10.1002/(sici)1097-4598(199712)20:12<1502::aid-mus4>3.0.co;2-c. [DOI] [PubMed] [Google Scholar]
- Tombes RM, Brokaw CJ, Shapiro BM. Creatine kinase-dependent energy transport in sea urchin spermatozoa. Biophysical Journal. 1987;52:75–86. doi: 10.1016/S0006-3495(87)83190-9. [DOI] [PMC free article] [PubMed] [Google Scholar]
- Westerblad H, Allen DG. Changes of myoplasmic calcium concentration during fatigue in single mouse muscle fibers. Journal of General Physiology. 1991;98:615–635. doi: 10.1085/jgp.98.3.615. [DOI] [PMC free article] [PubMed] [Google Scholar]
- Westerblad H, Allen DG. Myoplasmic free Mg2+ concentration during repetitive stimulation of single fibres from mouse skeletal muscle. Journal of Physiology. 1992;453:413–434. doi: 10.1113/jphysiol.1992.sp019236. [DOI] [PMC free article] [PubMed] [Google Scholar]
- Westerblad H, Allen DG. The contribution of [Ca2+]i to the slowing of relaxation in fatigued single fibres from mouse skeletal muscle. Journal of Physiology. 1993;468:729–740. doi: 10.1113/jphysiol.1993.sp019797. [DOI] [PMC free article] [PubMed] [Google Scholar]
- Westerblad H, Allen DG. The role of sarcoplasmic reticulum in relaxation of mouse muscle; effects of 2,5-di(tert-butyl)-1,4-benzohydroquinone. Journal of Physiology. 1994;474:291–301. doi: 10.1113/jphysiol.1994.sp020022. [DOI] [PMC free article] [PubMed] [Google Scholar]
- Westerblad H, Allen DG. The effects of intracellular injections of phosphate on intracellular calcium and force in single fibres of mouse skeletal muscle. Pflügers Archiv. 1996;431:964–970. doi: 10.1007/s004240050092. [DOI] [PubMed] [Google Scholar]
- Westerblad H, Dahlstedt AJ, Lännergren J. Mechanisms underlying reduced maximum shortening velocity during fatigue of intact, single fibres of mouse muscle. Journal of Physiology. 1998;510:269–277. doi: 10.1111/j.1469-7793.1998.269bz.x. [DOI] [PMC free article] [PubMed] [Google Scholar]
- Westerblad H, Duty S, Allen DG. Intracellular calcium concentration during low-frequency fatigue in isolated single fibers of mouse skeletal muscle. Journal of Applied Physiology. 1993;75:382–388. doi: 10.1152/jappl.1993.75.1.382. [DOI] [PubMed] [Google Scholar]
- Westerblad H, Lee JA, Lamb AG, Bolsover SR, Allen DG. Spatial gradients of intracellular calcium in skeletal muscle during fatigue. Pflügers Archiv. 1990;415:734–740. doi: 10.1007/BF02584013. [DOI] [PubMed] [Google Scholar]