

Abstract
The purpose of these experiments was to use radiolabelled microspheres to measure blood flow distribution within the brain, and in particular to areas associated with motor function, maintenance of equilibrium, cardiorespiratory control, vision, hearing and smell, at rest and during exercise in miniature swine. Exercise consisted of steady-state treadmill running at intensities eliciting 70 and 100 % maximal oxygen consumption (
 ).
).Mean arterial pressure was elevated by 17 and 26 % above that at rest during exercise at 70 and 100 %
, respectively.Mean brain blood flow increased 24 and 25 % at 70 and 100 %
, respectively. Blood flow was not locally elevated to cortical regions associated with motor and somatosensory functions during exercise, but was increased to several subcortical areas that are involved in the control of locomotion.Exercise elevated perfusion and diminished vascular resistance in several regions of the brain related to the maintenance of equilibrium (vestibular nuclear area, cerebellar ventral vermis and floccular lobe), cardiorespiratory control (medulla and pons), and vision (dorsal occipital cortex, superior colliculi and lateral geniculate body). Conversely, blood flow to regions related to hearing (cochlear nuclei, inferior colliculi and temporal cortex) and smell (olfactory bulbs and rhinencephalon) were unaltered by exercise and associated with increases in vascular resistance.
The data indicate that blood flow increases as a function of exercise intensity to several areas of the brain associated with integrating sensory input and motor output (anterior and dorsal cerebellar vermis) and the maintenance of equilibrium (vestibular nuclei). Additionally, there was an intensity-dependent decrease of vascular resistance in the dorsal cerebellar vermis.
Generally brain blood flow is maintained at a relatively constant rate (Heistad & Kontos, 1983). However, during exercise total brain blood flow in humans has been shown to increase (Hedlund et al. 1962; Thomas et al. 1989). Evidence suggests that the increase in perfusion is due to local increases in blood flow to regions associated with increased motor function. For example, vigorous leg, arm and hand movements evoke marked focal increases in cortical blood flow of the contralateral hemisphere (Olesen, 1971; Roland et al. 1977; Halsey et al. 1979; Friedman et al. 1991, 1992; Fink et al. 1995). Focal increases in blood flow have also been shown to occur during other types of non-motor activities. Visual stimulation, for example, has been shown to increase blood flow in the occipital cortex (Sokoloff, 1961; Cooper et al. 1965), and mental tasks have been reported to induce focal increases in cortical blood flow (Risberg & Ingvar, 1973; Roland, 1987).
Whole body dynamic exercise is a complex activity that not only entails neural integration and control of motor function, but also involves other neural functions including integration of sensory input in coordination and balance, maintenance of blood gas and blood pressure homeostasis, and regulation of body temperature. Thus, it would be expected that local changes in blood flow occur in locomotor areas of the central nervous system controlling muscle contraction and in discrete areas of the brain regulating other bodily functions affected by the performance of exercise. Previous investigators have used animal models to determine whether regional changes in brain perfusion occur during whole body dynamic exercise. Using the microsphere technique, cortical blood flow has been shown to remain unaltered (Foreman et al. 1976; Manohar, 1986, 1987; Manohar & Goetz, 1998) or increase (Gross et al. 1980) during exercise, while cerebellar flow has been shown to be elevated during locomotion (Foreman et al. 1976; Gross et al. 1980; Manohar, 1986, 1987; Manohar & Goetz, 1998). In these studies, however, blood flow to relatively few other regions of the brain was measured, and these regions were not always associated with a particular function. Therefore, the purpose of this study was to determine (1) whether locomotor exercise alters brain blood flow distribution in regions associated with motor and sensory control, the maintenance of equilibrium, cardiorespiratory control, hearing, olfaction and vision, and (2) whether regional brain blood flow is modified by exercise of different intensities. We hypothesized that blood flow would be elevated during exercise in those areas related to motor and sensory function, cardiorespiratory regulation, and balance, but not to regions related to the special senses (hearing, smell and vision). Based on the previous study of total brain blood flow during exercise in humans (Thomas et al. 1989), we further hypothesized that regional flows would not vary with exercise intensity.
METHODS
The methods employed in this study were approved by the Institutional Animal Care and Use Committee. The investigation conforms with the National Institutes of Health (NIH) Guide for the Care and Use of Laboratory Animals (DHHS Publication No. (NIH) 85-23, Revised 1985, Office of Science and Health Reports, Bethesda, MD 20892, USA).
Animal care and training
Eight female miniature swine (20–25 kg, 5–6 months old) of Pitman-Moore strain were housed individually in a room maintained at 23 ± 2 °C with a 12 h light:12 h dark cycle. The animals underwent an exercise habituation program on a motor-driven treadmill designed to teach them to run at speeds up to those eliciting maximal oxygen consumption (). After the first several days of treadmill familiarization, the animals performed the exercise sessions with a mask positioned for determination of O2 using an open-circuit system that has been previously described in detail (Fedak et al. 1981; Norton et al. 1989). Exercise sessions initially consisted of continuous running for 3 min each at progressively increasing speeds (1.6 km h−1 increments) from 3.2 km h−1 up to the speed that the pig could not maintain for the 3 min period. With 10–15 days of treadmill habituation, the animals were able to attain and maintain the speed that elicited . In two pigs, there was no change in O2 when treadmill speed was increased from 16.2 to 17.1 km h−1, and thus, was considered to be elicited at 16.2 km h−1 in these animals. In the remaining six animals, there was no change in O2 when treadmill speed was increased from 17.1 to 19.4 km h−1, indicating that was achieved at 17.1 km h−1.
Thoracic surgery was then performed for catheter placement (see Surgical procedures). After 7–12 days of recovery, the pigs continued their exercise program, starting with 5–10 min of walking per day until they were again able to complete the daily regimen to as described above. Approximately 3–5 weeks elapsed between surgery and the time the animals could again achieve . At the time of the experiment, pig body mass remained at 20–25 kg.
Surgical procedures
The pigs were fasted overnight, and the following morning were immobilized with an intramuscular injection of ketamine hydrochloride (35 mg kg−1). A catheter was then inserted in an ear vein and an initial dose of pentobarbitone sodium (5–8 mg kg−1) administered. Throughout the remainder of the surgical procedure (2–3 h) pentobarbitone sodium was administered through this catheter as required (usually a total of 20–30 mg kg−1). The animals were instrumented via a midsternal thoracotomy while under general anaesthesia as previously described (Armstrong et al. 1987; Laughlin et al. 1989). Silastic catheters were positioned in the right and left atria through the respective auricular appendages (catheter size: 1.6 mm i.d., 3.13 mm o.d.) and in the descending aorta via the right and left internal thoracic arteries (catheter size: 1.0 mm i.d., 2.13 mm o.d.). Catheter tips were located 8–10 cm below the junction of the aorta and the left subclavian artery. The four catheters were passed subcutaneously and externalized on the dorsum above the cervical vertebrae and filled with heparin (100 u ml−1). The pigs were administered broad-spectrum antibiotics (Tylan) for 4–7 days during recovery. As indicated above, the animals began walking on the treadmill 7–12 days after surgery.
Experimental protocol
On the day of the experiment the pigs were instrumented as follows: (1) electrocardiogram electrodes were positioned; (2) a colonic probe was positioned for monitoring core temperature; (3) a mask was positioned for measurement of O2; (4) an extension catheter was attached to one of the internal thoracic artery catheters for monitoring blood pressure and for withdrawing arterial blood samples for gas and metabolite analysis; (5) an extension catheter was attached to the left atrial catheter for microsphere infusion; and (6) an extension catheter was attached to the other internal thoracic artery for withdrawal of the reference blood samples for blood flow calculations. After the pigs stood on the treadmill for approximately 5 min following instrumentation, pre-exercise heart rate, arterial pressure, O2 and colonic temperature were recorded, blood samples were obtained for gas and metabolite analysis, and microspheres were infused for brain blood flow measurements. The treadmill was then started, and the pigs walked for 5 min at 3.2 km h−1 to warm up. Treadmill speed was then increased to 11.2 km h−1 (the speed determined to produce ≈70 %) for 5 min and the same measurements taken during pre-exercise (heart rate, arterial pressure, O2, colonic temperature, blood samples, and brain blood flow distribution using a different radiolabelled microsphere) were made between 3 and 5 min of exercise, by which time O2 had attained a steady state. Treadmill speed was then returned to 3.2 km h−1 and the animals walked for 5 min before speed was increased to 17.6 km h−1, which was at or just above for all of the animals. All samples and measurements were again made between 3 and 5 min of exercise at this intensity. After completion of the experiment the pigs were administered heparin (400 U kg−1) followed by pentobarbitone (35 mg kg−1) through the right or left atrial catheter. Instrumentation and catheter extensions were detached and the pigs were killed by exsanguination. The brain was removed from the skull, detaching cranial nerves and the spinal cord, and further sectioned into distinct regions as described below. The samples were weighed, placed into counting vials, and counted in a gamma counter (Packard Auto-Gamma 5780). Blood flows were computed from counts per minute and tissue wet weights with an IBM PC. To assure accurate determination of tissue blood flow, samples containing less than 200 microspheres were excluded from the study. This resulted in seven tissues having a sample size of four or five (see Table 2).
Table 2. Regional cerebral blood flow and vascular resistance at rest and during submaximal and maximal exercise.
| Blood flow (ml min−1 (100 g)−1) | Vascular resistance (mmHg ml−1 min (100 g)) | |||||
|---|---|---|---|---|---|---|
| Pre-exercise | 70 %O2,max
|
100 %O2,max
|
Pre-exercise | 70 %O2,max
|
100 %O2,max
|
|
| Olfactory bulb | ||||||
| Right§ | 56. ± 11 | 73. ± 14 | 65. ± 9 | 2.41 ± 0.31 | 2.19 ± 0.24 | 2.55 ± 0.34 |
| Left§ | 63. ± 11 | 72. ± 15 | 63. ± 6 | 1.90 ± 0.24 | 2.11 ± 0.36 | 2.35 ± 0.18 |
| Rhinencephalon | ||||||
| Right | 44. ± 3 | 44. ± 3 | 42. ± 3 | 2.67 ± 0.13 | 3.32 ± 0.24* | 3.76 ± 0.24* |
| Left | 42. ± 3 | 45. ± 4 | 47. ± 5 | 2.96 ± 0.18 | 3.32 ± 0.28 | 3.63 ± 0.32* |
| Frontal cortex | ||||||
| Right dorsal | 67. ± 5 | 69. ± 7 | 71. ± 7 | 1.86 ± 0.14 | 2.18 ± 0.23* | 2.29 ± 0.19* |
| Left dorsal | 68. ± 4 | 68. ± 7 | 69. ± 4 | 1.82 ± 0.11 | 2.22 ± 0.20* | 2.28 ± 0.14* |
| Right ventral | 59. ± 5 | 66. ± 8 | 66. ± 8 | 2.13 ± 0.12 | 2.31 ± 0.22 | 2.53 ± 0.23* |
| Left ventral | 59. ± 4 | 62. ± 6 | 58. ± 5 | 2.10 ± 0.11 | 2.41 ± 0.21 | 2.76 ± 0.21* |
| Parietal cortex | ||||||
| Right rostrodorsal | 66. ± 4 | 73. ± 7 | 72. ± 7 | 1.90 ± 0.13 | 2.07 ± 0.22 | 2.26 ± 0.21 |
| Left rostrodorsal | 61. ± 5 | 68. ± 5 | 72. ± 5 | 2.08 ± 0.21 | 2.15 ± 0.15 | 2.20 ± 0.18 |
| Right rostroventral | 56. ± 5 | 62. ± 6 | 62. ± 6 | 2.22 ± 0.19 | 2.42 ± 0.18 | 2.61 ± 0.27* |
| Left rostroventral | 49. ± 4 | 52. ± 7 | 54. ± 5 | 2.51 ± 0.18 | 2.99 ± 0.28* | 2.95 ± 0.27* |
| Right caudodorsal | 71. ± 7 | 96 ± 12* | 89 ± 10* | 1.85 ± 0.22 | 1.63 ± 0.20 | 1.88 ± 0.18 |
| Left caudodorsal | 69. ± 5 | 85 ± 8* | 86 ± 7* | 1.82 ± 0.15 | 1.77 ± 0.20 | 1.91 ± 0.24 |
| Right caudoventral | 67. ± 5 | 84 ± 7* | 83 ± 9* | 1.90 ± 0.14 | 1.79 ± 0.17 | 2.02 ± 0.23 |
| Left caudoventral | 63. ± 5 | 72 ± 7* | 73 ± 6* | 2.00 ± 0.16 | 2.08 ± 0.19 | 2.20 ± 0.18 |
| Temporal cortex | ||||||
| Right | 47. ± 5 | 52. ± 7 | 56. ± 10 | 2.58 ± 0.21 | 2.96 ± 0.37 | 3.20 ± 0.27* |
| Left | 44. ± 4 | 44. ± 3 | 45. ± 5 | 2.86 ± 0.28 | 3.34 ± 0.22 | 3.60 ± 0.45* |
| Occipital cortex | ||||||
| Right dorsal | 68. ± 5 | 86 ± 9* | 89 ± 8* | 1.85 ± 0.15 | 1.78 ± 0.18 | 1.82 ± 0.18 |
| Left dorsal | 72. ± 6 | 92 ± 8* | 89 ± 7* | 1.79 ± 0.20 | 1.60 ± 0.13 | 1.78 ± 0.15 |
| Right ventral | 66. ± 4 | 80. ± 7 | 77. ± 8 | 1.87 ± 0.10 | 1.86 ± 0.18 | 2.10 ± 0.20 |
| Left ventral | 60. ± 3 | 73. ± 6 | 68. ± 7 | 2.04 ± 0.11 | 2.04 ± 0.18 | 2.45 ± 0.24 |
| Cingulate gyrus | ||||||
| Right | 44. ± 6 | 50. ± 5 | 57. ± 6 | 3.05 ± 0.46 | 3.01 ± 0.30 | 2.85 ± 0.31 |
| Left | 50. ± 4 | 51. ± 6 | 52. ± 4 | 2.47 ± 0.18 | 2.93 ± 0.15* | 3.02 ± 0.32* |
| Corpus callosum§ | 24. ± 3 | 22. ± 3 | 26. ± 4 | 5.44 ± 0.57 | 6.90 ± 0.84* | 6.46 ± 0.73* |
| Hippocampus | ||||||
| Right | 41. ± 4 | 53 ± 5§ | 54 ± 6§ | 3.11 ± 0.28 | 2.82 ± 0.23 | 3.03 ± 0.27 |
| Left | 41. ± 4 | 52. ± 7 | 47. ± 5 | 3.14 ± 0.35 | 2.91 ± 0.33 | 3.38 ± 0.25 |
| Fornix | 21. ± 4 | 26. ± 8 | 28. ± 7 | 7.69 ± 2.12 | 10.86 ± 2.59* | 10.21 ± 2.33* |
| Caudate nucleus | ||||||
| Right | 62. ± 7 | 64. ± 7 | 68. ± 4 | 2.32 ± 0.50 | 2.45 ± 0.31 | 2.31 ± 0.13 |
| Left | 68. ± 8 | 76. ± 4 | 76. ± 4 | 1.99 ± 0.29 | 1.91 ± 0.13 | 2.06 ± 0.11 |
| Thalamus | ||||||
| Right | 49. ± 4 | 60 ± 6* | 66 ± 6* | 2.58 ± 0.19 | 2.52 ± 0.27 | 2.44 ± 0.23 |
| Left | 48. ± 4 | 61 ± 8* | 62 ± 6* | 2.57 ± 0.18 | 2.71 ± 0.36 | 2.61 ± 0.28 |
| Lateral geniculate body§ | 43. ± 9 | 77 ± 7* | 77 ± 7* | 3.88 ± 1.53 | 1.94 ± 0.17* | 1.98 ± 0.19* |
| Pineal body§ | 68. ± 17 | 69. ± 5 | 56. ± 14 | 2.14 ± 0.48 | 2.12 ± 0.14 | 3.09 ± 0.97 |
| Optic chiasm§ | 13. ± 4 | 15. ± 3 | 12. ± 2 | 13.5 ± 6.0 | 12.3 ± 3.6 | 13.4 ± 3.0 |
| Hypothalamus | 41. ± 7 | 57. ± 14 | 56. ± 13 | 3.64 ± 0.63 | 3.06 ± 0.37 | 3.37 ± 0.53 |
| Pituitary gland§ | 104. ± 13 | 71. ± 17 | 67. ± 3 | 1.16 ± 0.13 | 2.50 ± 0.67 | 2.26 ± 0.17 |
| Cerebellum | ||||||
| Right hemisphere | 56. ± 3 | 78 ± 6* | 81 ± 4* | 2.17 ± 0.09 | 1.86 ± 0.12* | 1.92 ± 0.11* |
| Left hemisphere | 55. ± 4 | 82 ± 6* | 80 ± 5* | 2.24 ± 0.12 | 1.79 ± 0.13* | 1.87 ± 0.11* |
| Vermis, anterior region | 71. ± 5 | 104 ± 10* | 123 ± 9*† | 1.75 ± 0.12 | 1.44 ± 0.12* | 1.28 ± 0.08* |
| Vermis, dorsal region | 65. ± 5 | 109 ± 8* | 135 ± 7*† | 1.93 ± 0.15 | 1.34 ± 0.09* | 1.12 ± 0.05*† |
| Vermis, ventral region | 67. ± 8 | 101 ± 15* | 118 ± 15* | 2.05 ± 0.33 | 1.57 ± 0.20* | 1.38 ± 0.13* |
| Floccular lobe | 70. ± 5 | 108 ± 15* | 102 ± 6* | 1.77 ± 0.14 | 1.46 ± 0.22 | 1.52 ± 0.12 |
| Midbrain | 45. ± 5 | 55 ± 6* | 57 ± 5* | 3.02 ± 0.46 | 2.83 ± 0.31 | 2.82 ± 0.24 |
| Inferior colliculi | 86. ± 9 | 102. ± 12 | 99. ± 9 | 1.64 ± 0.23 | 1.49 ± 0.14 | 1.63 ± 0.15 |
| Superior colliculi | 71. ± 7 | 92 ± 7* | 90 ± 6* | 1.86 ± 0.26 | 1.59 ± 0.11 | 1.70 ± 0.19 |
| Pons | 38. ± 3 | 47 ± 5* | 48 ± 5* | 3.39 ± 0.37 | 3.22 ± 0.37 | 3.34 ± 0.35 |
| Medulla | ||||||
| Cochlear nuclei | 61. ± 9 | 77. ± 8 | 69. ± 10 | 2.27 ± 0.31 | 1.94 ± 0.16 | 2.53 ± 0.35 |
| Vestibular nuclear area | 81. ± 8 | 99 ± 4* | 117 ± 6*† | 1.55 ± 0.15 | 1.45 ± 0.06 | 1.30 ± 0.08 |
| Right rostral | 38. ± 4 | 51 ± 6* | 52 ± 6* | 3.44 ± 0.44 | 2.99 ± 0.37 | 3.13 ± 0.38 |
| Left rostral | 37. ± 4 | 53 ± 7* | 55 ± 8* | 3.51 ± 0.40 | 2.85 ± 0.35* | 2.91 ± 0.30 |
| Right caudal | 34. ± 4 | 45. ± 5 | 55 ± 4* | 3.79 ± 0.43 | 3.34 ± 0.36 | 2.86 ± 0.17* |
| Left caudal | 31. ± 5 | 47 ± 5* | 51 ± 3* | 5.26 ± 0.96 | 3.17 ± 0.30* | 3.05 ± 0.22* |
| Pyramidal tract | 15. ± 3 | 26. ± 4 | 25. ± 5 | 12.00 ± 4.60 | 6.51 ± 1.27 | 8.02 ± 2.01 |
| Cervical spinal cord | 21. ± 3 | 33 ± 5* | 37 ± 4* | 7.19 ± 1.35 | 4.88 ± 0.58* | 4.42 ± 0.56* |
Values are means ± S.E.M. (n = 8;
n = 4 or 5).
Significantly different from Pre-exercise;
significantly different from 70 % O2,max (P < 0.05);
P = 0.056.
Blood flow measurements
Blood flows were measured with radiolabelled microspheres (New England Nuclear) with a mean diameter of 15 μm. The isotope labels used were 57Co, 95Nb, 45Sc, 113Sn and 85Sr. The microspheres were suspended in physiological saline with 0.01 % Tween-80, and each infusion consisted of 5 million spheres in 1.0 ml. The microsphere suspensions were placed in a sonicator bath for 10 min and mixed on a vortex for 1 min immediately before infusion. Each infusion was performed as follows: (1) the reference blood sample withdrawal was started at a rate of 3.69 ml min−1 with a Harvard infusion/ withdrawal pump from one of the catheters in the descending aorta; (2) the 1.0 ml microsphere suspension was then infused into the left atrial catheter; (3) 10.0 ml of warm (37 °C) saline was slowly (≈20 s) infused through the left atrial catheter to flush the microspheres into the heart; and (4) the reference sample withdrawal continued for 2 min after the saline infusion was completed.
Tissue sampling
The brain was sectioned into regions containing the right and left olfactory bulbs, right and left cerebellar hemispheres (which included the cortex, white matter and deep cerebellar nuclei), cerebellar vermis lobules 1–5 (anterior part), lobules 6–8 (dorsal part) and lobules 9–10 (ventral part), floccular lobe of the cerebellum, cochlear nuclei, right and left rostral and right and left caudal divisions of the medulla, vestibular nuclear area of the medulla, pons, midbrain, hypothalamus, right and left thalamus, cervical spinal cord, pyramid, pineal body, pituitary gland, inferior and superior colliculi (right and left sides combined), lateral geniculate body (right and left sides combined), right and left caudate nucleus, right and left cingulate gyrus, fornix (white matter tract to hippocampus), right and left hippocampus, right and left temporal cortex, right and left ventral and right and left dorsal portions of the occipital cortex, right and left rhinencephalon (includes olfactory tubercle and olfactory cortex), right and left ventral and right and left dorsal portions of the frontal cortex, right and left caudoventral, right and left caudodorsal, right and left rostroventral, and right and left rostrodorsal portions of the parietal cortex, optic chiasm and corpus callosum. The right and left portions of the superior colliculi and lateral geniculate body were combined so that > 200 microspheres would be present in these tissue samples.
Cardiovascular and temperature measurements
Heart rates were continuously monitored with a Gould Bio-Tach amplifier and 2400 chart recorder. Mean and pulsatile aortic pressures were recorded continuously on the Gould recorder from the aortic catheter (via an internal thoracic artery) with an Ailtech pressure transducer. Regional vascular resistance was calculated by dividing mean arterial pressure by the tissue flow. Colonic temperature was continuously recorded from a temperature probe placed ≈15 cm into the colon.
Blood gases and metabolites
Blood samples for arterial O2 partial pressure (Pa,O2), arterial CO2 partial pressure (Pa,CO2), pH and lactate determinations were collected in heparinized plastic syringes and immediately placed in an ice slush. Pa,O2, Pa,CO2 and pH were measured directly in an aliquot of each blood sample with separate electrodes in an automated analyser (IL 1302); HCO3− was calculated. Plasma lactate concentration for each blood sample was measured in an automated analyser (Dupont ACA). Blood gas and lactate determinations were made within 1 h of collection.
Separate arterial blood samples for haemoglobin determination were taken in plastic syringes and rapidly transferred to B-D Vacutainer tubes containing EDTA as anticoagulant. Haemoglobin concentrations were measured (Ortho ELT-8/ds) using standard cyanmethaemoglobin methods.
Statistical analysis
For each variable, a one-way repeated measures analysis of variance was used to compare mean values across conditions (pre-exercise vs. 70 %vs.). Pairwise multiple comparison procedures (Student-Newman-Keuls method) were used to determine the significance of differences among means. For all analyses, the 0.05 level was used to indicate statistical significance.
RESULTS
All eight pigs included in this study had recovered from catheter instrumentation surgery sufficiently to attain the level of maximal oxygen consumption measured prior to surgery. Blood flow experiments were scheduled only after post-surgical recovery of aerobic power was clearly demonstrated. The resting O2 for the animals was ≈7.5 ml min−1 kg−1. During the pre-experimental exercise sessions, O2 increased progressively with increasing running speed up to speeds of 16-17.6 km h−1, depending on the individual animal. Plateaus in the plot of O2 as a function of running speed were obtained in all animals, and all pigs were at exercise intensities equal to or above that necessary to produce by the time they were running at 17.6 km h−1. The running speeds used in the experiments were chosen based on these pre-surgery O2-exercise intensity relationships. Treadmill speeds of 11.2 and 17.6 km h−1 elicited an oxygen consumption of 42 ± 2 and 60 ± 3 ml min−1 kg−1, respectively, which corresponded to exercise at 70 and 100 %, respectively, for these pigs.
Blood pressure and heart rate
Mean aortic blood pressure (Table 1) was 121 ± 2 mmHg at rest and was elevated 17 and 26 % during submaximal and maximal exercise, respectively. Heart rate was 89 ± 12 beats min−1 during pre-exercise standing and increased 163 and 210 % during exercise at 70 and 100 %, respectively. Mean arterial pressure and heart rate during maximal exercise was higher than that during submaximal exercise.
Table 1. Systemic cardiorespiratory variables and colonic temperature in miniature swine at rest and during submaximal and maximal xercise.
| Pre-exercise | 70 %O2,max
|
100 %O2,max
|
|
|---|---|---|---|
| Mean arterial pressure (mmHg) | 121. ± 2 | 141 ± 4* | 153 ± 3*† |
| Heart rate (beats min−1) | 89. ± 9 | 234 ± 12* | 276 ± 17*† |
| Pa,O2 (mmHg) | 104. ± 6 | 108. ± 8 | 107. ± 9 |
| Pa,CO2 (mmHg) | 39. ± 3 | 35. ± 1 | 26 ± 5* |
| pH | 7.38 ± 0.02 | 7.40 ± 0.03 | 7.25 ± 0.04*† |
| [HCO3−] (mM) | 23. ± 2 | 23. ± 2 | 10 ± 2*† |
| [Lactate] (mM) | 3. ± 1 | 8 ± 1* | 21 ± 2*† |
| [Haemoglobin] (g (100 ml)−1) | 11.3 ± 1 | 12.0 ± 1 | 12.3 ± 1 |
| O2 saturation (%) | 96. ± 1 | 96. ± 1 | 97. ± 1 |
| Body temperature (°C) | 38.0 ± 0.3 | 39.5 ± 0.5* | 40.4 ± 0.4*† |
Values are means ± S.E.M. (n = 8).
Significantly different from Pre-exercise;
significantly different from 70 %O2,max (P < 0.05).
Blood gases and metabolites
Pa,O2 was 104 ± 6 mmHg at rest and was not significantly altered by exercise (Table 1). Pa,CO2 remained unchanged during submaximal exercise, but was lower than that at rest during maximal exertion. Both arterial blood pH and [HCO3−] were unaltered during submaximal exercise, but were lower than that at rest and submaximal running during exercise at . Arterial blood lactate concentration was increased above that at rest during submaximal exercise and was further elevated during maximal exertion. Arterial haemoglobin concentration and oxygen saturation did not change during exercise.
Colonic temperature
Resting core temperature was 38.0 ± 0.3 °C (Table 1). Temperature was elevated above that at rest during submaximal intensity exercise, and further increased during maximal intensity exercise.
Blood flow
Total brain blood flow increased from 55 ± 4 ml min−1 (100 g)−1 at rest to 68 ± 6 ml min−1 (100 g)−1 during submaximal exercise and 69 ± 5 ml min−1 (100 g) −1 during maximal exercise (Fig. 1). Of the 55 brain regions tested, 23 showed elevated perfusion during exercise at 70 % and 24 had higher blood flow during running at 100 % (Table 2). Three regions, the anterior and dorsal lobules of the cerebellar vermis and the vestibular nuclear area, had higher flows during maximal exercise than during submaximal running.
Figure 1. Total brain blood flow and vascular resistance at rest and during submaximal and maximal exercise.

Values are means ± s.e.m. (n = 8). * Significantly different from Pre-exercise (P < 0.05).
Vascular resistance
Total brain vascular resistance at rest was 2.28 ± 0.17 mmHg ml−1 min (100 g) and remained unchanged during exercise (Fig. 1). Regional changes in vascular resistance during exercise did, however, occur (Table 2). Vascular resistance during submaximal and maximal exercise was lower than at rest in the lateral geniculate body, the right and left cerebellar hemispheres, the anterior, dorsal and ventral cerebellar vermis lobules, the left caudal medulla, and the cervical spinal cord. Resistance during submaximal exercise in the left rostral medulla was also lower than that at rest, and resistance during maximal, but not submaximal exercise was lower in the right caudal medulla. Conversely, vascular resistance was higher than at rest during submaximal and maximal exertion in the right rhinencephalon, right and left dorsal frontal cortex, left rostroventral parietal cortex, left cingulate gyrus, corpus callosum, and fornix, and vascular resistance was higher during maximal exercise than at rest in the left rhinencephalon, right and left ventral frontal cortex, right rostroventral parietal cortex, and the right and left temporal cortex.
DISCUSSION
The present study demonstrates that blood flow to the brain increases during submaximal and maximal exercise (Fig. 1). The increase, however, is not uniformly distributed throughout the brain. As has previously been shown by others (Foreman et al. 1976; Manohar, 1986, 1987; Manohar & Goetz, 1998), there is no change in the perfusion rate to cortical areas of the cerebrum associated with motor and somatosensory function during locomotor exercise. This study extends these observations to indicate that blood flow to regions of the brain related to hearing and smell are also unaltered by physical exertion. However, perfusion is elevated to regions of the brain that are related to locomotion (subcortical locomotor regions), the maintenance of equilibrium, cardiorespiratory control and vision. Furthermore, the data indicate that blood flow increases as a function of exercise intensity to several areas of the brain associated with integrating sensory input and motor output (anterior and dorsal cerebellar vermis) and the maintenance of equilibrium (vestibular nuclear area of medulla).
Total brain blood flow in humans at rest is approximately 50–60 ml min−1 (100 g)−1 (Thomas et al. 1989; Rowell, 1993), and during intense exercise, perfusion has been shown to increase by 18–58 % (Hedlund et al. 1962; Thomas et al. 1989). Results from the present study indicate that both the resting perfusion rate and the magnitude of elevation of brain blood flow during exercise in miniature swine (Fig. 1) are similar to those of man. This suggests the miniature swine may be an appropriate animal model of humans for investigation of cerebral circulatory responses to physical exertion.
The present study, as well as previously published works (e.g. Olesen, 1971; Foreman et al. 1976; Roland et al. 1977; Halsey et al. 1979; Gross et al. 1980; Manohar, 1987; Thomas et al. 1989; Manohar & Goetz, 1998), relates regional changes in cerebral blood flow and vascular resistance to the activity and function of that region. This is based on the classic theory that local metabolism modulates local perfusion and vascular resistance via release of vasoactive substances. In the case of the brain and spinal cord, local perfusion and vascular tone are presumed to be coupled to the metabolic activity of the surrounding neurons. The present study and that of Iwamoto et al. (1996) support this view. Iwamoto et al. (1996) assessed brain neuronal activity via a Fos protein labelling technique in rats following prolonged moderate-intensity treadmill exercise and found an elevated activity in such areas as the subcortical locomotor regions, superior colliculus, midbrain, pons, rostral and caudal ventrolateral medulla, and the medial vestibular nuclei. Although the present study and that of Iwamoto et al. (1996) differ in several respects, such as animal species used and duration of exercise (acute vs. prolonged), there is considerable agreement among brain regions investigated in both studies showing increased neural activity and increased perfusion.
In addition to local metabolism, previous work has also addressed the possibility that systemic factors modulate cerebral perfusion (Foreman et al. 1976; Gross et al. 1980; Manohar, 1986; Manohar & Goetz, 1998). For example, elevation in arterial pressure, such as occurs during exercise, functions to induce a cerebral autoregulatory vasoconstriction (Heistad & Kontos, 1983). In addition, exercise-induced hypocapnia and elevations in sympathetic nerve activity could also serve to elevate cerebral vascular resistance (Heistad & Kontos, 1983). In contrast to these vasoconstrictor stimuli, it is possible that systemic lactic acidosis could induce a vasodilatation to increase cerebral blood flow. However, it appears that the cerebral vasculature is relatively impermeable to circulating hydrogen ions, whereas alterations of pH in the cerebrospinal fluid via enhanced brain tissue metabolism may mediate cerebral vasodilatation (Foreman et al. 1976; Heistad & Kontos, 1983). In the present study, the most profound cerebral exercise hypaeremia occurred during moderate intensity exercise when arterial pH was similar to that at rest. These data suggest that increases in brain blood flow during moderate and intense exercise are unrelated to reductions in arterial pH, which only occurred during maximal exercise. Therefore, the localized increases in blood flow found in the present study do not appear to be mediated by circulating vasodilatory factors, but rather appear to be related to local increases in neuronal activity and O2 consumption (Heistad & Kontos, 1983).
To gain further insight into neuronal activation during exercise, it is important to consider not only the relationship of regional changes in neural activity and perfusion rate, but also that with vascular resistance (Fig. 2). In the present study, regional vascular resistance increased, decreased or remained unchanged during exercise. The regional increases in vascular resistance reflect a predominant vasoconstrictor response, presumably an autoregulatory constriction, sufficient to maintain perfusion in the face of an elevated perfusion pressure (Kontos et al. 1978) with little or no change in local neuronal activity (Fig. 2, left column; Fig. 3, frontal cortex). The other extreme is the regional decreases in vascular resistance during exercise, where there is a putative increase in neuronal activity and a corresponding release of metabolites sufficient to overcome vasoconstrictor influences and induce a net vasorelaxation (Fig. 2, right column; Fig. 3, spinal cord). The third response pattern was for blood flow to increase during exercise while vascular resistance remained unchanged (Fig. 2, centre column; Fig. 3, midbrain). In fact, of the 24 regions where blood flow increased during exercise, 15 had no change in vascular resistance. Total brain blood flow and vascular resistance also followed this pattern (Fig. 1). Several mechanisms could explain this response. First, it is possible that there is little autoregulatory control of blood flow in these regions, and that blood flow passively increases with the elevated perfusion pressure during exercise. This possibility seems unlikely given there is no evidence currently in the literature to suggest that global or regional autoregulatory control of brain blood flow is lacking. A second possibility is that two or more opposing and offsetting vasoactive stimuli are present in these regions during exercise. As illustrated in the middle portion of Fig. 2, there may be an autoregulatory vasoconstriction in response to the increased perfusion pressure, and simultaneously an equivalent vasodilatory stimulus resulting from increased neuronal metabolite release. The net effect is that vascular resistance remains unchanged. In this scenario, the increase in blood flow is driven by the elevation in perfusion pressure, but this is not a passive response. Rather, the increase in oxygen delivery appears to be matched to an increase in local metabolism with no net change in vascular resistance.
Figure 2. Schematic illustration relating exercise-induced changes in regional neuronal activity to regional blood flow.
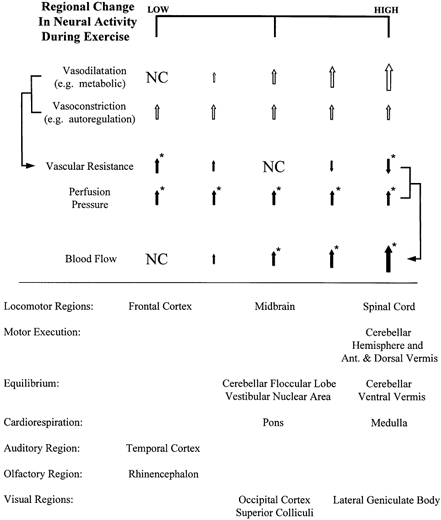
Upper half: local vasodilator substance release is presumed to be proportional to the regional change in neuronal activity. Regional vascular resistance is the net result of vasodilator stimuli and vasoconstrictor influences, whereas regional blood flow is the net result of changes in vascular resistance and the increase in perfusion pressure. In this scheme, blood flow rate rather than vascular resistance best reflects the change in neural activity during exercise. Open arrows represent putative responses; filled arrows represent observed responses; NC, no change. * Significant observed response (P < 0.05). Lower half: regions of the brain exhibiting relatively low (left column), intermediate (centre column) or high (right column) changes in neural activity during exercise. Categorization is based on the pattern of blood flow and vascular resistance during exercise.
Figure 3. Percentage change in blood flow and vascular resistance from rest to exercise at 100 % in the frontal cortex, midbrain and cervical spinal cord.

Based on blood flow and vascular resistance alterations, these regions illustrate the three primary patterns shown in Fig. 2, indicating a relatively low, intermediate and high change in neural activity with exercise, respectively.
Control of skeletal muscle contraction during locomotion occurs at various levels in the central nervous system, including the motor cortex, hypothalamic locomotor region, mesencephalic locomotor region, pontomedullary locomotor strip and the spinal cord (Armstrong, 1986; Rossignol, 1996). Perfusion of regions associated with the motor (dorsal and ventral frontal cortex) and somatic sensory (rostroventral and rostrodorsal parietal cortex) cortices and the pyramidal tract was unaltered by dynamic exercise. In addition, these cortical regions demonstrate elevations in vascular resistance during exercise (Table 2). The observation of a lack of change in cortical blood flow during locomotory exercise corroborates previous work in animals (Foreman et al. 1976; Manohar, 1986, 1987; Manohar & Goetz, 1998). However, these findings are in contrast to those in humans where single leg, arm or hand movement evokes focal increases in cortical flow (Olesen, 1971; Roland et al. 1977; Halsey et al. 1979; Friedman et al. 1991, 1992; Fink et al. 1995). The disparity of results between the animal and human studies could result from differences in species, techniques used to assess changes in cortical blood flow, or the precision used to isolate localized areas of interest. However, it is also possible that differences in cortical blood flow response to exercise result from differences in the exercise employed and how conditioned the subjects were to performing the exercise. For example, the exercise of the present and previous animal studies (Foreman et al. 1976; Manohar, 1986, 1987; Manohar & Goetz, 1998) consisted of steady-state treadmill running at a constant speed in a fixed direction on a level surface. These stereotypical motor patterns of locomotion stored in subcortical brain areas do not appear to require sustained cortical activation and higher control of muscle contractions. Exercise-induced increases in blood flow to the midbrain, pons, rostral and caudal medulla and spinal cord (Table 2) are consistent with the assertion that subcortical locomotor regions primarily control treadmill running. Conversely, less conditioned patterns of movement may require greater cortical activation and perfusion. This notion is supported by the findings of Halsey et al. (1979), who reported that cortical blood flow of right-handed individuals does not increase during right hand movements, but is elevated by similar movements of the left hand.
Previous work has also shown that cerebellar perfusion is elevated during dynamic exercise (Foreman et al. 1976; Gross et al. 1980; Manohar, 1986, 1987; Manohar & Goetz, 1998). However, in the present study, flow was shown to increase and vascular resistance to decrease in regions specifically associated with motor planning (right and left hemisphere) and motor execution (anterior and dorsal vermis) (Brooks & Thach, 1981).
In addition to planning and coordinating limb and body movements, the cerebellum is also involved in the control of equilibrium. In this, the ventral vermis and floccular lobe, collectively called the vestibulocerebellum, and the vestibular nuclei of the medulla are the primary recipients of vestibular nerve projections for reflexive feedback control of balance (Goldberg & Fernandez, 1984; Shimazu & Shinoda, 1992). The importance of the vestibulocerebellum has been demonstrated in animal studies where the destruction of this structure severely alters the animals’ gait during walking (Dow, 1938; Brooks & Thach, 1981). The present study also demonstrates the importance of these neural structures during locomotion, as indicated by increases in blood flow and decreases in vascular resistance (ventral vermis) during exercise.
The sustained rhythmic contraction of muscles during locomotion necessitates activation of the cardiorespiratory system to elevate muscle perfusion in order to meet the higher oxygen demand of the active muscles. The skeletal muscles of miniature swine receive a total of approximately 1 l min−1 of blood at rest (Armstrong et al. 1987). This increases to approximately 7 l min−1 during exercise at 67 % and 8.5 l min−1 during running at 100 %, the latter representing 85 % of cardiac output. The increase in blood flow is accomplished through local dilatation in the skeletal muscle and elevations in arterial perfusion pressure (Delp & Laughlin, 1998). Correspondingly, ventilation is elevated at the onset of exercise to maintain Pa,O2, Pa,CO2, and arterial pH constant (Rowell, 1993). Neural signals mediating both the rapid rise in arterial pressure and ventilation appear to originate from supraspinal locomotor sites (premotor cortex, posterior and dorsal hypothalamus, and midbrain) that have parallel neuronal circuits controlling the locomotor and cardiorespiratory systems (Eldridge et al. 1985; Feldman & Ellenberger, 1988; Waldrop et al. 1996). Signals from these locomotor sites project to the vasomotor and respiratory areas located in the medulla and pons. During exercise, activation of the vasomotor area results in sympathetically mediated venoconstriction and increased heart rate to elevate cardiac output, and vasoconstriction in the viscera and other inactive tissues to increase vascular resistance (thus elevating arterial pressure), all of which serve to increase blood flow to active muscle (Eldridge et al. 1985; Waldrop et al. 1996; Delp & Laughlin, 1998). Correspondingly, activation of the respiratory area increases the rate of respiration. In addition, the vasomotor and respiratory neural circuits receive afferent sensory input for mediating the exercise pressor reflex response and exercise hyperpnoea, respectively (Kaufman & Forster, 1996). Thus, the elevations in medullary and pontine perfusion and diminutions of medullary vascular resistance during submaximal and maximal exercise observed in the present study are consistent with increased activation of the vasomotor and respiratory areas in mediating appropriate cardiorespiratory responses to exercise. Exercise-induced elevations in medullary and pontine blood flow have previously been reported in ponies (Manohar, 1986), and recent work in humans has demonstrated that perfusion of cortical regions (left insula) associated with cardiovascular regulation is elevated during active, but not passive, cycling exercise (Williamson et al. 1997).
One purpose of this study was to determine whether blood flow to regions controlling the special senses (hearing, smell and vision) is modified by exercise. Based on the previous work of Gross et al. (1980), who reported that perfusion of the visual cortex in dogs was unchanged during exercise, we hypothesized that blood flow would not be altered to regions involved in the integration of visual, auditory or olfactory stimuli. In support of this hypothesis, we found that perfusion of the cochlear nuclei, inferior colliculi and temporal cortex, which are important components of the central auditory pathway (Aitkin et al. 1984), and blood flow to the olfactory bulbs and rhinencephalon, which are central components of the olfactory system (Doty, 1994), were not elevated during exercise. On the contrary, vascular resistances in the temporal cortex and rhinencephalon were elevated during exercise (Table 2). These data indicate that auditory and olfactory neural activities are not heightened during dynamic exercise.
Unlike the auditory and olfactory pathways, the activity of the visual system appears to be elevated during dynamic exercise. The increases in blood flow to the primary visual cortex, superior colliculi and lateral geniculate body, and the decrease in lateral geniculate vascular resistance indicate that neural activity of the visual system is heightened during dynamic exercise. These results are at odds with that of Gross et al. (1980), who found that blood flow to the canine visual cortex was unaltered during treadmill running. We do not have an explanation to account for this discrepancy, except to suggest that perhaps these investigators sampled the ventral portion of the occipital cortex, a region in which we also found that exercise had no effect on perfusion rate. Alternatively, it is also possible that the activity of the visual system is elevated in pigs during treadmill exercise, but not in dogs. It is our experience in running both miniature swine and dogs on the treadmill that pigs are much more anxiously aware of investigators and their surroundings than are dogs. This apparent heightened awareness may involve activation of the visual system. We are unaware of any other studies in the literature reporting perfusion rates to visual, auditory or olfactory central nervous system structures during exercise.
The transition from rest to moderate intensity exercise elicited substantial alterations in brain perfusion, both in terms of increases in total brain blood flow and regional elevations in flow. However, the transition from moderate to high intensity exercise elicited no further change in total brain perfusion and few additional increases in regional flow. One possible explanation for the lack of change in regional cerebral perfusion with higher intensity exercise is that small discrete alterations in perfusion cannot be detected with the microsphere technique. Another interpretation of the results is that few additional central neural locomotor, cardiorespiratory or sensory adjustments occur with alterations in exercise intensity. Despite the fact that blood flow to most regions of the brain did not vary between the two exercise intensities, there were several notable exceptions. Blood flow to the anterior and dorsal portions of the cerebellar vermis was higher during maximal than submaximal exercise. In addition, the dorsal cerebellar vermis exhibited exercise intensity-dependent decreases in vascular resistance. To our knowledge, these are the first data to indicate that this portion of the cerebellum may be important in executing and coordinating the intensity of muscle movements during whole body dynamic exercise. The only other region of the brain to show intensity-dependent increases in blood flow was the vestibular nuclear area of the medulla. The higher flow to the vestibular nuclei during maximal exercise indicates that the mechanism for maintaining balance with higher intensity exercise is mediated primarily through these vestibular neurons. We are unaware of other studies to corroborate this observation.
In summary, total blood flow to the brain was elevated during submaximal and maximal exercise (Fig. 1). These elevations in total brain blood flow were similar to those reported in humans (Hedlund et al. 1962; Thomas et al. 1989). Blood flow was not locally elevated to cortical regions associated with motor and somatosensory functions during exercise, but was increased to several subcortical areas that are involved in the control of locomotion. Exercise also elevated perfusion to regions of the brain that are related to the maintenance of equilibrium, cardiorespiratory control, and vision, but not to regions related to hearing and smell. Finally, the data indicate that blood flow increases as a function of exercise intensity to several areas of the brain associated with integrating sensory input and motor output (anterior and dorsal cerebellar vermis) and the maintenance of equilibrium (vestibular nuclei).
Acknowledgments
This work was supported by National Institutes of Health grants AM-24572, AM-37098 and HL-36088 and National Aeronautics and Space Administration grant NAG2-1340.
References
- Aitkin LM, Irvine DR F, Webster WR. Central neural mechanisms of hearing. In: Darian-Smith I, editor. Handbook of Physiology, The Nervous System. III. Bethesda, MD, USA: American Physiology Society; 1984. pp. 673–737. section 1. [Google Scholar]
- Armstrong DM. Supraspinal contributions to the initiation and control of locomotion in the cat. Progress in Neurobiology. 1986;26:273–361. doi: 10.1016/0301-0082(86)90021-3. [DOI] [PubMed] [Google Scholar]
- Armstrong RB, Delp MD, Goljan EF, Laughlin MH. Distribution of blood flow in muscles of miniature swine during exercise. Journal of Applied Physiology. 1987;62:1285–1298. doi: 10.1152/jappl.1987.62.3.1285. [DOI] [PubMed] [Google Scholar]
- Brooks VB, Thach WT. Cerebellar control of posture and movement. In: Brooks VB, editor. Handbook of Physiology, The Nervous System, Motor Control. II. Bethesda, MD, USA: American Physiological Society; 1981. pp. 877–946. section 1. [Google Scholar]
- Cooper R, Crow HJ, Walter WG, Winter AL. Variations of occipital blood flow, oxygen availability and the EEG during reading and flicker in man. Electroencephology and Clinical Neurophysiology. 1965;19:315. [Google Scholar]
- Delp MD, Laughlin MH. Regulation of skeletal muscle perfusion during exercise. Acta Physiologica Scandinavica. 1998;162:411–419. doi: 10.1046/j.1365-201X.1998.0324e.x. [DOI] [PubMed] [Google Scholar]
- Doty RL. Handbook of Olfaction and Gustation. New York: Marcel Dekker, Inc; 1994. [Google Scholar]
- Dow RS. Effect of lesions in the vestibular part of the cerebellum in primates. Archives in Neural Psychiatry. 1938;40:500. [Google Scholar]
- Eldridge FL, Millhorn DE, Kiley JP, Waldrop TG. Stimulation by central command of locomotion, respiration and circulation during exercise. Respiratory Physiology. 1985;59:313–337. doi: 10.1016/0034-5687(85)90136-7. [DOI] [PubMed] [Google Scholar]
- Fedak MA, Rome L, Seeherman HJ. One-step N2-dilution technique for calibrating open-circuit VO2 measuring systems. Journal of Applied Physiology. 1981;51:772–776. doi: 10.1152/jappl.1981.51.3.772. [DOI] [PubMed] [Google Scholar]
- Feldman JL, Ellenberger HH. Central coordination of respiratory and cardio-vascular control in mammals. Annual Review of Physiology. 1988;50:593–606. doi: 10.1146/annurev.ph.50.030188.003113. [DOI] [PubMed] [Google Scholar]
- Fink GR, Adams S, Watson JD, Inness JA, Wuyam B, Kobayashi I, Corfield DR, Murphy K, Jones T, Frackowiak RS J, Guz A. Hyperpnoea during and immediately after exercise in man: evidence of motor cortical involvement. Journal of Physiology. 1995;489:663–675. doi: 10.1113/jphysiol.1995.sp021081. [DOI] [PMC free article] [PubMed] [Google Scholar]
- Foreman DL, Sanders S, Bloor CM. Total and regional cerebral blood flow during moderate and severe exercise in miniature swine. Journal of Applied Physiology. 1976;40:191–195. doi: 10.1152/jappl.1976.40.2.191. [DOI] [PubMed] [Google Scholar]
- Friedman DB, Friberg L, Mitchell JH, Secher NH. Effect of axillary blockade on regional cerebral blood flow during static handgrip. Journal of Applied Physiology. 1991;71:651–656. doi: 10.1152/jappl.1991.71.2.651. [DOI] [PubMed] [Google Scholar]
- Friedman DB, Friberg L, Payne G, Mitchell JH, Secher NH. Effects of axillary blockade on regional cerebral blood flow during dynamic hand movement. Journal of Applied Physiology. 1992;71:2120–2125. doi: 10.1152/jappl.1992.73.5.2120. [DOI] [PubMed] [Google Scholar]
- Goldberg JM, Fernandez C. The vestibular system. In: Darian-Smith I, editor. Handbook of Physiology, The Nervous System. Sensory Processes. Vol. 3. Bethesda, MD, USA: American Physiology Society; 1984. pp. 977–1022. section 1. [Google Scholar]
- Gross PM, Marcus ML, Heistad DD. Regional distribution of cerebral blood flow during exercise in dogs. Journal of Applied Physiology. 1980;48:213–217. doi: 10.1152/jappl.1980.48.2.213. [DOI] [PubMed] [Google Scholar]
- Halsey JH, Jr, Blauenstein UW, Wilson EM, Willis EH. Regional cerebral blood flow comparison of right and left hand movement. Neurology. 1979;29:21–28. doi: 10.1212/wnl.29.1.21. [DOI] [PubMed] [Google Scholar]
- Hedlund S, Nylin G, Regnstrøm O. The behavior of the cerebral circulation during muscular exercise. Acta Physiologica Scandinavica. 1962;54:316–324. doi: 10.1111/j.1748-1716.1962.tb02355.x. [DOI] [PubMed] [Google Scholar]
- Heistad DD, Kontos HA. Cerebral circulation. In: Shepherd JT, Abboud FM, Geiger SR, editors. Handbook of Physiology. The Cardiovascular System. Peripheral Circulation and Organ Blood Flow. Vol. 3. Bethesda, MD, USA: American Physiological Society; 1983. pp. 137–182. section 2, part 1. [Google Scholar]
- Iwamoto GA, Wappel SM, Fox GM, Buetow KA, Waldrop TG. Identification of diencephalic and brainstem cardiorespiratory areas activated during exercise. Brain Research. 1996;726:109–122. [PubMed] [Google Scholar]
- Kaufman MP, Forster HV. Reflexes controlling circulatory, ventilatory and airway responses to exercise. In: Rowell LB, Shepherd JT, editors. Handbook of Physiology. Exercise: Regulation and Integration of Multiple Systems. New York: Oxford University Press; 1996. pp. 381–447. section 12. [Google Scholar]
- Kontos HA, Wei EP, Navari RM, Levasseur JE, Rosenblum WI, Patterson JL., JR Responses of cerebral arteries and arterioles to acute hypotension and hypertension. American Journal of Physiology. 1978;243:H371–383. doi: 10.1152/ajpheart.1978.234.4.H371. [DOI] [PubMed] [Google Scholar]
- Laughlin MH, Klabunde RE, Delp MD, Armstrong RB. Effects of dipyridamole on muscle blood flow in exercising miniature swine. American Journal of Physiology. 1989;257:H1507–1515. doi: 10.1152/ajpheart.1989.257.5.H1507. [DOI] [PubMed] [Google Scholar]
- Manohar M. Regional brain blood flow and O2 delivery during severe exertion in the pony. Respiratory Physiology. 1986;64:339–349. doi: 10.1016/0034-5687(86)90127-1. [DOI] [PubMed] [Google Scholar]
- Manohar M. Regional distribution of brain blood flow during maximal exertion in splenectomized ponies. Respiratory Physiology. 1987;68:77–84. doi: 10.1016/0034-5687(87)90078-8. [DOI] [PubMed] [Google Scholar]
- Manohar M, Goetz TE. Regional distribution of blood flow in the brain of horses at rest and during exercise. American Journal of Veterinary Research. 1998;59:893–897. [PubMed] [Google Scholar]
- Norton KI, Delp MD, Prusaczyk KW, Armstrong RB. A comparison of methods used to determine VO2 of exercising humans and animals. Medicine and Science in Sports and Exercise. 1989;21:480–486. [PubMed] [Google Scholar]
- Olesen J. Contralateral focal increase of cerebral blood flow in man during arm work. Brain. 1971;94:635–646. doi: 10.1093/brain/94.4.635. [DOI] [PubMed] [Google Scholar]
- Risberg J, Ingvar DH. Patterns of activation in the grey matter of the dominant hemisphere during memorizing and reasoning. Brain. 1973;96:737–756. doi: 10.1093/brain/96.4.737. [DOI] [PubMed] [Google Scholar]
- Roland PE. Changes in brain blood flow and oxidative metabolism during mental activity. News in Physiological Sciences. 1987;2:120–124. [Google Scholar]
- Roland PE, Skinhøj E, Larsen B, Lassen NA. The role of different cortical areas in the organization of voluntary movements in man. A regional cerebral blood flow study. Acta Neurologica Scandinavica. 1977;64:542–543. [PubMed] [Google Scholar]
- Rossignol S. Neural control of stereotypic limb movements. In: Rowell LB, Shepherd JT, editors. Handbook of Physiology. Exercise: Regulation and Integration of Multiple Systems. New York: Oxford University Press; 1996. pp. 173–216. section 12. [Google Scholar]
- Rowell LB. Human Cardiovascular Control. New York: Oxford University Press; 1993. [Google Scholar]
- Shimazu H, Shinoda Y. Vestibular and Brain Stem Control of Eye, Head, and Body Movements. Farmington, CT, USA: S. Karger Publishers, Inc; 1992. [Google Scholar]
- Sokoloff L. Local cerebral circulation at rest and during altered cerebral activity induced by anesthesia or visual stimulation. In: Kety SS, Elkes J, editors. Regional Neurochemistry. New York: Pergamon; 1961. pp. 107–117. [Google Scholar]
- Thomas SN, Schroeder T, Secher NH, Mitchell JH. Cerebral blood flow during submaximal and maximal dynamic exercise in humans. Journal of Applied Physiology. 1989;67:744–748. doi: 10.1152/jappl.1989.67.2.744. [DOI] [PubMed] [Google Scholar]
- Waldrop TG, Eldridge FL, Iwamoto GA, Mitchell JH. Central neural control of respiration and circulation during exercise. In: Rowell LB, Shepherd JT, editors. Handbook of Physiology. Exercise: Regulation and Integration of Multiple Systems. New York: Oxford University Press; 1996. pp. 333–380. section 12. [Google Scholar]
- Williamson JW, Nobrega AC, Mccoll R, Mathews D, Winchester P, Friberg L, Mitchell JH. Activation of the insular cortex during dynamic exercise in humans. Journal of Physiology. 1997;503:277–283. doi: 10.1111/j.1469-7793.1997.277bh.x. [DOI] [PMC free article] [PubMed] [Google Scholar]